Odontologia
Morphometric analysis of three normal facial types in mixed dentition using posteroanterior cephalometric radiographs: preliminary results
Análise morfométrica dos três tipos faciais normais na dentição mista utilizando radiografias cefalométricas póstero-anteriores: resultados preliminares
Morphometric analysis of three normal facial types in mixed dentition using posteroanterior cephalometric radiographs: preliminary results
Acta Scientiarum. Health Sciences, vol. 39, no. 2, pp. 227-232, 2017
Universidade Estadual de Maringá
Received: 13 November 2016
Accepted: 02 March 2017
Abstract: The aim of the present investigation was to evaluate the craniofacial features of subjects with normal occlusion with different vertical patterns in the mixed dentition using morphometric analysis (Thin-Plate Spline analysis - TPS) applied to posteroanterior (PA) films. The sample comprised 39 individuals (18 females and 21 males), all in mixed dentition, aged from 8.4 to 10 years with satisfactory occlusion and balanced profile and with no history of orthodontic or facial orthopedic treatment. The sample was divided into three groups (mesofacial, brachyfacial and dolichofacial) according to the facial types proposed by Ricketts (1989). The average craniofacial configurations of each study group were obtained by orthogonal superimposition of Procrustes, thereby eliminating size differences and allowing only shape differences between groups to be analyzed by viewing the TPS deformation grid. Significant differences were found among the three facial types but were more remarkable between mesofacials and dolichofacials than between mesofacials and brachyfacials. TPS morphometric analysis proved efficient for accurate visualization of transverse and vertical differences among facial types even before pubertal growth spurt. These differences cannot be easily detected by traditional posteroanterior cephalometry.
Keywords: morphometry, orthodontics, facial type, posteroanterior radiograph.
Resumo: O objetivo da presente investigação foi avaliar as características craniofaciais de indivíduos com oclusão normal e diferentes padrões verticais na dentição mista, utilizando a análise morfométrica (análise Thin-Plate Spline - TPS) aplicada em radiografias póstero-anteriores. A amostra foi composta de 39 indivíduos (18 meninas e 21 meninos), todos com dentição mista, com idades variando entre 8, 4 e 10 anos, com oclusão satisfatória e perfil balanceado e sem histórico de tratamento ortodôntico ou ortopédico. A amostra foi dividida em três grupos (mesofacial, braquifacial e dolicofacial) de acordo com os tipos faciais propostos por Ricketts (1989). As configurações craniofaciais médias de cada grupo em estudo foram obtidas pela sobreposição ortogonal de Procrustes, eliminando, dessa maneira, diferenças de tamanho e permitindo analisar separadamente as diferenças de forma pela visualização das grades de deformação da análise de TPS. Diferenças significativas foram encontradas entre os três tipos faciais, mas foram mais marcantes entre os dolicofaciais e os mesofaciais do que entre os mesofaciais e os braquifaciais. A análise morfométrica TPS provou ser eficiente para a acurada visualização das diferenças transversais e verticais entre os tipos faciais, mesmo antes do pico de crescimento puberal. Essas diferenças não podem ser facilmente detectáveis pela cefalometria póstero-anterior tradicional.
Palavras-chave: morfometria, ortodontia, tipos faciais, radiografias póstero-anteriores.
Introduction
Understanding the relationship between facial form, growth and malocclusions is an important issue in orthodontic treatment. The great variations in growth mix and head form, population differences and sex dimorphic variations result in a
bewildering spectrum of facial types (Enlow & Hans, 1996). There are different underlying patterns in the vertical dimension of the face and an association between masticatory muscles and vertical craniofacial morphology (Lione, Franchi, Noviello, Bollero, Fanucci, & Cozza, 2013). Ricketts, Bench, Gugino, Hilger and Schulhof (1979) classified facial features into vertical facial patterns (brachy, meso and dolichofacial) using lateral cephalometry. These patterns can be applied for the prediction of growth in each of facial pattern and for the establishment of treatment goals and have been used as the index of skeletal malocclusion and facial morphology (Nakakawaji, Kodachi, Sakamoto, Harazaki, & Isshiki, 2002).
Most cephalometric analyses for orthodontic diagnosis are performed by lateral cephalometry. However, the paramount importance of posteroanterior (PA) cephalometry should be stressed as it allows professionals to examine facial asymmetry in the transverse plane while allowing the clinical observation of an individual's face in frontal view (Leonardi, Annunziata, & Caltabiano, 2008; Ulkur, Ozdemir, Germec-Cakan, & Kaspar, 2016).
Enlow and Hans (1996) emphasizes that facial growth is not merely a process of size increase, the child´s face is not a miniature of the adult and no data are available in the literature on the transverse and vertical dentoskeletal characteristics of different normal facial types (brachy, meso and dolichofacial) in the prepubertal stage of the facial development (mixed dentition) in posteroanterior facial view.
The use of geometric morphometric has increased rapidly in the biological sciences over the past decade as forensic sciences, ecology and evolutionary biology. Geometric morphometric analysis (e.g., elliptic Fourier analysis, finite element analysis, tensor and shape coordinate analysis) has been used as an alternative method to overcome the analytical limitations of conventional cephalometric analysis (CCA) (McIntyre & Mossey, 2003; Halazonetis, 2004). The major advantages of these still evolving methods include separate evaluation of shape and size with no need for reference structures or lines and visualization of morphological changes (Defraia, Camporesi, Marinelli, & Tollaro, 2008). One such alternative is Thin-Plate Spline (TPS) analysis that assesses spatial changes in the shape of complex skeletal structures, affording reliable graphic and mathematical representations (Bookstein, 1991). TPS does not resort to any reference or superimposition planes. This morphometric analysis quantitatively evaluates changes in shape, expressing the differences between the configurations of two reference points as a continuous deformation. It also allows the construction of transformation grids that capture differences in form, enabling a more effective visual interpretation (Antunes, Bigliazzi, Bertoz, Ortolani, Franchi, & Faltin, 2013; Bigliazzi, Franchi, Bertoz, McNamara, Faltin, & Bertoz, 2015). Thus, TPS allows precise viewing of the set of changes occurring in facial skeletal structures (Franchi, Pavoni, Faltin, Bigliazzi, Gazzani, & Cozza,, 2016).
The aim of the present investigation was to evaluate the craniofacial features of subjects with normal occlusion with different vertical patterns in the mixed dentition using geometric morphometric analysis (TPS analysis) applied to posteroanterior (PA) films.
Material and methods
The subjects for this study were identified from approximately 2000 patient records at the pediatric and preventive orthodontic clinic of the Dental School of University Paulista - FOUNIP. Institutional review board approval was obtained before the study (no 557/09/CEP/ICS/UNIP).
Subjects were selected on the basis of the following inclusionary criteria: all children had intermediate (permanent incisors and first molars fully erupted, deciduous teeth in the buccal region— canine, first molar, and second molar) or late (canines or premolars erupting) mixed dentitions and normal occlusion (Class I molar and canine relationships, normal overbite and overjet), with no transverse, vertical or sagittal skeletal discrepancies and with a well-balanced facial profile and no report of previous orthodontic or orthopedic treatment. Of the 43 caucasian individuals who fulfilled the inclusion criteria, 4 were excluded due to poor quality posteroanterior (PA) cephalometric radiographs. Therefore, the sample consisted of 39 subjects (21 male, 18 female; mean age, 9.1 year, age range, 8.4 – 10.0 years). The data are described in Table 1.
| Facial Type | Female | Male | Total |
| Mesofacial | 7 | 8 | 15 |
| Brachyfacial | 6 | 7 | 13 |
| Dolichofacial | 5 | 6 | 11 |
| Total | 18 | 21 | 39 |
All tracings were performed by a single investigator (E.A.W.) and subsequently were verified by another investigator (R.B.). Tracings were performed on each lateral and posteroanterior (PA) radiographs.
The sample was divided into three groups (mesofacial, brachyfacial and dolichofacial) (Table 2) using three angular measurements (Ricketts, 1989) (Figure 1), i.e., facial axis (Ba-Na to Pt-Gn), total facial height (Na-Ba to Ba-PM) and lower face height (ANS-Xi to Xi-PM). The reference values used for mesofacials were facial axis between 87 and 93º, total facial height between 63 and 57º, and lower face height from 42 to 48º. For Brachfacials: facial axis above 93º, total facial height lower than 57º and lower face height below 42º. And for dolicho facials: facial axis below 87º, total facial height greater than 63º and lower face height above 48º.
| Facial Type | Mean | Minimum | Maximum |
| Mesofacial | 9y 2m | 8y 5m | 9y 9m |
| Brachyfacial | 9y 1m | 8y 4m | 10y 0m |
| Dolichofacial | 9y 1m | 8y 6m | 9y 4m |
| Total | 9y 1m | 8y 4m | 10y 0m |
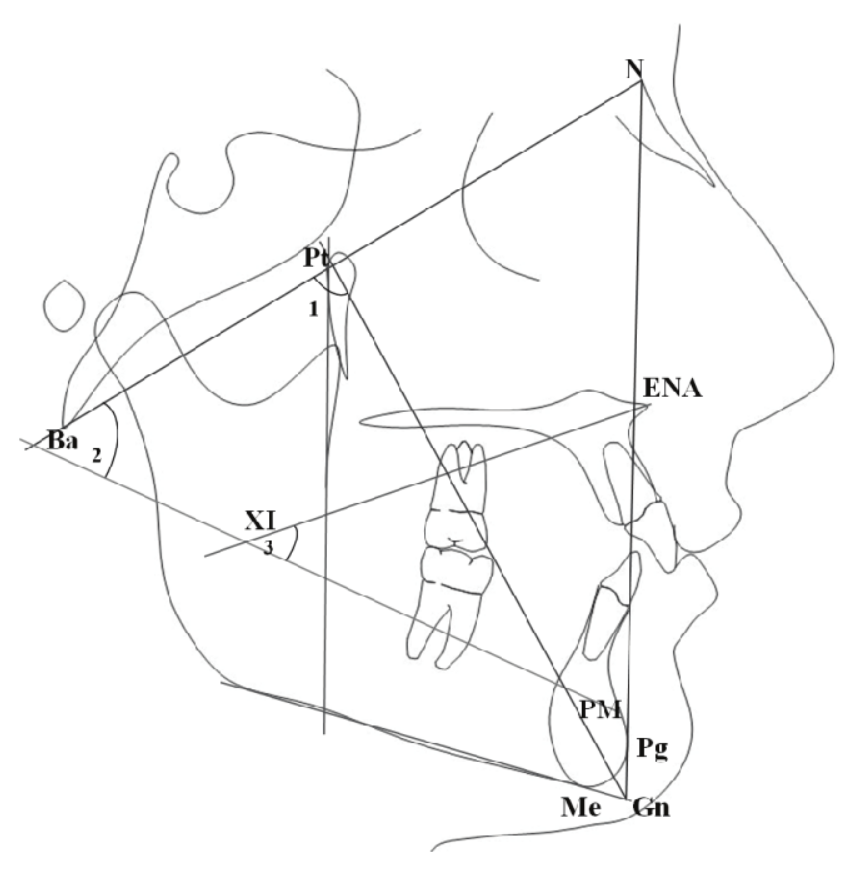
Figure 1. Angular measurements used to determine the facial types.
The following homologous landmarks were digitized on the posteroanterior (PA) tracings (Figure 2) using TPS software (tps Dig2 version 2.16 , Ecology & Evolution, SUNY, Stony brook, NY): 1) orbital - upper right, 2) orbital - upper left 3) zygomatic - upper right, 4) zygomatic - upper left, 5) orbital - right median, 6) orbital - left median, 7) zygomatic - lower right, 8) zygomatic - lower left, 9) right nasal, 10-left nasal, 11) jugal right, 12) jugal left; 13) antegonion right, 14) antegonion left, 15) menton, 16) anterior nasal spine, 17) crista galli, 18) right molar intercuspation, and 19) left molar intercuspation. TPS software (tpsRegr. 1.38, Ecology & Evolution, SUNY, Stony brook, NY) computed the orthogonal least-squares Procustes average configuration of craniofacial landmarks in all groups, using the generalized orthogonal least squares procedures described in Rohlf and Slice (1990). This is a superimposition method whereby shapes defined by the configuration of anatomical homologous landmarks are compared through various optimization criteria. It involves translation (centralization of anatomic landmark configuration), rotation (rotation of all landmark configurations to minimize the distance between them) and scaling (standardization of landmark configuration based on the centroid size). Superimposition parameters are determined to minimize the sum of squares of distances between points in each configuration and their corresponding reference points. Any sample specimen or mean sample configuration (consensus) can act as reference. For each anatomical landmark, the Procrustes residual is the difference between the position of the specimens’ anatomical landmarks and the position of the homologous anatomical landmark in the consensus. The matrix of Procrustes residuals can be used for any statistical procedure (Rohlf & Slice, 1990; Bookstein, 1991).
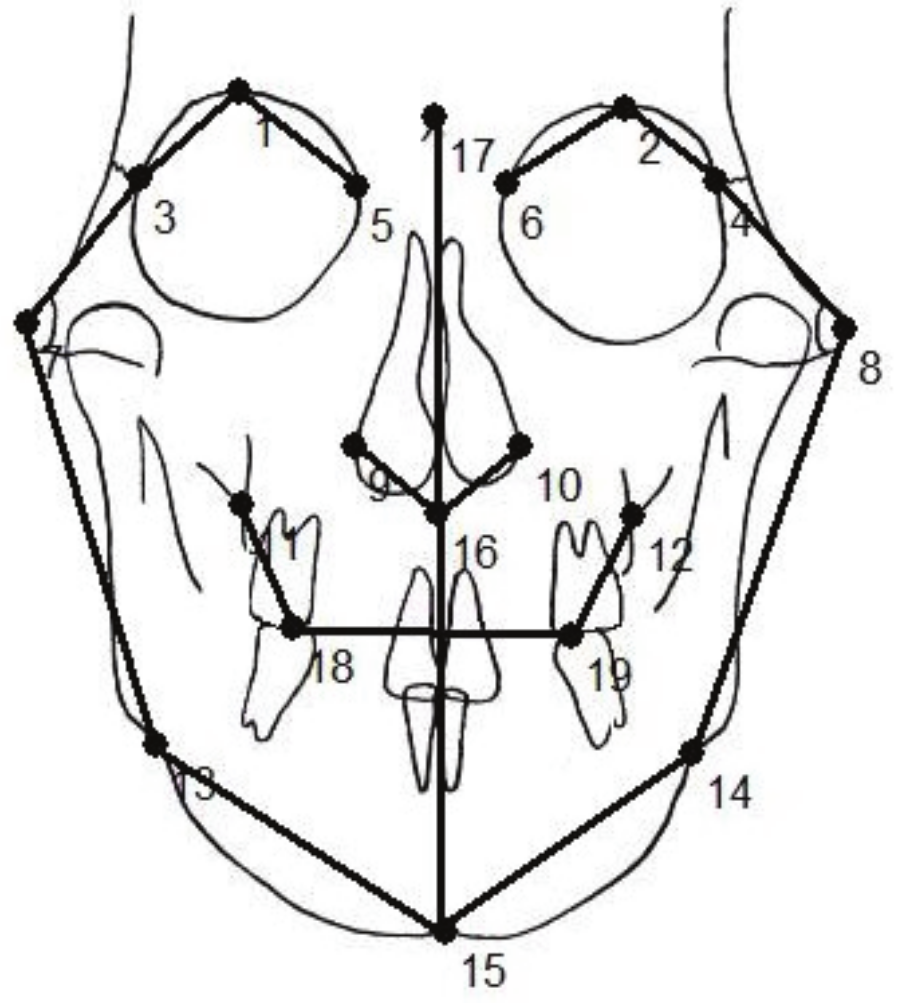
Figure 2. Cephalometric landmarks for thin-plate spline analysis (the lines are merely illustrative and were not used for evaluation purposes).
Differences in size (centroid size analysis) for all groups were tested by means of analysis of variance for a fixed factor (ANOVA). We investigated the normality of residuals (Anderson-Darling test) and equality of variance (Levene's test) to ensure a reliable analysis.
Statistical analysis of shape differences was performed by means of permutation tests with 1000 random permutations on Goodall F statistics (tpsRegr, version 1.38, Ecology & Evolution, SUNY, Stony brook, NY).
Intra observer error was assessed by repeated digitization of 20 randomly selected radiographs after a period of 1 month by the same operator (E.A.W.), using Dahlberg’s formula (Dahlberg, 1940). The average method error for landmark identification was 0.9 mm (SD = 0.2).
Results
Table 3 show the means and standard deviations for centroid size among individuals for the three facial types. As can be seen, the means do not differ substantially, although an apparent increase in size between brachyfacials and dolichofacials can be observed.
| Facial Type | Mean | SD | |
| Brachyfacial | 590.3 | 24.6 | |
| Mesofacial | 596.4 | 14.0 | |
| Dolichofacial | 612.1 | 27.0 |
To check if the means were significantly different we used analysis of variance for a fixed factor (ANOVA). Levene's test was used to confirm equality of variance. A descriptive level of 0.384 was attained, whereby variability was found to be equal. In most tests the hypothesis being tested is the hypothesis of equality. In the above case, the hypothesis is that group variances are all equal. To check the normality of residuals we performed the Anderson-Darling test. A descriptive level of 0.396 was obtained, which led us to conclude that residuals followed a normal distribution. ANOVA results are shown in Table 4. Based on the descriptive level we concluded that there were no significant differences between centroid means.
| Source of variation | Degrees of freedom | Sum of Squares | Mean squares | F statistics | Descriptive level |
| Facial Type | 2 | 1894.0 | 947.0 | 2.25 | 0.125 |
| Residual | 35 | 11361.5 | 420.8 | ||
| Total | 37 | 13255.5 |
The results from the permutation test show significant shape differences (p = 0.0020); there was a high level of morphological dissimilarity between all groups studied (2.6 % – small percentages imply ‘significance’).
To further assess such differences between groups, we once again performed the analysis comparing the mesofacial versus brachyfacial and then the mesofacial versus dolichofacial groups.
The analysis of the transformation grid comparing mesofacial versus brachyfacials showed an upward displacement in the menton and antegonion left and right points (Figure 3). This displacement can be interpreted as a result of the lack of vertical growth / displacement of the mandible and occlusion dimension in brachyfacial group.
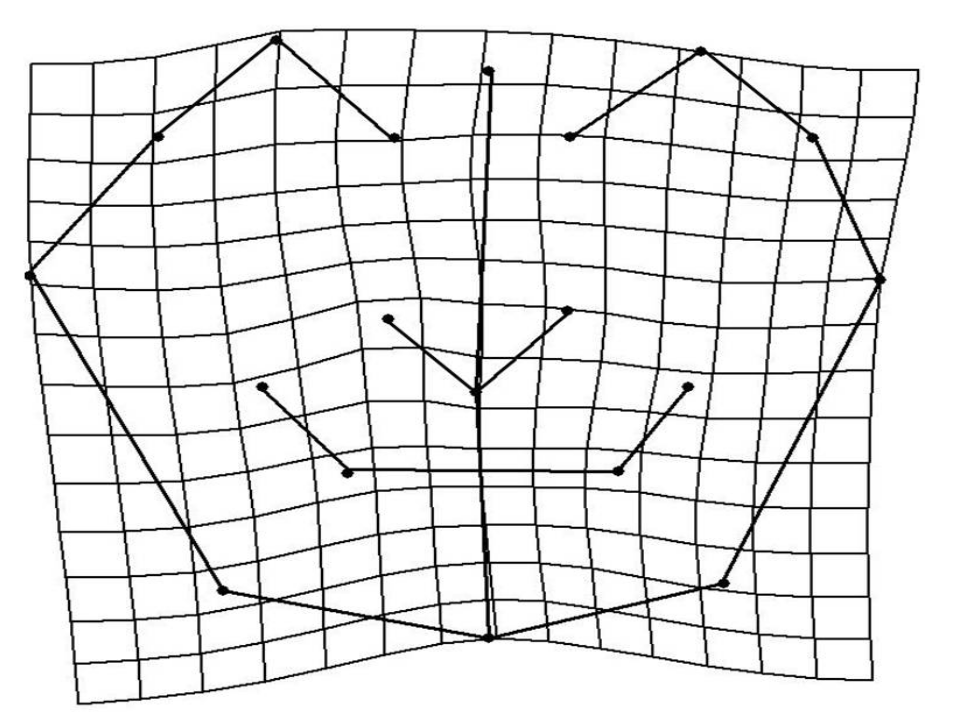
Figure 3. TPS graphical display of shape differences between mesofacial and the brachyfacial group (magnification factor, X3).
We observed a little enlargement displacement in the maxilla (between jugal right and left points) and an enlargement in the right side and a constriction in left side in the zigomatic points. The results from the permutation test, however, did not show significant differences (p = 0.5241) with moderate level of morphological similarity (43.70%).
Mesofacial versus dolichofacial shape analysis revealed significant shape differences (p = 0.0012), there was a high level of morphological dissimilarity between this groups (1.90%). TPS graphical analysis applied to PA cephalograms revealed shape differences in the craniofacial configuration of subjects with mesofacial type when compared with dolichofacial subjects with normal occlusion in the mixed dentition (Figure 4).
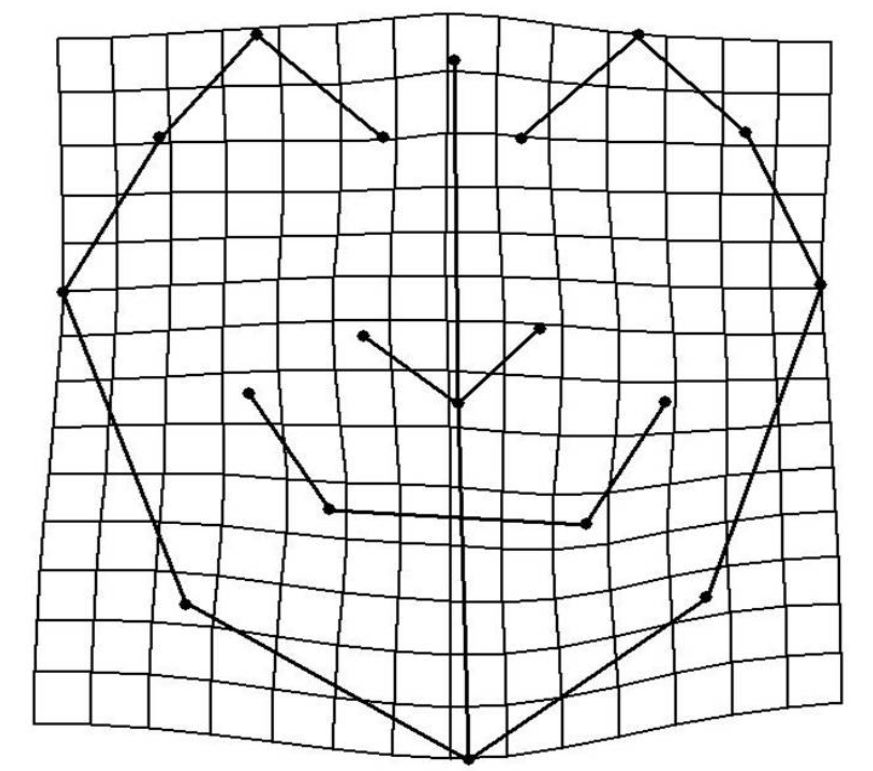
Figure 4. TPS graphical display of shape differences between mesofacial and the dolichofacial group (magnification factor, X3).
The greatest deformation could be described as a contraction in the zygomatic region (ie, a bilateral compression in the horizontal plane at zygomatic point) and of dental level (i.e., a bilateral compression in the horizontal plane at molar intercuspidation bilaterally). An enlargement of vertical plane was also evident at crista galli and menton points.
Discussion
The aim of the present study was to compare the dentoskeletal features of subjects with normal occlusion in the mixed dentition and different facial patterns by means of a geometric morphometric analysis (TPS analysis) applied to PA cephalograms.
Facial patterns have close relationships with neuromuscular activities (Ingervall & Thilander, 1974; Kuroe, Rosas, & Molleson, 2004). The growth of the nasomaxillary complex and the mandible is influenced by the functional matrix because they support most of the functional organs (Enlow & Hans, 1996; Defraia et al., 2008). Two general extremes exist for the shape of the head according to Enlow and Hans (1996): the long and narrow (dolichocephalic) head form and wide, short, globular (brachycephalic) head form. Some methods to identify the facial types are based on the establishment of landmarks and reference lines whose angles, ratios and distances are used to characterize the face. Bishara and Jakobsen (1985) defined the facial types in long, medium and short, while Ricketts et al. (1979) and Ricketts (1989) classified facial features with orthodontic treatment purposes into brachy, meso and dolichofacial patterns using lateral cephalometry.
Our study aimed to contribute to orthodontic diagnosis by analyzing posteroanterior (PA) radiographs using TPS analysis introduced by Bookstein (1991) because traditional cephalometric analyses in orthodontics often depend on specific kinds of orientation of the subjects on reference planes and the univariate analysis of linear measurements mostly reflect variation of size rather than shape (Bigliazzi et al. 2015).
The results of the present study showed that children with dolichofacial type exhibited significant shape differences in craniofacial configuration in the frontal plane when compared with subjects with Mesofacial type; these differences are strongly related with a transverse contraction of the zygomatic and dental level and the increase in the vertical dimension mainly in the mandible. TPS graphical display of shape differences between meso and brachyfacial groups revealed a decrease in lower facial dimension, but the results were not statistically significant.
The small sample size must be considered. However, it should be emphasized that the present sample was composed of children with normal occlusion and skeletal relationship. Our findings support the observation of Nanda (1988) who stated that the pattern of vertical facial development is established at an early age. The facial proportions are maintained or may even worsen over the period of craniofacial growth (Jacob & Buschang, 2011).
The relationship between effective vertical condylar growth (horizontal growth) and vertical growth of the molars, determines whether the mandible rotates backward or forward, or whether it does not rotate (Schudy, 1974). In addition, the development of the nasal part of the face and its interaction with the respiratory pattern, the establishment of the occlusion in permanent dentition, the growth of the maxilla and mandible in vertical, and lateral extent that will later support the full dentition (Enlow & Hans, 1996) could explain why brachy and dolichofacial adolescents might be expected to worsen over time. Some studies (Snodell, Nanda, & Currier, 1993; Yavuz, Ikbal, Baydaş, & Ceylan, 2004) reports that the vertical growth of the face during pubertal growth spurt was greater than the transverse facial growth but they did not consider the possible differences between facial types.
Thin-Plate Spline (TPS) morphometric analysis proved efficient for accurate visualization of transverse and vertical differences among facial types even before pubertal growth spurt. These shape differences cannot be easily detected by traditional PA cephalometry. Further studies using 3D imaging technology such as CBCT and Geometric Morphometrics may bring relevant information to the orthodontic diagnosis.
Conclusion
Analysis and discussion of the results achieved in this study allow us to conclude that no statistically shape significant differences were found when comparing the mesofacial and brachyfacial groups. statistically significant facial morphology differences were found in dolichofacial type with normal occlusion in the mixed dentition in a poster anterior view.
References
Antunes, C. F., Bigliazzi, R., Bertoz, F. A., Ortolani, C. L., Franchi, L., & Faltin, K. Jr. (2013). Morphometric analysis of treatment effects of the Balters bionator in growing Class II patients. Angle Orthodontist, 83(3), 455-459
Bigliazzi, R., Franchi, L., Bertoz, A. P., McNamara, J. A. Jr., Faltin, K. Jr., & Bertoz, F. A. (2015). Morphometric analysis of long-term dentoskeletal effects induced by treatment with Baltersbionator. Angle Orthodontist, 85(5), 790-798.
Bishara, S. E., & Jacobsen, J. R. (1985). Longitudinal changes in three normal facial types. American Journal of Orthodontics, 88(6), 466-502.
Bookstein, F. L. (1991). Morphometrics tools for landmark data. New York, NY: Cambridge University Press.
Dahlberg, A. G. (1940). Statistical methods for medical and biological students. London, UK: Bradford and Dickens.
Defraia, E., Camporesi, M., Marinelli , A., & Tollaro, I. (2008). Morphometric Investigation in the skulls of young adults. A comparative study between 19th century and modern italian samples. Angle Orthodontist, 78(4), 641-646
Enlow, D. H., & Hans, M. G. (1996). Essentials of facial growth. Philadelphia, PA: Saunders.
Franchi, L., Pavoni, C., Faltin, K., Bigliazzi, R., Gazzani, F., & Cozza, P. (2016). Thin-plate spline analysis of mandibular shape changes induced by functional appliances in Class II malocclusion: a long-term evaluation. Journal of Orofacial Orthopedics, 77(5), 325-333
Halazonetis, D. J. (2004). Morphometrics for cephalometric diagnosis. American Journal of Orthodontics and Dentofacial Orthopedics, 125(5), 571-581.
Ingervall, B., & Thilander, B. (1974). Relation between facial morphology and activity of the muscle. Journal of Oral Rehabilitation, 1(2), 131-147.
Jacob, H. B., & Buschang, P. H. (2011). Vertical craniofacial growth changes in French-Canadians between 10 and 15 years of age. American Journal of Orthodontics and Dentofacial Orthopedics, 139(6), 797-805.
Kuroe K., Rosas A., & Molleson T. (2004). Variation in the cranial base orientation and facial skeleton in dry skulls sampled from three major populations. European Journal of Orthodontics, 26(2), 201-207.
Leonardi, R., Annunziata, & Caltabiano, M. (2008). Landmark identification error in posteroanterior cephalometric radiography. A systematic review. The Angle Orthodontist, 78(4), 761-765.
Lione, R., Franchi, L., Noviello, A., Bollero, P., Fanucci, E., & Cozza, P. (2013) Three-dimensional evaluation of masseter muscle in different vertical facial patterns: a cross-sectional study in growing children. Ultrasonic Imaging, 35(4), 307-317.
McIntyre, G. T., & Mossey, P. A. (2003). Size and shape measurement in contemporary cephalometrics. European Journal of Orthodontics, 25(3), 231-242.
Nakakawaji, K., Kodachi, K., Sakamoto, T., Harazaki, M., & Isshiki, Y. (2002). Correlation between facial patterns and function of the masticatory muscles in girls and women. The Bulletin of Tokyo Dental College, 43(2), 51-59.
Nanda, K. S. (1988). Patterns of vertical growth in the face. American Journal of Orthodontics and Dentofacial Orthopedics, 93(2), 103-116.
Ricketts, R. M., Bench, R. W., Gugino, C. F., Hilger, J. J., & Schulhof, R J. (1979). Bio-progressive therapy. Denver, CO: Rocky-Mountain.
Ricketts, R. M. (1989). Provocations and perceptions in craniofacial orthopedics. St. Louis, MO: Rocky Mountain.
Rohlf, F. J., & Slice, D. E. (1990). Extensions of the procrustes method for the optimal superimposition of landmarks. Systematic Zoology, 39(1), 40-59.
Snodell, S. F., Nanda, R. S., & Currier, G. F. (1993). A longitudinal cephalometric study of transverse and vertical craniofacial growth. American Journal of Orthodontics and Dentofacial Orthopedics, 104(5), 471-483.
Schudy, G. F. (1974). Posttreatment craniofacial growth: its implications in orthodontic treatment. American Journal of Orthodontics, 65(1), 39-57.
Ulkur, F., Ozdemir, F., Germec-Cakan, D., & Kaspar, E. C. (2016). Landmark errors on posteroanterior cephalograms. American Journal of Orthodontics and Dentofacial Orthopedics, 150(2), 324-331.
Yavuz, I., Ikbal, A., Baydaş, B., & Ceylan, I. (2004). Longitudinal posteroanterior changes in transverse and vertical craniofacial structures between 10 and 14 years of age. Angle Orthodontist, 74(5), 624-629.
Author notes
bigliazzir@foa.unesp.br