Original research
Implementation of an OBD-II diagnostics tool over CAN-BUS with Arduino
Implementación de una herramienta para diagnóstico OBD-II sobre CAN-BUS con Arduino
Implementação de uma ferramenta para diagnóstico OBD-II em CAN-BUS com Arduino
Implementation of an OBD-II diagnostics tool over CAN-BUS with Arduino
Sistemas & Telemática, vol. 16, no. 45, pp. 45-53, 2018
Universidad ICESI
Received: 04/01/18
Accepted: 02 February 2018
Abstract: From its origin, the main objective of the OBD [On Board Diagnostics] standard has been the control of the gases emitted by the vehicles and its corresponding effects in the environment. This project implements a system based on the OBD-II protocol over a CAN [Controller Area Network] bus, which allows the visualization of variables in real-time and the performing of a diagnosis of the vehicle state showing the operating, failure, and energy consumption codes. The on board diagnosis systems allow to retrieve the stored failure codes together with a large number of variables –important for the diagnosis– such as speed, fuel level, and CO2 [Carbon Dioxide] emissions in real-time. We implemented an OBD-II system located at the end of the test vehicle (a bus) –which corresponds to the scanner or diagnosis unit– in an Arduino Mega 2560 development board connected to a CAN transceiver-controlled composed module. The scanner has a USB connection that eases the graphical visualization of data in a PC through an interface created in LabVIEW.
Keywords: OBD-II, CAN, Arduino, ECU.
Resumen: Desde su surgimiento, el objetivo fundamental del estándar OBD [On Board Diagnostics] ha sido el control de los gases emitidos por los automóviles y de sus efectos en el medio ambiente. Este proyecto implementa un sistema basado en el protocolo OBD-II sobre un bus CAN [Controller Area Network], que permite visualizar variables en tiempo real y realizar un diagnóstico del estado del automóvil que muestra los códigos de funcionamiento, falla y rendimiento energético. Los sistemas de diagnóstico abordo permiten conocer los códigos de fallo almacenados y un gran número de variables de especial relevancia, como la velocidad, el nivel de combustible y el nivel de emisión de dióxido de carbono, en tiempo real. Se implementó un sistema OBD-II centrado en el extremo del bus, que corresponde al escáner o unidad de diagnóstico, en una placa Arduino Mega 2560 conectada a un módulo compuesto transceiver-controller CAN. El scanner posee una conexión USB que facilita visualizar los datos recuperados de forma versátil en una PC a través de una interfaz gráfica creada en LabVIEW™.
Palabras clave: OBD-II, CAN, Arduino, ECU.
Resumo: Desde a sua criação, o objetivo fundamental do padrão OBD [On Board Diagnóstics] tem sido o controle dos gases de escape em automóveis e seus efeitos sobre o meio ambiente. Este projeto implementa um sistema baseado no protocolo OBD-II sobre um CAN [Controller Area Network] BUS, que permite visualizar variáveis em tempo real e realizar um diagnóstico do estado do automóvel que mostre os códigos de operação, falha e eficiência energética. Os sistemas de diagnóstico a bordo permitem conhecer os códigos de falhas armazenadas e um grande número de variáveis de especial relevância, como a velocidade, o nível de combustível e o nível de emissões de dióxido de carbono, em tempo real. Foi implementado um sistema OBD-II centrado no extremo do BUS correspondente ao scanner ou unidade de diagnóstico, em uma placa Arduino Mega 2560 conectada a um módulo composto transceiver-controller CAN. O scanner possui uma conexão USB que facilita a visualização dos dados recuperados de forma versátil em um PC através de uma interface gráfica criada no LabVIEW™.
Palavras-chave: OBD-II, CAN, Arduino, ECU.
I. Introducción
The current Cuban scenario shows an accelerated expansion of the automotive sector associated to the increasing in tourism (non-heavy vehicles) and the amount of trucking vehicles in the roads. In most of the cases, cars in these two divisions have advanced technological features, which include onboard intelligent systems, failure detection, and performance analysis systems including energetic efficiency and environmental effects.
These advances have allowed to simplify the vehicle repairing tasks, seeking to detect potential failures that might damage it, and to centralize the variables visualization in real-time; nowadays, these values can be read from the ECU [Electronic Control Unit] and there are several examples of commercial systems providing the ability to perform vehicle state diagnostics (xTool, 2017).
Some efforts have been developed in the last decade leveraging the applications research related with OBD-II [On Board Diagnostics II], implemented over a CAN bus embedded into the onboard diagnostics systems in automobiles (Simbaña, Caiza, Chávez, & López, 2016; Rayo, 2009)
The present project implements an onboard diagnostics system based on the OBD-II protocol over a CAN bus that will allow both the real-time variables visualization and the diagnostics performance for the vehicle state. Our proposal shows the stored trouble codes and it allows their deletion after solved. The management of this process if performed through a graphical interface developed in LabVIEW.
II. OBD-II Systems
The OBD-II system started to be mandatory in every new vehicle in the United States from 1996, looking for monitoring components that might affect the control system of the gas emission and to measure real-time parameters such as temperature, pressure, and speed. When the OBD-II system detects a problem through its transductors, a warning light is turned on in the instrument panel, alerting the driver of the problem. Furthermore, it stores the information of the detected failures in the computer memory, which eases the technical personnel to find problems and correct them (Meseguer, 2013).
A. Components of the OBD System
The main components of the OBD-II system are: the ECU, also known as the vehicle computer; the transductors, which send the data towards the ECU; the MIL [Malfunction Indicator Lamp], located in the instrument panel; and the DLC [Data Link Connector], which is an interface between the ECU and the devices for diagnostics.
Computer in the Vehicle
The ECU is the computer in the vehicle and its main function is to collect and process data coming from all the engine transductors. It is a device generally located under the instrument panel in the driving seat (Cervantes & Espinosa, 2010).
Transductors
These are the devices in charge of continuously monitor the engine operation (García, 2015). Data collected by the transductors include: the number of revolutions per minute [RPM], temperature of the cooling liquid, manifold absolute pressure, barometric pressure, admission air temperature, position of the gas pedal, and speed.
In Table 1 we present some engine transductors in charge of gathering the mentioned variables and allowing the ECU to determine the fuel amount, ignition point, and other necessary parameters to assess the current vehicle conditions (Zabler, 2002).

Table 1
Transductors of the vehicles
Malfunction indicator lamp
The MIL is used by the OBD-II system to indicate a problem in the engine, detected by the transductors. Its purpose is to alert the driver about the need to perform a maintenance for the vehicle.
Data Link Connector
It is a trapezoid-shaped interface with 16 pins based on the SAE J1962 standard, located under the instrument panel, generally in the driver side. Its function is to be an access and data collecting interface from the ECU towards a diagnostics equipment (automotive scanner) (McCord, 2011). In Table 2, we show a brief description of each DLC pin.
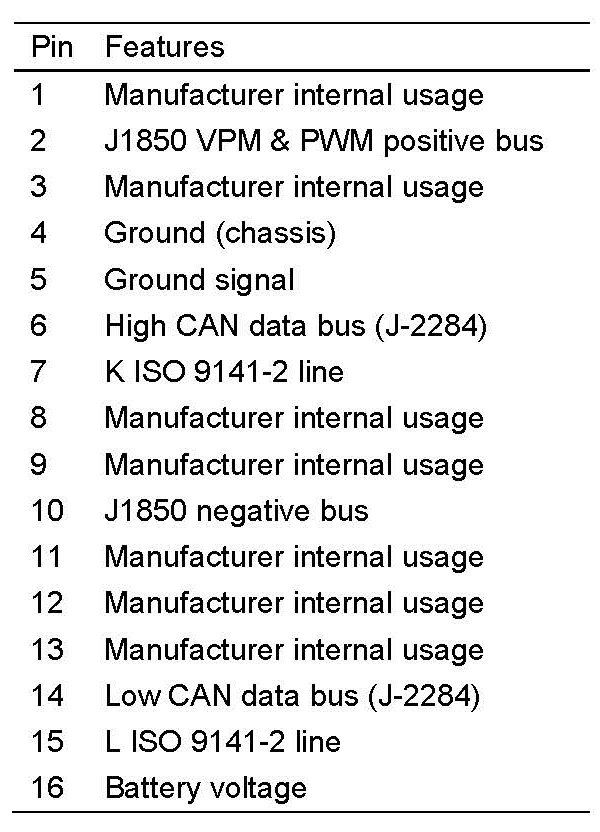
Table 2.
Description of the DLC pins
B. Measuring Modes
The OBD-II system uses 9 measuring modes, each one of them allows the access to the ECU data in the vehicle (see Table 3). In order to request data, it is necessary to use PID [Parameter Identification] codes. Each PID is related with a specific measurement of the modes 1 and 2 of the OBD-II system. For instance, if the real-time datum of the vehicle speed is requested, the mode 1 should be chosen and the PID “0D” has to be used.

Table 3.
Measuring modes supported by the OBD-II system
C. ECU Communication with External Devices
Within the OBD-II system, the communication protocols allow to establish a bidirectional communication to share information between a diagnostics tool (automotive scanner) and the vehicle ECU.
The supported communication protocols for the OBD-II system include the SAE J1850 PWM (pulse width modulation at 41.6 kbps), SAE J1850 (variable pulse width at 10.4 – 41.6 kbps), ISO 9141-2 (asynchronous serial communication at 10.4 kbaud), ISO 14230 KWP (asynchronous serial communication up to 10.4 kbaud), and ISO 15765 CAN (250 – 500 kbps).
III. Architecture proposal for the implemented solution
The OBD-II diagnostics tools are the ones in charge of managing the checking process of technical failures in automobiles; they are part of the evolution in the vehicle electronic system with the incorporation of systems destined to improve the performance, comfort, and safety of the end users.
In this research paper, we propose to implement an OBD-II scanner over a CAN bus and using the Arduino platform by monitoring in a PC through LabVIEW. The interface in charge of controlling the CAN bus is defined by the CAN shield (expansion board) for Arduino, which is manufactured by Seed Studio. Figure 1 presents the developed system.
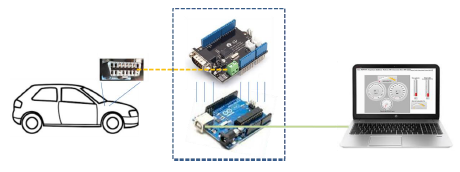
Figure 1.
General diagram of the system
The general diagram of the developed system is divided in two parts: the data gathering stage (scanner) and the graphical interface to visualize and monitor several parameters.
Additionally, we have a professional portable tool to read OBD-II codes as a way to check the results of our system. Besides, we have simulated an equivalent ECU or car computer –in another Arduino board–, which provides an approximate behavior to the reality.
A. Development Environments
Within the system design process, we used several development environments: a high level one –it hosts the graphical interface and, at the same time, the processing of the data collected from the OBD-II scanner–, and the other environment dedicated to program hardware elements, i.e., the Arduino platform acting as USB-CAN adapter.
The application in the high level was developed using the LabVIEW 2011 software. We employed the Arduino IDE [Integrated Development Environment] version 1.8.2 to program the hardware.
LabVIEW™ 2011
Its name represents the acronym for Laboratory Virtual Instrumentation Engineering Workbench. It is a platform and environment to design systems with a graphical programming language; it is recommended for hardware and software testing and its corresponding control and design with real or embedded simulation, since it can speed up the productivity. It uses G language, where the G stands for using a graphical language.
Arduino v1.8.2 IDE
Arduino needs an external software –executed in a PC– to write programs in the development board. This software is commonly called Arduino IDE; it is relatively simple and it is based on Processing. This latter is an open source programming language and IDE based in Java; generally used as a medium to teach multimedia and interactive digital design projects.
In order to use the Arduino IDE, the following procedure is required: a program is coded in the IDE and it is loaded into the Arduino board. The program will execute immediately within it.
The basic structure of the Arduino programming language is simple and it is composed of at least two parts or functions (“setup” and “loop”), entailing code blocks that contain declarations, statements, or instructions.
The “setup” function is in charge of collecting the configuration, it is the first function running in the program and it is executed only once. It is mainly used to initialize the operating modes in the input/output [I/O] pins and to configure the serial communication; although it has many other additional utilities.
The “loop” function has the code to be continuously executed (input reading outputs triggering, etc.). This function is the core of all Arduino program and it is the one performing most of the load.
Arduino UNO R3 Board
Arduino UNO is the electronic board based on the ATmega328P microprocessor. It has 14 digital pins for input/output (6 of them with PWM features), 6 analog entries, a 16 MHz quartz crystal, a USB connection, a DC power outlet, a ICSP header, and a restart button (see Figure 2). The “UNO” name (“one” in Spanish and Italian) was chosen to commemorate the launch of the Arduino IDE 1.0. UNO is the first in a series of Arduino USB boards and the reference model for the platform.

Figure 2.
Arduino UNO R3 board (“Getting...”, 2016)
We chose this board because the electric interface to control the CAN bus (previously described) is designed for total compatibility with Arduino UNO, i.e., it has the same dimensions of the board such as the pinout of the CAN controller for the SPI communication. This is documented in the corresponding library.
Seeed CAN Bus Shield for Arduino
CAN is one of the most employed bus communication protocols due to its relatively long reach, communication speed, and high reliability. It is commonly implemented in control machines and in automotive diagnostics buses. The CAN bus shield board (Figure 3) provides CAN connectivity to the Arduino by using the CAN MCP2515 controller with SPI interface. This latter is in charge of controlling the pre-processing of the CAN messages and it also has a CAN MCP2551 transceiver handling the bus electric interface.
Its main features are:
• It implements CAN 2.0B at speeds up to 1 Mbps;
• it has a SPI interface capable to operate at 10 MHz;
• it supports standard (11 bits), extended (29 bits), and remote frames;
• it has two receiving buffers for storing priority messages, a 9-pin sub-D industrial standard, and 2 LED indicators;
• its operating voltage is 5 V, its dimensions are 68 x 53 mm, and its weight is only 50 g.
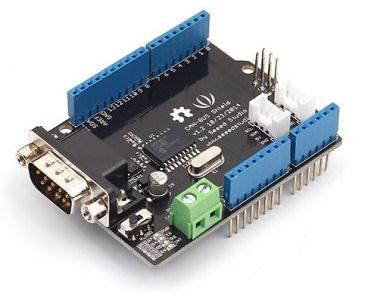
Figure 3.
CAN bus Shield (“Shield...”, n.d)
There are other alternatives to implement the CAN bus, such as the case of the Sparkfun CAN expansion, but it is not completely compatible with Arduino UNO; a modification in the libraries to establish communication between both devices is required. Another example is the OLIMEX PIC32-EMZ64 board developed by Microchip, which implements CAN buses; however, its price is higher than the chosen one.
Vehicle Computer Simulator
It is a representation of an ECU with connected sensors and electric circuits emulating parameters such as speed, acceleration, and others (room temperature and engine coolant temperature). Figure 4 describes this subsystem in a general way.

Figure 4.
ECU simulator
This simulator supports several operation models implemented in the OBD-II standard such as real-time data flow, DTC reading, and failure code bar.
org
Real-Time Data Flow (mode 01)
Parameters such as speed, acceleration, position of the gas pedal, several temperature values, MIL state, fuel level, and statistics related to failures in the engine, among others, can be measured.
DTC Reading (mode 03)
Two data trouble codes have been programmed following the requirements of the OBD message structure to reply a request in mode 03. Additionally, we added an LED to simulate the MIL indicator of the vehicle board –which is activated when a failure is detected–. This action of detecting a failure is triggered by pressing a button implemented and connected to the interruption 1 of the Arduino UNO.
The programmed trouble codes were:
• P0217, temperature excess in the engine; and
• P0143, low voltage in the oxygen sensor circuit (Bank 1, sensor 3).
Erase Trouble Codes (mode 04)
This mode erases the trouble codes and generates a positive response message for the operation mode 04 if the deletion was successful. At the same time, it turns off the LED indicating failures (MIL simulator). We added a shield to provide CAN connectivity and enable the OBD diagnostics.
B. Diagnostics Tool
The system was developed in an Arduino Mega 2560 board (Figure 5) and its corresponding expansion card, providing CAN connectivity and allowing the connection with CAN networks.
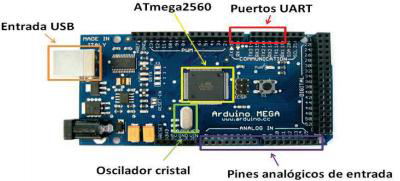
Figure 5.
Arduino Mega 2560 R3 (“Arduino…”, n.d)
We have programmed it to comply with the initial objectives in the OBD-II standard, such as real-time parameters measurement, trouble codes related with failures in the vehicle, and ability to delete the data in the computer once the maintenance in the vehicle solved the issues ("CanOBD2...", 2017).
Developed Scanning Software
The program in the Arduino Mega board was born with the objective to emulate an OBD-II diagnostics interface within it. The scanning software is in charge of making requests through the CAN bus and through the Arduino expansion board handling that data bus. The main program implements the following functionalities:
• Read and process the received commands from the PC related to the diagnostics requests;
• elaborate CAN frames as per the previous commands and related with the 01, 03, and 04 operation modes of the OBD-II standard; and
• receive response messages through the CAN bus and elaborate a frame containing the requested variables by the PC software.
The CAN data bus inside the vehicle has multiple interconnected modules, each one of them is represented by an address or ID. Immediately after the scanner is plugged in and it starts receiving data, we perceived that many messages with different IDs to the expected ones arrived. For the diagnostics case, the system must send the 0x7DF ID and the expected responses must arrive with 0x7E8 and 0x7E9 IDs, corresponding to the most important modules in the system (ISO 15765-4).
For that reason, we decided to apply the message filtering and masking in these functions to ensure the reception of diagnostics messages only. The functions that allow to implement this filter are init_Mask () and init_Filt ().
Table 4 presents an example of the message ID filtering and masking operation method inside the CAN communications protocol.
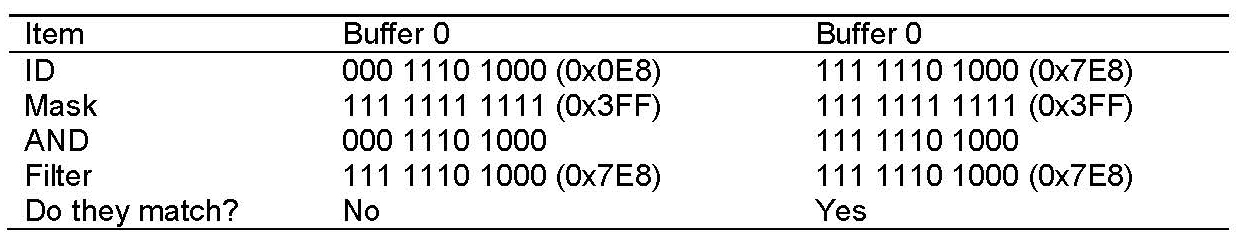
Table 4.
Filtering and masking of CAN messages
The executed code in the “loop” function allows to receive in the PC the commands from the graphical interface, it also provides diagnostics requests to the car ECU. Once the messages are received, it processes them and returns the information to the PC to get a broader visualization.
The requests are made considering the received data. For instance, if the received command has the ID of the main window in the graphical interface, then an OBD-II message is built to survey the related parameters with the indicators in that window, except the DTC deleting requests. These latter have a different command, since they are only user-triggered. Figure 6 shows the set up function flow.
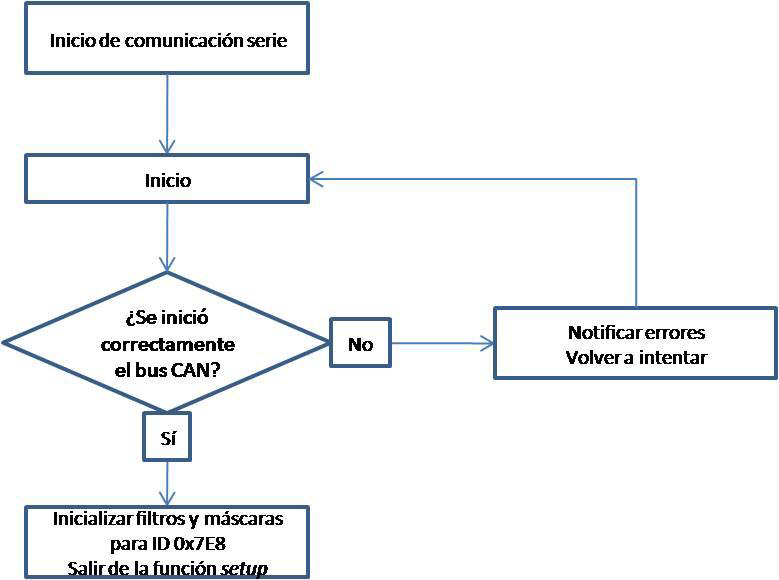
Figure 6.
Flow of the setup function
The requests are formed as per the format in the OBD-II frame for diagnostics requests, i.e., by filling the rest of the “data” field with the value 0x55 (01010101 in binary) to maintain the bit synchrony (Figure 7).

Figure 7.
Structure of the OBD-II request mode 01
C. Graphical User Interface
As mentioned, the graphical interface was developed using the LabVIEW software. The computer acts as a final stage in the processing of the gathered data, which are displayed in a comfortable and pleasant environment; this eases the interaction with the system. From here, it is possible to monitor several parameters in the vehicle distributed in several menu options. Figure 8 presents details from the implemented scanner; Figure 9 the application main window; and Figure 10 the program flow chart.
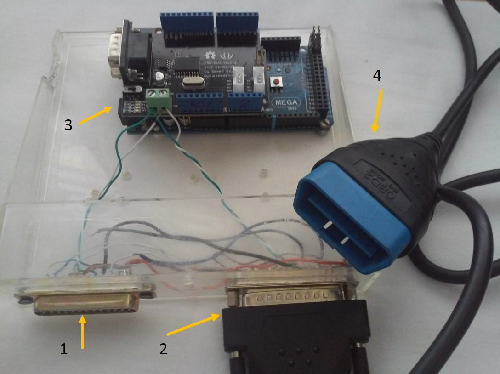
Figure 8.
Implemented scanner: (1) CAN interface to diagnostics the ECU simulator; (2) CAN interface to connect with the vehicle; (3) Arduino Mega 2560 board and CAN bus shield as processing unit; (4) OBD-II (DLC) connector
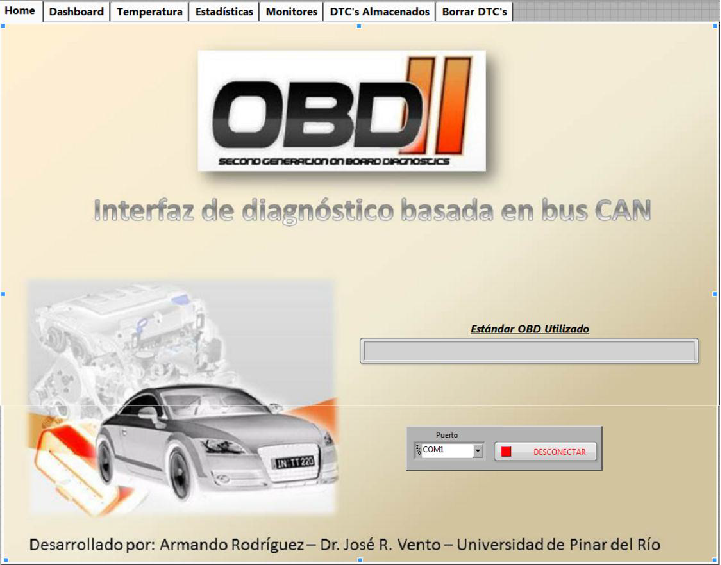
Figure 9.
Application main window
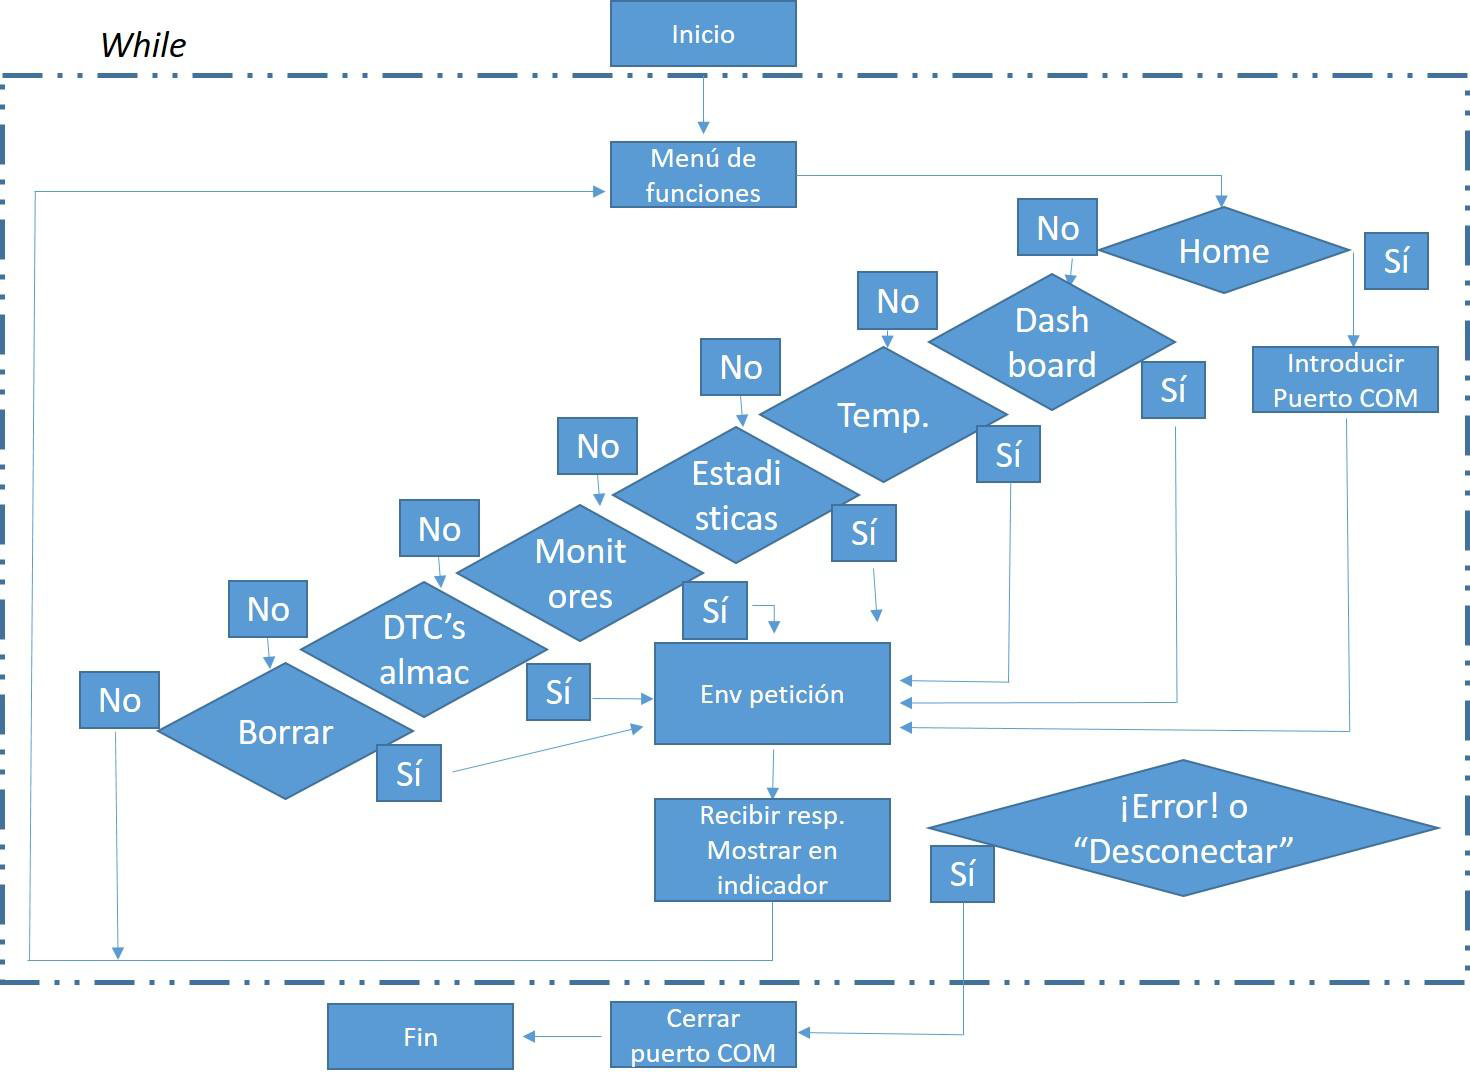
Figure 10.
Program flow in LabVIEW
The application is capable to read through the USB port the data from the Arduino board, framed with the information relative to the desired parameters to visualize. In the top section, it is possible to observe several tabs which ease the access to the menus enabled to execute the tests and actions in the automobile.
At boot time, the application executes –only once– each element in the block diagram as per the hierarchy described in the flow scheme and it stops. Hence, all the diagram is encapsulated in a “while” cycle, ensuring its continuity if errors do not arise or the “unplug” button is not pressed from the front panel. Both conditions determine the program execution and complete each execution cycle takes about 100 ms. For this reason, we can ensure a correct data reading from the automobile and a near approximation to real-time conditions.
IV. Conclusions
With this proposal, we were able to comply with the general objective: to develop an on-board diagnostics system based in the OBD-II protocol over a CAN bus. We developed a tool for vehicle diagnostics, monitoring of technical parameters, and its corresponding real-time visualization through a graphical user interface. This functionality is not available in most of the professional systems commercially available. We also implemented a simulator of the vehicle on-board computer and its diagnostics over CAN bus.
As future works, the project team will face the following tasks:
• Implement the remaining communication protocols in the OBD-II standard to enhance the robustness of the device without compromising the project viability;
• implement a wireless communication interface between the developed scanner and the PC, either via Bluetooth, Wi-Fi, or XBee; and
• continue the research in new technologies to incorporate the current requirements of the third generation OBD standard.
References
Arduino Mega 2560 R3. (n.d). Retrieved from: arduino.cl/arduino-mega-2560/
CanOBD2® Diagnostic Tool™Part#3100e: OBD2 Diagnostic Tool™. (2017). Retrieved from: https://www.innova.com/en-US/Product/Detail/3100e
Cervantes, A. & Espinosa, S. (2010). Escáner automotriz de pantalla táctil [tesis]. Instituto Politécnico Nacional: México.
García, A. (2015). Diseño de una red CAN bus con Arduino [tesis]. Universidad Politécnica de Navarra: Pamplona, España.
Getting Started with Arduino and Genuino UNO. (2016). Retrieved from: https://www.arduino.cc/en/Guide/ArduinoUno
ISO 9141-2:1994 - Road vehicles — Diagnostic systems — Part 2: CARB requirements for interchange of digital information. Geneva, Switzerland: ISO
ISO 14230-2:2016 - Road vehicles — Diagnostic communication over K-Line (DoK-Line) — Part 2: Data link layer. Geneva, Switzerland: ISO
ISO 15765-4:2016 - Road vehicles: Diagnostics on Controller Area Network (CAN). Part 4: Requirements for emission-related systems. Geneva, Switzerland: ISO
McCord, K. (2011). Automotive diagnostic systems. North Branch, MN: CarTech.
Meseguer, J. E. (2013). Caracterización de los estilos de conducción mediante smartphones, dispositivos OBD-II y redes neuronales [tesis de maestría]. Universidad Politécnica de Valencia: España.
Rayo M. O. (2009). Diseño y realización de un sistema on board diagnostics (OBD-II) [trabajo de final de curso]. Universidad Politécnica de Cataluña: Barcelona, España.
Shield introduction. (n.d). Retrieved from: http://wiki.seeed.cc/Shield
Simbaña, W., Caiza, J., Chávez, D., & López, G. (2016). Diseño e implementación de un sistema de monitoreo remoto del motor de un vehículo basado en OBD-II y la plataforma Arduino. Revista Politécnica, 37(1). Retrieved from: http://www.revistapolitecnica.epn.edu.ec/ojs2/index.php/revista_politecnica2/article/view/573/pdf
xTool [Web site]. Retrieved from: www.x-tool.org
Zabler, E. (2002). Los sensores en el automóvil. Stuttgart, Alemania: Robert Bosch GMB.
Author notes
Graduado de Ingeniero en Telecomunicaciones y Electrónica en la Universidad de Pinar del Río [UPR] “Hermanos Saiz Montes de Oca” (Cuba, 2017). Es profesor del Departamento de Telecomunicaciones y Electrónica de la Facultad de Ciencias Técnicas de la Universidad de Pinar del Río desde 2017. Ha impartido asignaturas relacionadas con la electrónica analógica y fuentes de Alimentación. Investiga en automatización de procesos , sistemas de control demótico y sensores de fibra óptica.
Ingeniero en Telecomunicaciones del Instituto Superior Politécnico “José Antonio Echeverría” - CUJAE (La Habana, 1982); Máster en Redes de Telecomunicaciones (1996) y Doctor Ingeniero en Telecomunicación (1998) de la Universidad Politécnica de Madrid (España). Profesor del Departamento de Telecomunicaciones y Electrónica de la Facultad de Ciencias Técnicas de la Universidad de Pinar del Rio desde 1990. Ha impartido las asignaturas relacionadas con redes de telecomunicaciones, telemática y comunicaciones ópticas, y ha sido tutor de varios proyectos de pregrado en Ingeniería, y maestría y doctorado en Telecomunicaciones. Investiga en sensores de fibra óptica y sistemas de control en Internet de las Cosas [IoT].
Ingeniero en Informática (2006) y Máster en Ciencias Forestales (2010). Es profesor asistente del Departamento de Informática de la Universidad de Pinar del Río [UPR] “Hermanos Saiz Montes de Oca”. Actualmente ocupa el cargo de Profesor Principal de Año Académico y es Presidente del Consejo Provincial de la Unión de Informáticos de Cuba (Pinar del Río). Sus áreas de interés profesional son: el desarrollo de aplicaciones en JAVA, la programación web y la programación para dispositivos móviles.
arrodriguez@upr.edu.cu