AGRONOMY (AGRONOMIA)
Sample size to estimate the mean and median of traits in flax
Dimensionamento amostral para a estimação da media e da mediana de caracteres de linho
 Alberto Cargnelutti Filho alberto.cargnelutti.filho@gmail.com
Bruna Mendonça Alves brunamalves11@gmail.com
Gustavo Oliveira dos Santos gustavo_santos_rs@hotmail.com
Cleiton Antonio Wartha cleiton.ufsm@gmail.com
Jéssica Andiara Kleinpaul kleinpauljessica@gmail.com
Daniela Lixinski Silveira danilisil@gmail.com
Alberto Cargnelutti Filho alberto.cargnelutti.filho@gmail.com
Bruna Mendonça Alves brunamalves11@gmail.com
Gustavo Oliveira dos Santos gustavo_santos_rs@hotmail.com
Cleiton Antonio Wartha cleiton.ufsm@gmail.com
Jéssica Andiara Kleinpaul kleinpauljessica@gmail.com
Daniela Lixinski Silveira danilisil@gmail.com
Sample size to estimate the mean and median of traits in flax
Revista Brasileira de Ciências Agrárias, vol. 13, no. 1, pp. 1-7, 2018
Pró-Reitoria de Pesquisa e Pós-Graduação - Universidade Federal Rural de Pernambuco
Received: 08 June 2017
Accepted: 20 October 2017
Published: 30 March 2018
ABSTRACT: The aim of this study was to determine the sample size (i.e., number of plants) required to estimate the mean and median of flax traits (Linum usitatissimum L.) of the cultivar CDC Normandy, with precision levels. In experimental area of 15 × 15 m (225 m2) at 134 days after sowing, 300 plants were collected randomly. In each plant, it was measured morphological (plant height and number of branches) and productive traits (number of capsules, fresh matter of capsules, fresh matter of aerial part without capsules, fresh matter of aerial part, dry matter of capsules, dry matter of aerial part without capsules, and dry matter of aerial part). For each trait, it was calculated measures of central tendency, variability, skewness, and kurtosis. It was determined the sample size by resampling with replacement of 10,000 resamples. In order to estimate the mean of morphological and productive traits of flax, cultivar CDC Normandy, with the amplitude of the confidence interval of 95% equal to 30% of the estimated mean, 81 plants are required. To estimate the median, with the same precision, it is necessary 161 plants.
Key words: experimental design, experimental precision, Linum usitatissimum L., reference sample.
RESUMO: O objetivo deste trabalho foi determinar o tamanho de amostra (número de plantas) necessário para a estimação da média e da mediana de caracteres de linho (Linum usitatissimum L.), cultivar CDC Normandy, em níveis de precisão. Em área experimental de 15 × 15 m (225 m2) aos 134 dias após a semeadura, foram selecionadas, aleatoriamente, 300 plantas. Em cada planta foram mensurados os caracteres morfológicos (altura de planta e número de ramos) e os produtivos (número de cápsulas, massa verde de cápsulas, massa verde de parte aérea sem cápsulas, massa verde de parte aérea, massa seca de cápsulas, massa seca de parte aérea sem cápsulas e massa seca de parte aérea). Para cada caractere, foram calculadas medidas de tendência central, de variabilidade, de assimetria e de curtose e determinado o tamanho de amostra por meio de reamostragem, com reposição, de 10.000 reamostras. Para a estimação da média de caracteres morfológicos e produtivos de linho, cultivar CDC Normandy, com amplitude do intervalo de confiança de 95% igual a 30% da estimativa da média são necessárias 81 plantas. Para estimação da mediana, com essa mesma precisão, precisam 161 plantas.
Palavras-chave: planejamento experimental, precisão experimental, Linum usitatissimum L., amostra referência.
Introduction
The flax (Linum usitatissimum L.) is popularly known as linseed. It is an herbaceous plant of annual cycle, with height of 30-120 cm. It is used as textile fiber and oil for industry. After oil extraction, due to the high content of protein, the residue or linen pie can be used to feed cattle and pigs (Floss, 1983). Wide review on the characteristics and properties of flax and products for human consumption was described in Novello & Pollonio (2011).
Traits such as plant height, number of branches, number of capsules, fresh and dry matter of capsules, and fresh and dry matter of aerial part have been evaluated in flax by Tomassoni et al. (2013), Rossi et al. (2014), and Santos et al. (2014). The determination of plot and sample sizes (number of plants in each plot) and number of replicates are important aspects for the experimental planning. In experiments, generally, there are limitations of financial resources, time and hand labor for the evaluation of all plants in the plots (replicates) of the treatments. Thus, it is usual, in each plot, to evaluate samples (plants) that must be representative of the plot. These samples must be dimensioned to have a good estimation of the mean and median of traits and to obtain appropriate precision. When the data fit the normal distribution (symmetric distribution), the mean and median are the same and separate the data set by 50% below and above the mean or median. This separation in 50% below and above, in case of asymmetric distribution of the data (negative or positive) is obtained with the median, being the measure of central tendency appropriate in these situations.
Research to determine the sample size based on Student’s t distribution has been carried out to estimate the average of morphological and productive traits of crops, such as crambe (Cargnelutti Filho et al., 2010b), turnip (Cargnelutti Filho et al., 2014), Canavalia ensiformis e Dolichos lablab (Teodoro et al., 2014), black oat (Cargnelutti Filho et al., 2015), pigeonpea (Facco et al., 2015; Facco et al., 2016), and sunn and showy rattlebox (Teodoro et al., 2015). The resampling with replacement is independent of the probability distribution of the data set (Ferreira, 2009). Therefore, it is another appropriate methodology for the sample dimension. This methodology has been used to determinate the sample size to estimate the linear correlation coefficient of Pearson among maize traits (Cargnelutti Filho et al., 2010a; Toebe et al., 2015), the mean of morphological traits of pepper fruits (Silva et al., 2011), the mean and median of white lupine traits (Burin et al., 2014), and the mean and coefficient of variation in maize (Toebe et al., 2014). In general, beneficial aspects of correct sample dimension were appointed in these studies.
There were no studies of sample size found to estimate measures of central tendency of flax traits in the literature. The aim of this study was to determine the sample size (i.e., number of plants) required to estimate the mean and median of flax traits (Linum usitatissimum L.) of the cultivar CDC Normandy, with precision levels.
Material and Methods
An uniformity trial (experiment without treatment, which the crop and all procedures performed during the experiment are homogeneous in the experimental area) was conducted with the cultivar CDC Normandy of flax (Linum usitatissimum L.), in experimental area 15 m × 15 m (225 m2) located at 29o42’S, 53o49’W, with 95 m altitude. According to Köppen classification, the climate is Cfa, subtropical humid, with warm summers and without dry season defined (Heldwein et al., 2009). The type of soil of the local trial is classified as ‘Argissolo Vermelho Distrófico arênico’ (Santos et al., 2013). A basic fertilization of 8 kg ha-1 of N, 80 kg ha-1 of P2O5, and 80 kg ha-1 of K2O (only NPK in proportion 02-20-20) was carried out on June 13, 2013. Moreover, a procedure of broadcasting utilizing seeds in the density of 80 kg ha-1 was done in that same day. As recommended for uniformity trials by Storck et al. (2016), the cultural practices were carried out homogeneously in the experimental area.
There were 300 plants randomly selected in the experimental area on October 25, 2013 (134 days after sowing). The plants were in the grain maturation stage at this time. The plants were cut at the soil surface. Thereupon, the plant heigh (PH) of each plant was measured in cm. Also, the number of primary branches on the main stem (NB) and the number of capsules per plant (NC) were counted. In each plant the capsules were removed. The fresh matter of capsules (FMC), in g plant-1, the fresh matter of aerial part without capsules (FMAPWC), in g plant-1, and the fresh matter of aerial part (FMAP=FMC+FMAPWC), in g plant-1, were obtained by weighing. After drying in an oven, it was weighed the dry matter of capsules (DMC), in g plant-1, the dry matter of aerial part without capsules (DMAPWC), in g plant-1, and the dry matter of aerial part (DMAP=DMC+DMAPWC), in g plant-1. In this study, the PH and NR were considered morphological traits. Also, NC, FMC, FMAPWC, FMAP, DMC, DMAPWC, and DMAP were considered productive traits. The number of plants was counted in six plots of 0.5 m × 0.5 m (0.25 m2). The plots were taken randomly in the experimental area and obtained the density of 6,593,333 plants ha-1.
For the nine measured traits (PH, NB, NC, FMC, FMAPWC, FMAP, DMC, DMAPWC, and DMAP), it was calculated the statistics: minimum, percentiles 1, 2.5 and 25, median (percentile 50), percentiles 75, 97.5 and 99, maximum, range, mean, variance, standard deviation, standard error, coefficient of variation, coefficient of skewness, coefficient of kurtosis, and p-value of normality Kolmogorov-Smirnov test. Subsequently, 599 sample sizes were planned for each trait. The initial sample size was two plants and the other ones were obtained with the addition of a plant up to 600 plants. Therefore, for the simulations, the following sample sizes were planned: 2, 3, 4, ..., 600 plants for each trait.
It is possible to construct confidence intervals for the mean and the median by resampling. Thus, for each sample size planned in each trait, there were 10,000 resampling with replacement. For each resample, mean and median were estimated. Thereby, for each sample size of each trait, it was obtained 10,000 estimates of the mean and 10,000 estimates of the median (Ferreira, 2009), and percentiles 2.5 and 97.5 were calculated. Then, for each sample size of each trait, it was calculated the amplitude of the confidence interval of 95% for the mean and the median, through the difference between the percentile 97.5 and percentile 2.5. Hereafter, the sample size (i.e., number of plants) was determined to estimate the mean and median of each trait with precision levels. For this determination, it was started with the initial size (i.e., two plants). It was considered as sample size the number of plants from which the amplitude of the confidence interval of 95% was less than or equal to 20% (greater precision), 21%, 22%, ..., 30% (minor precision) of the mean and the median estimated, respectively. These experimental precisions were considered adequate to estimate the mean and the median.
The mean and percentiles 2.5 and 97.5 of the 10,000 averages of plant height and the 10,000 medians of the dry matter of capsules of each sample size were plotted on graphs. These two traits were plotted as a function of the smaller and greater sample size needed. In the graphical representation of the mean and the limits of the confidence interval of 95%, an interval of ten plants was used for better visual representation. It was started with ten plants because smaller sizes than this one are not of interest since they have large confidence intervals (low precision). The statistical analysis was performed using Microsoft Office Excel® and the R software (R Development Core Team, 2017).
Results and Discussion
In average, the height of flax plants was 57.25 cm and they presented 3.34 branches and 6.27 capsules per plant (Table 1). The fresh matter of capsules (0.72 g plant-1) accounted to 33.29% of the fresh matter of aerial part (2.17 g plant-1). At the same time, the proportion of dry matter of capsules (0.26 g plant-1) related to the dry matter of aerial part (0.78 g plant-1) was 33.03%. Based on the density of 6,593,333 plants ha-1 obtained in the experimental area, the estimates of the fresh matter of capsules (FMC), fresh matter of aerial part without capsules (FMAPWC), fresh matter of aerial part (FMAP), dry matter of capsules (DMC), dry matter of aerial part without capsules (DMAPWC), and dry matter of aerial part (DMAP), were 4,761, 9,539, 14,300, 1,692, 3,432, 5,124 kg ha-1, respectively. These results reflect the proper development of the crop and they were similar to those reported by Tomassoni et al. (2013), Rossi et al. (2014), and Santos et al. (2014).
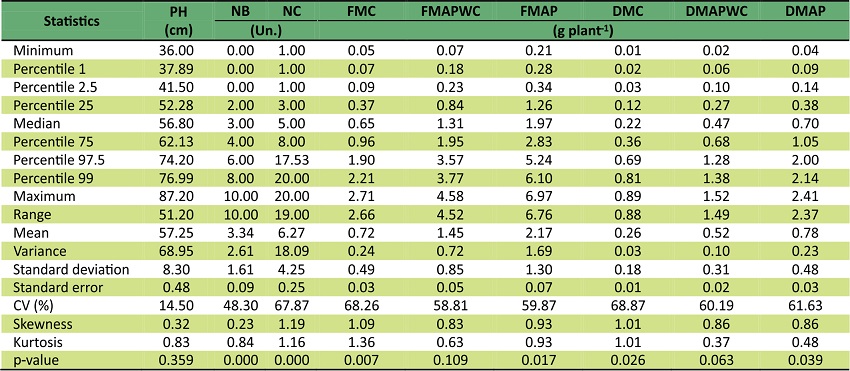
(1) Morphological traits: PH - plant height; NB - number of branches. Productive traits: NC - number of capsules; FMC - fresh matter of capsules; FMAPWC - fresh matter of aerial part without capsules; FMAP - fresh matter of aerial part; DMC - dry matter of capsules; DMAPWC - dry matter of aerial part without capsules; DMAP - dry matter of aerial part.
Regarding to the normality of the data set of nine traits, it is visually observed that plant height had better adherence to the normal distribution in relation to the other eight traits (Figure 1). This good adherence to the normal distribution is confirmed by the high p-value of the Kolmogorov-Smirnov test (p-value = 0.359). Moreover, it is also confirmed by the slight superiority (0.80%) of the mean (57.25 cm) in relation to the median (56.80 cm) and by the low coefficient of asymmetry (0.32) characterizing the symmetry of the distribution (Table 1). These results demonstrate the suitability of the mean as a measure of central tendency of plant height. The data set of the number of branches, despite the reduced coefficient of asymmetry (0.23), did not fit to the normal distribution by the Kolmogorov-Smirnov test (p-value = 0.000). The seven productive traits presented a low p-value in the Kolmogorov-Smirnov test (p-value ≤ 0.109) and consequently did not fit the normal distribution. The higher estimates of the mean in relation to the median explain the strong positive asymmetry (0.83 ≤ asymmetry ≤ 1.19) of these traits. Thus, it can be inferred that to these traits, the median is more reliable than the mean as a measure of central tendency. Therefore, it is evident the importance of determining the sample size to estimate the mean and median of these traits.
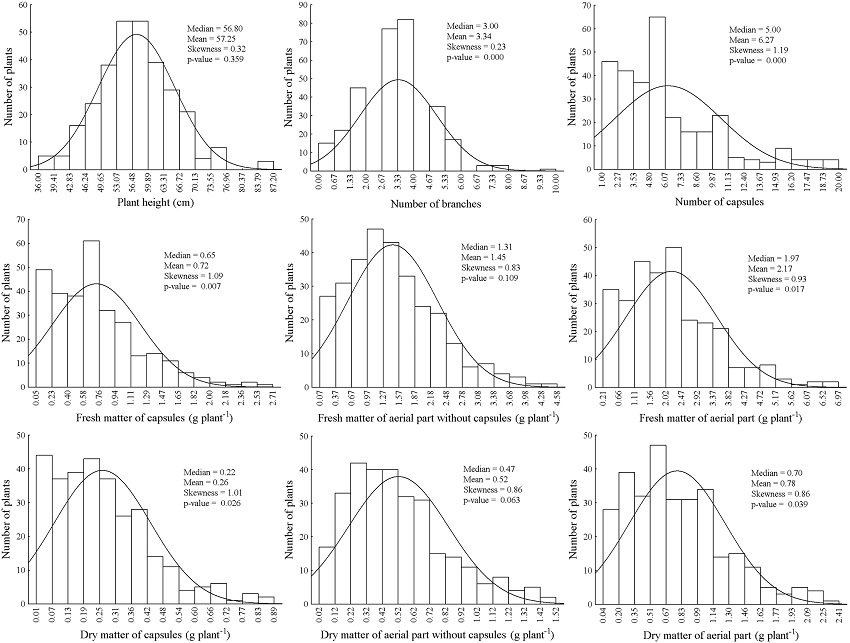
Figure 1
Frequency histograms of traits measured in 300 plants of flax (Linum usitatissimum L.) cultivar CDC Normandy. In the histograms, the line represents the normal distribution curve. Median (percentile 50), mean, skewness and p-value of the Kolmogorov-Smirnov normality test of trait
The productive traits of flax presented higher coefficients of variation (58.81% ≤ CV ≤ 68.87%) compared to morphological traits (e.g., plant height and number of branches, 14.50% and 48.30%, respectively) (Table 1). The average CV of the seven productive traits of flax (63.64%) was 2.03 times greater than the average CV of both morphological traits (31.40%). Similar relations were found in other researches. In the crop of crambe, Cargnelutti Filho et al. (2010b) reported that the CV of productive traits (average of three traits = 56.77%) was approximately 2.4 times the CV of morphological traits (mean three traits = 23.78%). Also, in white lupine the average CV of the seven productive traits (52.23%) was 2.98 times greater than the average CV of both morphological traits (17.55%) (Burin et al., 2014). In turnip, Cargnelutti Filho et al. (2014) observed that the CV of the productive traits (average of eight traits = 68.96%) was approximately 2.1 times the CV of morphological traits (average of 16 traits = 32.20%). In that direction, the superiority of CV of the productive traits in relation to the morphological traits was found in black oat (Cargnelutti Filho et al., 2015). The greater variability of productive traits in relation to morphological of flax, as observed in the crops of crambe, white lupine, turnip, and black oat suggests that for the same level of precision, it is possible to predict larger sample size to measure productive in relation to the morphological traits.
The high number of sampled plants (i.e., 300 plants), associated with its proper development and the variability among the plants confer reliability for that database to the proposed study. Thus, the sample sizes (i.e., number of plants) to estimate the mean of flax traits, which the amplitude of the confidence interval of 95% equal to 20% of the estimated mean (greater precision) ranged between ten and 181 plants, for the traits plant height and dry matter of capsules, respectively (Figure 2 and Table 2). For the same precision, the number of plants to estimate the median oscillated between 11 and 377, respectively, for the traits plant height and dry matter of capsules, respectively. When considering the amplitude of the confidence interval of 95% equal to 30% of the estimated mean (minor precision) to estimate the mean and median, the sample sizes ranged from five to 81 plants and from six to 161 plants, respectively. The variability of the sample size between traits has been described for crops, such as crambe (Cargnelutti Filho et al., 2010b), pepper (Silva et al., 2011), turnip (Cargnelutti Filho et al., 2014), white lupine (Burin et al., 2014), maize (Toebe et al., 2014), and black oat (Cargnelutti Filho et al., 2015).
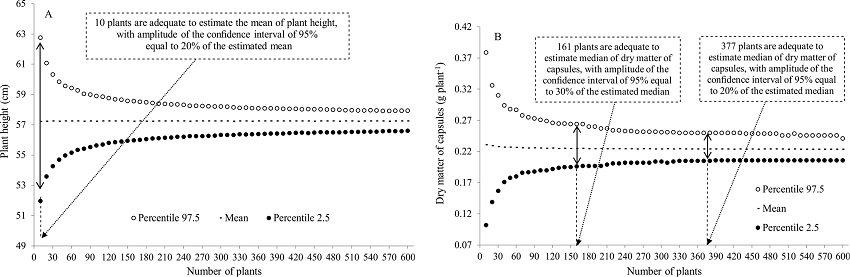
Figure 2
Percentile 2.5, mean and percentile 97.5 of the 10,000 averages of the plant height (A) and 10,000 medians of the dry matter of capsules (B), obtained by resampling (based on 300 plants of flax (Linum usitatissimum L.), cultivar CDC Normandy), in each sample size (i.e., number of plants).
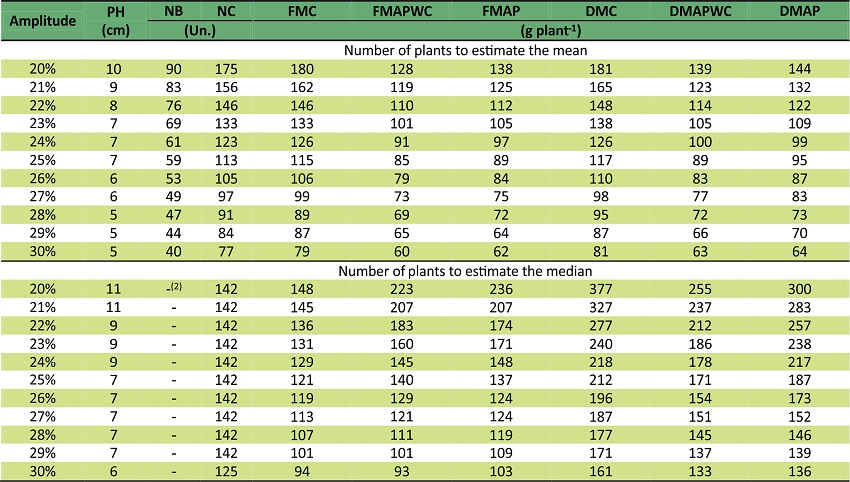
(1) Morphological traits: PH - plant height; NB - number of branches. Productive traits: NC - number of capsules; FMC - fresh matter of capsules; FMAPWC - fresh matter of aerial part without capsules; FMAP - fresh matter of aerial part; DMC - dry matter of capsules; DMAPWC - dry matter of aerial part without capsules; DMAP - dry matter of aerial part. (2) The sample size was not calculated.
In general, to estimate the mean and median with the same precision, the sample size (i.e., number of plants) of productive traits must be greater than the morphological traits (Table 2). Furthermore, the samples to estimate the median must be larger than the samples to estimate the mean for all traits in the same precision levels, as evidenced in white lupine (Burin et al., 2014). This shows advantage of the mean, as a measure of central tendency, in relation to the median.
In practice, the results of this study enable the researcher to choose the appropriate sample size to estimate the measures of central tendency (mean or median) for a given precision (Table 2). Thereafter, the researcher can define the sample size according to the time availability, financial and human resources, and with the desired precision for each trait. Assuming that the sample size has been set as 81 plants (30%, i.e., minor precision), to estimate the mean of a treatment in an experimental design with five repetitions, 17 plants would be sampled by repetition (plot). Assuming that the sample size has been set as 181 plants (20%, i.e., major precision), to estimate the mean of a treatment in an experimental design with five repetitions, 36 plants would be sampled by repetition (plot).
Conclusions
In order to estimate the mean of morphological and productive traits of flax, cultivar CDC Normandy, with the amplitude of the confidence interval of 95% equal to 30% of the estimated mean, 81 plants are required. To estimate the median, with the same precision, it is necessary 161 plants.
Acknowledgements
We thank the Brazilian National Council for Scientific and Technological Development (CNPq) and the Coordination for the Improvement of Higher Education Personnel (CAPES), for granting scholarships.
Literature Cited
Burin, C.; Cargnelutti Filho, A.; Toebe, M.; Alves, B.M.; Fick, A.L. Dimensionamento amostral para a estimação da média e da mediana de caracteres de tremoço branco (Lupinus albus L.). Comunicata Scientiae, v.5, n.2, p.205-212, 2014. https://comunicatascientiae.com.br/comunicata/article/download/317/246. 29 May. 2017.
Cargnelutti Filho, A.; Facco, G.; Lúcio, A.D.; Toebe, M.; Burin, C.; Fick, A.L.; Neu, I.M.M. Tamanho de amostra para a estimação da média de caracteres morfológicos e produtivos de nabo forrageiro. Ciência Rural, v.44, n.2, p.223-227, 2014. https://doi.org/10.1590/S0103-84782014000200005.
Cargnelutti Filho, A.; Toebe, M.; Alves, B.M.; Burin, C.; Santos, G.O.; Facco, G.; Neu, I.M.M. Dimensionamento amostral para avaliar caracteres morfológicos e produtivos de aveia preta em épocas de avaliação. Ciência Rural , v.45, n.1, p.9-13, 2015. https://doi.org/10.1590/0103-8478cr20140504.
Cargnelutti Filho, A.; Toebe, M.; Burin, C.; Silveira, T.R.; Casarotto, G. Tamanho de amostra para estimação do coeficiente de correlação linear de Pearson entre caracteres de milho. Pesquisa Agropecuária Brasileira, v.45, n.12. p.1363-1371, 2010a. https://doi.org/10.1590/S0100-204X2010001200005.
Cargnelutti Filho, A.; Toebe, M.; Silveira, T.R.; Casarotto, G.; Haesbaert, F.M.; Lopes, S.J. Tamanho de amostra e relações lineares de caracteres morfológicos e produtivos de crambe. Ciência Rural , v.40, n.11, p.2262-2267, 2010b. https://doi.org/10.1590/S0103-84782010001100003.
Facco, G.; Cargnelutti Filho, A.; Alves, B.M.; Burin, C.; Santos, G.O.; Kleinpaul, J.A.; Neu, I.M.M. Sample size for estimating average productive traits of pigeon pea. Ciência Rural , v.46, n.4, p.619-625, 2016. https://doi.org/10.1590/0103-8478cr20150852.
Facco, G.; Cargnelutti Filho, A.; Lúcio, A.D.; Santos, G.O.; Stefanello, R.B.; Alves, B.M.; Burin, C.; Neu, I.M.M.; Kleinpaul, J.A. Sample size for morphological traits of pigeonpea. Semina: Ciências Agrárias, v.36, n.6, supplement 2, p.4151-4164, 2015. https://doi.org/10.5433/1679-0359.2015v36n6Supl2p4151.
Ferreira, D.F. Estatística básica. Lavras: UFLA, 2009. 664p.
Floss, E.L. Linho, cultivo e utilização. Passo Fundo: UPF, 1983. 40p. (Boletim Técnico 3).
Heldwein, A.B.; Buriol, G.A.; Streck, N.A. O clima de Santa Maria. Ciência e Ambiente, n.38, p.43-58, 2009.
Novello, D.; Pollonio, M.A.R. Caracterização e propriedades da linhaça (Linum usitatissimun L.) e subprodutos. Boletim do Centro de Pesquisa de Processamento de Alimentos, v.29, n.2, p.317-330, 2011. http://repositorio.unicamp.br/jspui/handle/REPOSIP/108471. 21 May. 2017.
R Development Core Team. R: A language and environment for statistical computing. http://www.r-project.org. 22 Jun. 2017.
Rossi, E.; Lindino, C.A.; Santos, R.F.; Cremonez, P.A.; Nadaleti, W.C.; Antonelli, J. Planting density on growth of golden linseed. Journal of Agronomic Sciences, v.3, n.1, p.19-25, 2014. http://www.dca.uem.br/V3N1/02-Rossi.pdf. 18 May. 2017.
Santos, F.S.; Zanão Junior, L.A.; Dias, P.P.; Santos, R.F.; Pereira, N. Semeadura da linhaça marrom em diferentes espaçamentos. Acta Iguazu, v.3, n.2, p.166-176, 2014. http://e-revista.unioeste.br/index.php/actaiguazu/article/view/10626/7599. 22 Jun. 2017.
Santos, H.G.; Jacomine, P.K.T.; Anjos, L.H.C.; Oliveira, V.A.; Oliveira, J.B.; Coelho, M.R.; Lumbreras, J.F.; Cunha, T.J.F. Sistema brasileiro de classificação de solos. Brasília: Embrapa, 2013. 353p.
Silva, A.R. Rêgo, E.R.; Cecon, P.R. Tamanho de amostra para caracterização morfológica de frutos de pimenteira. Horticultura Brasileira, v.29, n.1, p.125-129, 2011. https://doi.org/10.1590/S0102-05362011000100022.
Storck, L.; Garcia, D.C.; Lopes, S.J.; Estefanel, V. Experimentação vegetal. Santa Maria: UFSM, 2016. 200p.
Teodoro, P.E.; Ribeiro, L.P.; Silva, F.A.; Corrêa, C.C.G.; Luz Júnior, R.A.A.; Torres, F.E. Sample size to estimate biomass and productivity of Canavalia ensiformis and Dolichos lablab. Revista de Ciências Agrárias, v.37, n.3, p.348-353, 2014. http://www.scielo.mec.pt/scielo.php?pid=S0871-018X2014000300012&script=sci_abstract&tlng=en. 10 May. 2017.
Teodoro, P.E.; Silva Junior, C.A.; Ribeiro, L.P.; Silva, F.A.; Corrêa, C.C.G.; Zanuncio, A.S.; Torres, F.E. Sample dimension for estimation of biomass and yield of sunn (Crotalaria juncea L.) and showy rattlebox (C. spectabilis Roth.). Journal of Agronomy, v.14, n.2, p.98-101, 2015. https://doi.org/10.3923/ja.2015.98.101.
Toebe, M.; Cargnelutti Filho, A.; Burin, C.; Casarotto, G.; Haesbaert, F.M. Tamanho de amostra para estimação da média e do coeficiente de variação em milho. Pesquisa Agropecuária Brasileira , v.49, n.11, p.860-871, 2014. https://doi.org/10.1590/S0100-204X2014001100005.
Toebe, M.; Cargnelutti Filho, A.; Lopes, S. J.; Burin, C.; Silveira, T.R.; Casarotto, G. Sample size in the estimation of correlation coefficients for corn hybrids in crops and accuracy levels. Bragantia, v.74, n.1, p.16-24, 2015. https://doi.org/10.1590/1678-4499.0324.
Tomassoni, F.; Santos, R.F.; Bassegio, D.; Secco, D.; Santos, F.S.; Cremonez, P.A. Diferentes densidades de plantio na cultura da linhaça dourada. Acta Iguazu , v.2, n.3, p.8-14, 2013. http://e-revista.unioeste.br/index.php/actaiguazu/article/view/8560/6313. 17 May. 2013.