AGRONOMY (AGRONOMIA)
Sample size to estimate the mean of traits in jack bean
Dimensionamento amostral para a estimação da media de caracteres de feijão de porco
 Alberto Cargnelutti alberto.cargnelutti.filho@gmail.com
Bruna Mendonça Alves brunamalves11@gmail.com
Marcos Toebe m.toebe@gmail.com
Cláudia Burin clauburin@gmail.com
Cleiton Antonio Wartha cleiton.ufsm@gmail.com
Alberto Cargnelutti alberto.cargnelutti.filho@gmail.com
Bruna Mendonça Alves brunamalves11@gmail.com
Marcos Toebe m.toebe@gmail.com
Cláudia Burin clauburin@gmail.com
Cleiton Antonio Wartha cleiton.ufsm@gmail.com
Sample size to estimate the mean of traits in jack bean
Revista Brasileira de Ciências Agrárias, vol. 13, no. 1, pp. 1-7, 2018
Pró-Reitoria de Pesquisa e Pós-Graduação - Universidade Federal Rural de Pernambuco
Received: 31 May 2017
Accepted: 29 November 2017
Published: 30 March 2018
ABSTRACT: In experiments, it is important to evaluate sufficient number of plants, so that inferences have the desired precision. The objective of this research was to determine the sample size (i.e., number of plants) required to estimate the mean of jack bean traits (Canavalia ensiformis) with precision levels. In experimental area of 10 × 16 m (160 m2), 194 plants were collected randomly at 202 days after sowing. The morphological (plant height, stem diameter, number of nodes, and number of leaves) and productive traits (number of pods, fresh matter of pods, fresh matter of aerial part without pods, fresh matter of aerial part, dry matter of pods, dry matter of aerial part without pods, and dry matter of aerial part) were measured in each plant. Measures of central tendency, variability, skewness, and kurtosis were calculated for each trait. The sample size was determined by resampling with replacement of 10,000 resamples. In order to estimate the mean of morphological and productive traits of jack bean with the amplitude of the confidence interval of 95% equal to 40% of the estimated mean, 114 plants are required.
Key words: Canavalia ensiformis, experimental design, sampling.
RESUMO: Em experimentos, é importante avaliar o número suficiente de plantas, para que as inferências tenham a precisão desejada. O objetivo deste trabalho foi determinar o tamanho de amostra (número de plantas) necessário para a estimação da média de caracteres de feijão de porco (Canavalia ensiformis), em níveis de precisão. Em área experimental de 10 × 16 m (160 m2), aos 202 dias após a semeadura, foram selecionadas, aleatoriamente, 194 plantas. Em cada planta foram mensurados os caracteres morfológicos (altura de planta, diâmetro de caule, número de nós e número de folhas) e os produtivos (número de vagens, massa verde de vagens, massa verde de parte aérea sem vagens, massa verde de parte aérea, massa seca de vagens, massa seca de parte aérea sem vagens e massa seca de parte aérea). Para cada caractere, foram calculadas medidas de tendência central, de variabilidade, de assimetria e de curtose e determinado o tamanho de amostra por meio de reamostragem, com reposição, de 10.000 reamostras. Para a estimação da média de caracteres morfológicos e produtivos de feijão de porco, com amplitude do intervalo de confiança de 95% igual a 40% da estimativa da média são necessárias 114 plantas.
Palavras-chave: Canavalia ensiformis, planejamento experimental, amostragem.
Introduction
Jack bean (Canavalia ensiformis) is an important cover crop plant. In research on this crop, as developed by Cavalcanti (2011), Cavalcante et al. (2012), Carvalho et al. (2013), and Duarte et al. (2013), many traits have been measured with different sample sizes. In order to measure the traits with the desired precision, it is crucial to determine the appropriate sample size. The sample size determination has been performed to estimate jack bean traits, such as seed traits (length, diameter, and weight) (Cargnelutti Filho et al., 2012) and productive traits (fresh and dry matter, and yield) (Teodoro et al., 2014). Also, sample size has been established to generate mathematical models for estimating the jack bean leaf area (Cargnelutti Filho et al., 2015b). However, other traits are important, such as plant height, stem diameter, number of nodes, number of leaves, number of pods, fresh matter of pods, fresh matter of aerial part without pods, fresh matter of aerial part, dry matter of pods, dry matter of aerial part without pods, and dry matter of aerial part and the sample size for measuring these traits is unknown.
Generally, there are limitations of financial resources, time, and hand labor in experiments with cover crop plants as in the jack bean case. Thus, it is usual measuring some plants (sample) to estimate the average of a certain trait. These sampled plants should represent the plant population. Sample size is directly proportional to the data variability and the desired confidence degree in the estimate and inversely proportional to the estimation error allowed by the researcher (Bussab & Morettin, 2011).
The sample size determination to estimate the average of morphological and productive traits based on Student's t distribution (Bussab & Morettin, 2011), has been used in cover crop plants, such as turnip (Cargnelutti Filho et al., 2014), jack bean (Teodoro et al., 2014), black oat (Cargnelutti Filho et al., 2015a), pigeonpea (Facco et al., 2015), and Crotalaria juncea and Crotalaria spectabilis (Teodoro et al., 2015). Sample size dimensioning with confidence intervals obtained by resampling is an adequate statistical procedure (Ferreira, 2009), mainly due to its independence of the data probability distribution. This methodology was used to determine the sample size for estimating the means of length, major and minor diameter, and weight of jack bean seeds (Canavalia ensiformis) and velvet bean (Stizolobium cinereum) (Cargnelutti Filho et al., 2012). It was also used in determining the sample size to estimate the mean and median of white lupine traits (Burin et al., 2014) and for estimating leaf area model parameters in jack bean (Cargnelutti Filho et al., 2015b). Regardless the methodology, these studies showed beneficial aspects of the correct sample size determination.
Although the sample size dimensioning has been studied for some jack bean traits (Cargnelutti Filho et al., 2012; Teodoro et al., 2014), there are other important crop traits without sample size dimension. Thus, the objective of this research was to determine the sample size (i.e., number of plants) required to estimate the mean of jack bean traits (Canavalia ensiformis) with precision levels.
Material and Methods
An uniformity trial (experiment without treatment, which the crop and all procedures performed during the experiment are homogeneous in the experimental area) was conducted with jack bean (Canavalia ensiformis), in experimental area 10 m × 16 m (160 m2) located at 29o42'S, 53o49'W, with 95 m altitude. According to Köppen climate classification, the climate is Cfa, subtropical humid, with warm summers and without dry season defined (Heldwein et al., 2009). The type of soil of the local trial is classified as ‘Argissolo Vermelho distrófico arênico’ (Santos et al., 2013). A basic fertilization of 40 kg ha-1 of N, 150 kg ha-1 of P2O5, and 100 kg ha-1 of K2O (only NPK in proportion 08-30-20) was carried out on November 12, 2010. Moreover, a procedure of row sowing was performed in the same day. The spacing utilized was 0.5 m between rows and 0.125 m between seeds in the row, totaling 16 seeds m-2. As recommended for uniformity trials by Storck et al. (2016), the cultural practices were carried out homogeneously in the experimental area.
There were 194 plants randomly selected in the experimental area on June 2nd, 2011 (202 days after sowing). The selected plants were cut at the soil surface when they were in the grain maturation stage. Thereupon, the plant height (PH) of each plant was measured in cm and the stem diameter below the first node (SD) was measured in mm. Also, the number of nodes on the main stem (NN), number of leaves (NL), and number of pods (NP) were counted. In each plant the pods were removed. The fresh matter of pods (FMP), in g plant-1, the fresh matter of aerial part without pods (FMAPWP), in g plant-1, and the fresh matter of aerial part (FMAP=FMP+FMAPWP), in g plant-1, were obtained by weighing. After drying in an oven, it was weighed the dry matter of pods (DMP), in g plant-1, the dry matter of aerial part without pods (DMAPWP), in g plant-1, and the dry matter of aerial part (DMAP=DMP+DMAPWP), in g plant-1. In this study, the PH, SD, NN, and NL were considered morphological traits. Also, NP, FMP, FMAPWP, FMAP, DMP, DMAPWP, and DMAP were considered productive traits. In the harvest moment, the number of plants was counted in three rows of 12.5m randomly taken in the experimental area and obtained the density of 110,933 plants ha-1.
For the 11 measured traits (PH, SD, NN, NL, NP, FMP, FMAPWP, FMAP, DMP, DMAPWP, and DMAP), it was calculated the statistics: minimum, percentiles 1%, 2.5% and 25%, median (percentile 50%), percentiles 75%, 97.5% and 99%, maximum, range, mean, variance, standard deviation, standard error, coefficient of variation, coefficient of skewness, coefficient of kurtosis, and p-value of normality Shapiro Wilk’s test. Subsequently, 599 sample sizes were planned for each trait. The initial sample size was two plants and the other ones were obtained with the addition of one plant up to 600 plants. Therefore, for the simulations, the following sample sizes were planned: 2, 3, 4, ..., 600 plants for each trait.
It is possible to construct confidence intervals for the mean by resampling. Thus, there were 10,000 resampling with replacement for each sample size planned in each trait. Mean was estimated for each resample. Thereby, for each sample size of each trait, it was obtained 10,000 estimates of the mean (Ferreira, 2009), and the percentiles 2.5% and 97.5% were calculated. Then, for each sample size of each trait, it was calculated the amplitude of the confidence interval of 95% for the mean through the difference between the percentile 97.5% and percentile 2.5%. Hereafter, the sample size (i.e., number of plants) was determined to estimate the mean of each trait with precision levels. For this determination, it was started with the initial size (i.e., two plants). The sample size was considered the number of plants from which the amplitude of the confidence interval of 95% was less than or equal to 20% (greater precision), 21%, 22%, ..., 40% (minor precision) of the estimated mean. These experimental precisions were considered adequate to estimate the mean.
The mean and percentiles 2.5% and 97.5% of the 10,000 averages of plant height and the 10,000 averages of the dry matter of pods of each sample size were plotted on graphs. These two traits were plotted as a function of the smaller and greater sample size needed. In the graphical representation of the mean and the limits of the confidence interval of 95%, an interval of ten plants was used for better visual representation. It was started with ten plants because smaller sizes than this one are not of interest since they have large confidence intervals (low precision). The statistical analyzes were performed using Microsoft Office Excel® and the R software (R Core Team, 2017).
Results and Discussion
At 202 days after sowing, the jack bean plants (Canavalia ensiformis) exhibited on average 132.51 cm of height, 13.49 mm of stem diameter, 23.18 nodes, 28.51 leaves and 1.72 pods (Table 1). Moreover, the fresh matter of pods (55.39 g plant-1) corresponded to 16.00% of fresh matter of aerial part (346.26 g plant-1). Concurrently, the ratio of dry matter of pods (23.54 g plant-1) related to the dry matter of aerial part (109.35 g plant-1) was 21.53%. Based on plant density of 110,933 plants ha-1 obtained in the experimental area, the estimates of fresh matter of pods (FMP), fresh matter of aerial part without pods (FMAPWP), fresh matter of aerial part (FMAP), dry matter of pods (DMP), dry matter of aerial part without pods (DMAPWP), and dry matter of aerial part (DMAP) were, respectively, 6,144, 32,267, 38,412, 2,611, 9,519, and 12,131 kg ha-1. Furthermore, fresh matter of 291.94 g plant-1 and dry matter of 71.07 g plant-1 at 120 days after sowing was verified in study done by Cavalcanti (2011). Meanwhile, Cavalcante et al. (2012) evaluated the plants at flowering stage and obtained fresh matter of 16,200 kg ha-1 and dry matter of 3,000 kg ha-1. Moreover, Carvalho et al. (2013) obtained fresh matter of 8,116 kg ha-1 and dry matter of 2,369 kg ha-1 when 50% of the plants were in the flowering stage. At 125 days after sowing, in 50% of flowering stage, Duarte et al. (2013) found 10,500 kg ha-1 of fresh matter. In general, these values were lower than those observed in this study. Thus, the results indicate proper crop development and growth even being lower than those obtained in the maturation stage by Teodoro et al. (2014), which were 60,105 and 20,487 kg ha-1 of fresh and dry matter, respectively.
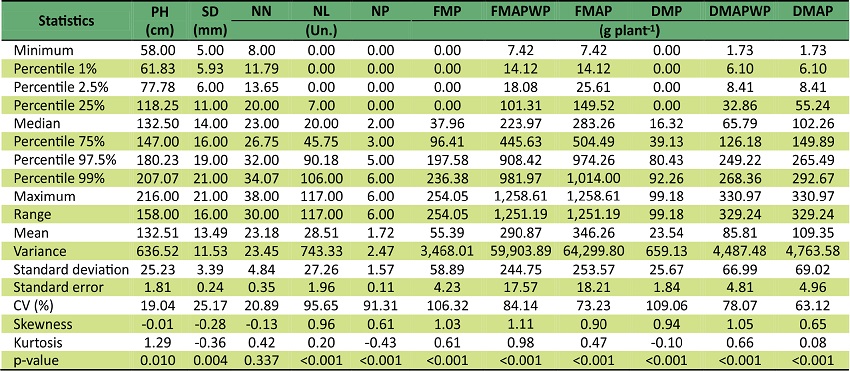
(1) Morphological traits: PH - plant height; SD - stem diameter; NN - number of nodes on the main stem; and NL - number of leaves. Productive traits: NP - number of pods; FMP - fresh matter of pods; FMAPWP - fresh matter of aerial part without pods; FMAP - fresh matter of aerial part; DMP - dry matter of pods; DMAPWP - dry matter of aerial part without pods; and DMAP - dry matter of aerial part.
Among the 11 traits, it is visually observed that the data of three morphological traits (plant height, stem diameter, and number of nodes) presented symmetry closer to zero (|-0.01| ≤ Skewness ≤ |-0.28|, Table 1) and greater proximity to the normal distribution curve on the frequency histogram (Figure 1), suggesting better adherence to the normal distribution than the other eight traits. However, among these three traits (PH, SD, and NN), the adherence to the normal distribution by the p-value of Shapiro Wilk’s test was confirmed only for the number of nodes (p-value = 0.337, Table 1). The remaining eight traits (NL, NP, FMP, FMAPWP, FMAP, DMP, DMAPWP, and DMAP) showed low p-value by the Shapiro Wilk’s test (p-value < 0.001) and positive skewness (Skewness ≥ 0.61) and consequently did not fit to the normal distribution. Sample size determination by resampling is independent of the data probability distribution (Ferreira, 2009). Therefore, this statistical procedure is suitable for this database and the proposed objective.
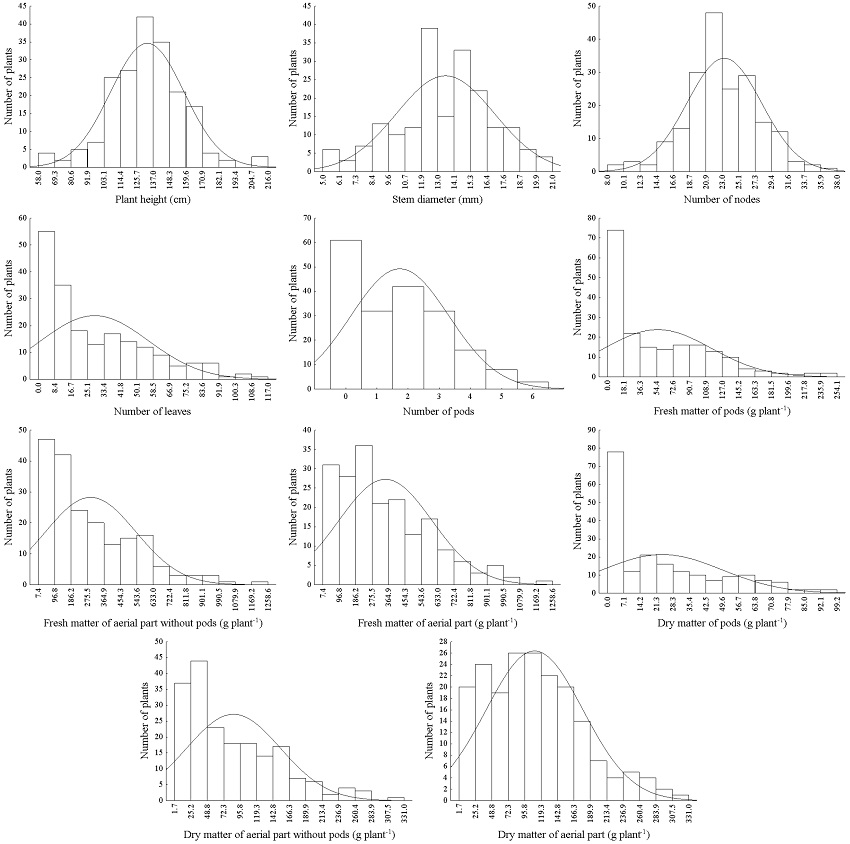
Figure 1
Frequency histograms of traits measured in 194 plants of jack bean (Canavalia ensiformis). In the histograms, the line represents the normal distribution curve.
The productive traits NP, FMP, FMAPWP, FMAP, DMP, DMAPWP, and DMAP exhibited higher coefficients of variation (63.12% ≤ CV ≤ 109.06%, average = 86.46%) compared to the morphological traits PH, SD, and NN (average = 21.70 %), with the exception of NL (CV = 95.65%) (Table 1). Superior coefficients of variation in productive traits compared to morphological traits have been found in research. In white lupine, the medium CV of seven productive traits (52.23%) was 2.98 times greater than the medium CV of two morphological traits (17.55%) (Burin et al., 2014). In turnip Cargnelutti Filho et al. (2014) observed that the CV of the productive traits (average of eight traits = 68.96%) was approximately 2.1 times greater than the CV of morphological traits (average of 16 characters = 32.20%). Furthermore, the superiority of productive traits CV compared to morphological traits was found in black oat (Cargnelutti Filho et al., 2015a). The greater variability of productive traits in relation to morphological traits in jack bean, as it was observed in white lupine, turnip, and black oat suggests that for the same level of precision, larger sample size can be predicted to measure productive traits compared to the morphological traits.
Based on proper plant growth and development of plants and in wide data variability allied with large number of plants (194 plants), it can be inferred that this database provides credibility to the study of sample sizing by resampling. Thus, sample size (number of plants) to estimate the mean of jack bean traits, with amplitude of 95% of confidence interval equal to 20% of the estimated mean (high precision) ranged from 15 to 446 plants for traits plant height and dry matter of pods, respectively (Figure 2A and 2B and Table 2). When considering the amplitude of the 95% confidence interval equal to 40% of the estimated mean (lower precision), sample sizes varied from five to 114 plants. Variability of the sample size has been found among seed (Cargnelutti Filho et al., 2012) and productive traits (Teodoro et al., 2014) in jack bean. Additionally, variability of the sample size among traits was also observed in other cover crop plants, such as velvet bean (Cargnelutti Filho et al., 2012), white lupine (Burin et al., 2014), turnip (Cargnelutti Filho et al., 2014), black oat (Cargnelutti Filho et al., 2015a), pigeonpea (Facco et al., 2015), and Crotalaria juncea and Crotalaria spectabilis (Teodoro et al., 2015).
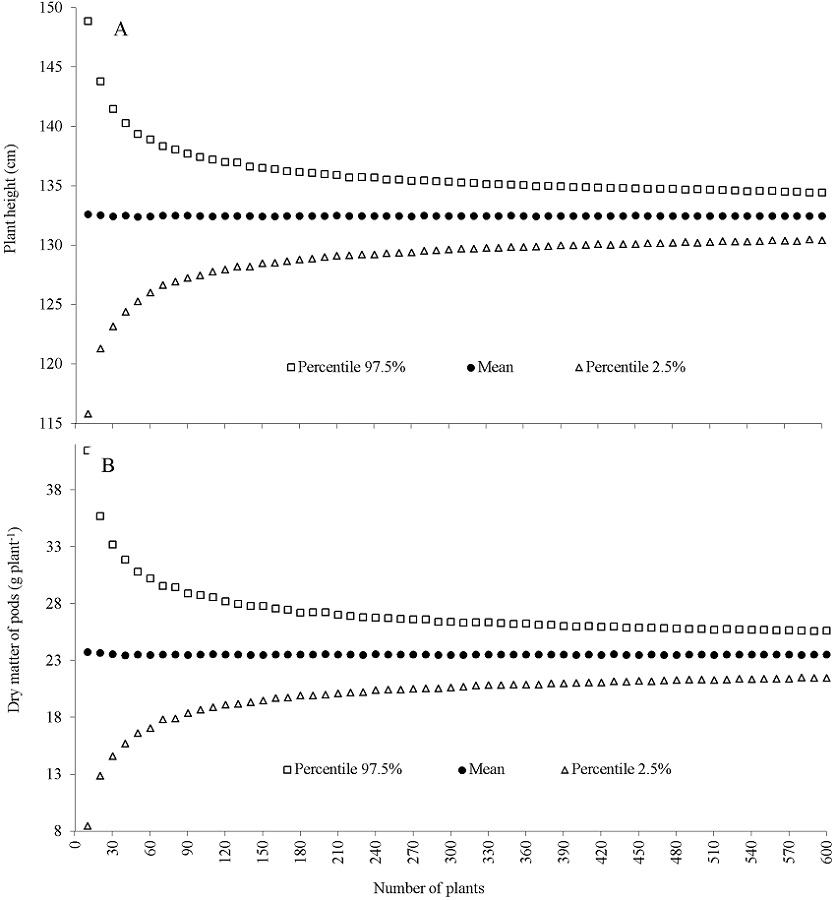
Figure 2
Percentile 2.5%, mean, and percentile 97.5% of the 10,000 averages of plant height (A) and the 10,000 averages of the dry matter of pods (B), obtained by resampling, based on 194 plants of jack bean (Canavalia ensiformis), in each sample size (i.e., number of plants).
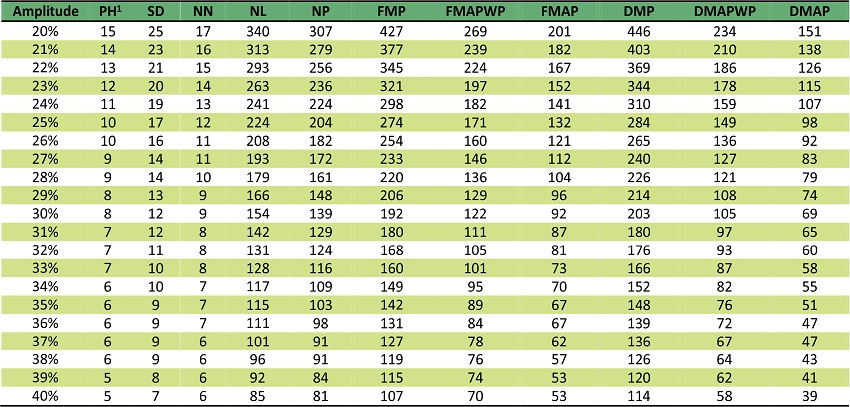
1Morphological traits: PH - plant height; SD - stem diameter; NN - number of nodes on the main stem; and NL - number of leaves. Productive traits: NP - number of pods; FMP - fresh matter of pods; FMAPWP - fresh matter of aerial part without pods; FMAP - fresh matter of aerial part; DMP - dry matter of pods; DMAPWP - dry matter of aerial part without pods; and DMAP - dry matter of aerial part.
Sample sizes comparisons obtained in studies from the Student's t distribution (Cargnelutti Filho et al., 2014; Teodoro et al., 2014; Cargnelutti Filho et al., 2015a; Facco et al., 2015; Teodoro et al., 2015) and from resampling (Cargnelutti Filho et al., 2012; Burin et al., 2014) should be made with caution. It must be considered that, in these studies, the estimation error (precision) in the methodology based on Student's t distribution (Bussab & Morettin, 2011) corresponds to the semi-amplitude of the confidence interval, while in resampling methodology (Ferreira, 2009), the estimation error corresponds to the amplitude of the confidence interval. Thus, for example, the sample size with an estimation error of 10% of the mean (m), i.e., 0.10 × m, obtained based on the Student's t distribution is comparable with the sample size with an estimation error of 20% of the mean (m), i.e., 0.20 × m, obtained based on the resampling.
In practice, the results of this study enable the researcher to choose the appropriate sample size to estimate the average of these traits for a given precision (Table 2). Thereafter, the researcher can set the sample size according to time availability, financial and human resources, and with the desired precision for each trait. Assuming that the sample size has been set as 114 plants (40% of precision), to estimate the mean of a treatment in an experimental design with five repetitions, 23 plants would be sampled by repetition.
Conclusions
In order to estimate the mean of morphological and productive traits of jack bean with the amplitude of the confidence interval of 95% equal to 40% of the estimated mean, 114 plants are required.
Acknowledgements
We thank the Brazilian National Council for Scientific and Technological Development (CNPq) and the Coordination for the Improvement of Higher Education Personnel (CAPES) for granting scholarships.
Literature Cited
Burin, C.; Cargnelutti Filho, A.; Toebe, M.; Alves, B.M.; Fick, A.L. Dimensionamento amostral para a estimação da média e da mediana de caracteres de tremoço branco (Lupinus albus L.). Comunicata Scientiae, v.5, n.2, p.205-212, 2014. https://comunicatascientiae.com.br/comunicata/article/download/317/246. 29 May. 2017.
Bussab, W.O.; Morettin, P.A. Estatística básica. São Paulo: Saraiva, 2011. 540p.
Cargnelutti Filho, A.; Facco, G.; Lúcio, A.D.; Toebe, M.; Burin, C.; Fick, A.L.; Neu, I.M.M. Tamanho de amostra para a estimação da média de caracteres morfológicos e produtivos de nabo forrageiro. Ciência Rural, v.44, n.2, p.223-227, 2014. https://doi.org/10.1590/S0103-84782014000200005.
Cargnelutti Filho, A.; Toebe, M.; Alves, B.M.; Burin, C.; Santos, G.O.; Facco, G.; Neu, I.M.M. Dimensionamento amostral para avaliar caracteres morfológicos e produtivos de aveia preta em épocas de avaliação. Ciência Rural, v.45, n.1, p.9-13, 2015a. https://doi.org/10.1590/0103-8478cr20140504.
Cargnelutti Filho, A.; Toebe, M.; Burin, C.; Alves, B.M.; Neu, I.M.M. Number of leaves needed to model leaf area in jack bean plants using leaf dimensions. Bioscience Journal, v.31, n.6, p.1651-1662, 2015b. https://doi.org/10.14393/BJ-v31n6a2015-26135.
Cargnelutti Filho, A.; Toebe, M.; Burin, C.; Fick, A.L.; Alves, B.M.; Facco, G. Tamanho de amostra para a estimação da média do comprimento, diâmetro e massa de sementes de feijão de porco e mucuna cinza. Ciência Rural, v.42, n.9, p.1541-1544, 2012. https://doi.org/10.1590/S0103-84782012005000057.
Carvalho, W.P.; Carvalho, G.J.; Abbade Neto, D.O.; Teixeira, L.G.V. Desempenho agronômico de plantas de cobertura usadas na proteção do solo no período de pousio. Pesquisa Agropecuária Brasileira, v.48, n.2, p.157-166, 2013. https://doi.org/10.1590/S0100-204X2013000200005.
Cavalcante, V.S.; Santos, V.R.; Santos Neto, A.L.; Santos, M.A.L.; Santos, C.G.; Costa, L.C. Biomassa e extração de nutrientes por plantas de cobertura. Revista Brasileira de Engenharia Agrícola e Ambiental, v.16, n.5, p.521-528, 2012. https://doi.org/10.1590/S1415-43662012000500008.
Cavalcanti, N.B. Influência de diferentes substratos na emergência e crescimento de plantas de feijão de porco (Canavalia ensiformes L.). Engenharia Ambiental, v.8, n.3, p.51-70, 2011. https://ainfo.cnptia.embrapa.br/digital/bitstream/item/43396/1/Nilton-2011.pdf. 29 May. 2017.
Duarte, R.F.; Fernandes, L.A.; Sampaio, R.A.; Santos, L.D.T.; Grazziotti, P.H.; Silva, H.P. Biomass yields, soil cover, content and accumulation of nutrients of some green manure legumes grown under conditions of north of Minas Gerais, Brazil. African Journal of Agricultural Research, v.8, n.21, p.2430-2438, 2013. https://doi.org/10.5897/AJAR2013.7145.
Facco, G.; Cargnelutti Filho, A.; Lúcio, A.D.; Santos, G.O.; Stefanello, R.B.; Alves, B.M.; Burin, C.; Neu, I.M.M.; Kleinpaul, J.A. Sample size for morphological traits of pigeonpea. Semina: Ciências Agrárias, v.36, n.6, p.4151-4164, 2015. https://doi.org/10.5433/1679-0359.2015v36n6Supl2p4151.
Ferreira, D.F. Estatística básica. Lavras: UFLA, 2009. 664p.
Heldwein, A.B.; Buriol, G.A.; Streck, N.A. O clima de Santa Maria. Ciência e Ambiente, v.38, p.43-58, 2009.
R Core Team. R: A language and environment for statistical computing. Vienna: R Foundation for Statistical Computing, 2017. http://www.R-project.org/. 29 May. 2017.
Santos, H.G.; Jacomine, P.K.T.; Anjos, L.H.C.; Oliveira, V.A.; Oliveira, J.B.; Coelho, M.R.; Lumbreras, J.F.; Cunha, T.J.F. Sistema brasileiro de classificação de solos. Brasília: Embrapa, 2013. 353p.
Storck, L.; Garcia, D.C.; Lopes, S.J.; Estefanel, V. Experimentação vegetal. Santa Maria: UFSM, 2016. 200p.
Teodoro, P.E.; Ribeiro, L.P.; Silva, F.A.; Corrêa, C.C.G.; Luz Júnior, R.A.A.; Torres, F.E. Sample size to estimate biomass and productivity of Canavalia ensiformis and Dolichos lablab. Revista de Ciências Agrárias, v.37, n.3, p.348-353, 2014. http://www.scielo.mec.pt/pdf/rca/v37n3/v37n3a12.pdf. 29 May. 2017.
Teodoro, P.E.; Silva Junior, C.A.; Ribeiro, L.P.; Silva, F.A.; Corrêa, C.C.G.; Zanuncio, A.S.; Torres, F.E. Sample dimension for estimation of biomass and yield of sunn (Crotalaria juncea L.) and showy rattlebox (C. spectabilis Roth.). Journal of Agronomy, v.14, n.2, p.98-101, 2015. https://doi.org/10.3923/ja.2015.98.101.