Article
Life Cycle Stages and Debt Maturity in Brazilian Listed Companies
Estágios do Ciclo de Vida e Maturidade da Dívida em Empresas Brasileiras Listadas
 Leonardo Valter Bregonci leonardobregonci@hotmail.com
Vagner Antônio Marques vagner.marques@ufes.br
Bruno Magri Magalhães Pinto bruno.magri01@gmail.com
Hudson Fernandes Amaral hfamaral@face.ufmg.br
Leonardo Valter Bregonci leonardobregonci@hotmail.com
Vagner Antônio Marques vagner.marques@ufes.br
Bruno Magri Magalhães Pinto bruno.magri01@gmail.com
Hudson Fernandes Amaral hfamaral@face.ufmg.br
Life Cycle Stages and Debt Maturity in Brazilian Listed Companies
BBR. Brazilian Business Review, vol. 20, no. 4, pp. 407-425, 2023
Fucape Business School
Received: 04 March 2022
Revised document received: 16 August 2022
Accepted: 18 October 2022
Published: 02 June 2023
ABSTRACT: We have analyzed the association between firms' life cycle stages (LCSs) and their debt maturity (DM). This paper deepens the discussion on capital structure from the perspective of the LCSs' dynamic effect associated with DM. The sample was composed by secondary data from 370 (non-financial) Brazilian listed companies in the period from 2010 to 2019, gathered quarterly. The data were analyzed through descriptive statistics, tests of differences between means and regression analysis from panel data. The results showed that the DM presents no association with LCS, following an inverted U-shape. It has been observed that the maturity stage had a positive effect on the DM, however, as companies move towards the shake-out and decline stages, DM experiences successive reductions. The findings are relevant for providing insights for future research. In addition, they have the potential to contribute to managers, board members, credit committees, capital providers in general, risk management process, and resource allocation.
Keywords: Life Cycle Stages, Debt Maturity, Corporate Finance.
RESUMO: Este trabalho analisou a associação entre os Estágios do Ciclo de Vida da Firma (ECVs) e a Maturidade da Dívida (MD). O estudo aprofunda as discussões sobre estrutura de capital a partir da análise do efeito dinâmico dos ECVs associados à MD das empresas brasileiras. A amostra foi composta por dados trimestrais de 370 empresas (não financeiras) brasileiras listadas no período de 2010 a 2019. Os dados foram analisados por meio da estatística descritiva, testes de diferenças entre as médias e análise de regressão com dados em painel. Os resultados demonstraram uma MD associação com os ECVs, seguindo um formato de U invertido. Observou-se que o estágio de Maturidade afeta positivamente a MD, contudo, à medida que as empresas transitam em direção ao estágio de Turbulência e Declínio, a MD sofre reduções sucessivas. Os achados são relevantes por proporcionarem insights para pesquisas futuras e apresentarem potencial de contribuição para gestores, conselheiros de administração, comitês de crédito e provedores de capital em geral na análise de crédito das empresas, gestão de riscos e concessão de recursos.
Palavras-chave: Estágios do Ciclo de Vida, Maturidade da Dívida, Finanças Corporativas.
1. INTRODUCTION
Derived from the capital structure literature, the debt maturity term represents the maturity structure (term) of the resources derived from third parties, used by companies to finance the acquisition of assets and the development of their activities (Dangl & Zechner, 2021). Nnadi et al. (2022) highlights that discussions on the subject have sought to understand the endogenous and exogenous factors to the firm and that they can influence the manager's decision to capture new debt resources (leverage) and/or restructure their maturity (debt maturity). In this sense, La Rocca et al. (2011) explain that the models of capital structure and debt maturity tested are static-therefore, the existence of a dynamic component would deepen the understanding of the phenomenon.
According to Habib and Hasan (2019), in recent years, several studies have used the firm's life cycle stages (LCSs) approach to understand the effect of dynamism on companies' financial decisions. Dickinson (2011) defines LCSs as combinations of endogenous and exogenous factors to the firm, which conditions it to different levels of agency costs and information asymmetry and, thus, results in different incentives for its operating strategies, financing policies and resource allocations. Faff et al. (2016) state that it is reasonable to expect that transitions between LCSs firms receive specific incentives and conditions to carry out appropriate financial policies for each moment.
Habib and Hasan (2019) argued that the dynamic aspects of LCSs should be considered in accounting and finance research, including the capital structure. In this sense, it is observed that studies in corporate finance have deepened the discussion about the choices about the capital structure by the approach of LCSs (Castro et al., 2016; Faff et al., 2016; La Rocca et al., 2011; Rehman et al., 2016; Teixeira & Coutinho dos Santos, 2014; Tian et al., 2015; Lobo et al., 2018). In the meantime, but in a smaller amount, some studies sought to analyze the dynamic LCSs effect on debt maturity (Geelen, 2019; Lobo et al., 2018; Teixeira & Coutinho dos Santos, 2014; Zhang & Xu, 2020).
However, although the international literature has walked towards obtaining more robust empirical evidence on the subject, in the national literature there is a demand for studies that analyze DM while considering LCSs. In this context, the present study sought to answer the following problem: what is the association between the stages of the firm's life cycle and the maturity of the debt of Brazilian companies listed on the B3? Thus, we analyzed the hypothesis that LCSs significantly affect the DM of the companies investigated. The descriptive, documentary work with a quantitative approach, analyzed quarterly data from a sample of 370 non-financial companies listed on the B3, from 2010 to 2019, using descriptive statistics, tests of differences between means, and regression with panel data.
This study differs from previous ones, as it sought empirical evidence of the dynamic effect of LCSs on the DM of Brazilian companies, filling a gap in the national literature on accounting and corporate finance. Additionally, it empirically contributes using an alternative metric that seeks to capture the DM with greater adequacy to the construct. Finally, it brings the importance of controlling the financial cycle variable in econometric models on LCSs and DM.
The results contribute with empirical evidence regarding dynamic factors that influence financial decisions, in addition to providing insights for future researchers. In addition, by demonstrating that corporate debt strategies are consistent with the transitions of LCSs, managers and financial institutions will be able to better understand the dynamics of debt optimization and, thus, develop appropriate policies to mitigate uncertainties in their activities and for the sustainability of their businesses. Specifically, capital providers can incorporate LCSs into their models and adjust their credit policies by establishing maturities and other contractual clauses more appropriate to that company, while managers could analyze the proper time to resort to these sources since the LCSs reflect the cost of raising funds (Hasan et al., 2015).
2. LITERATURE REVIEW
2.1. Finance theory and determinants of debt maturity
Since the works of Modigliani and Miller (1958, 1963) were published, discussions and theories about capital structure have developed and seek to explain, among other aspects, how DM choices affect the value of a company, assuming more realistic premises, like: i) agency; (ii) trade-off static; (iii) signaling; (iv) liquidity risk and v) maturity-matching.
The Agency Theory considers that increased agency costs and informational asymmetry are incentives for managers/firms to adopt specific choices, including decisions such as DM (Barnea et al., 1980; Jensen & Meckling, 1976). For Barnea et al. (1980), in a scenario of strong information asymmetry, using short-term resources, the losses resulting from the undervaluation of projects would be mitigated, as well as reduce the sensitivity to changes in the variance of asset returns distribution. In this sense, an inverse relationship is observed between growth opportunities and debt maturity.
On the other hand, according to the Trade-off Theory, the company seeks optimal indebtedness by balancing the tax benefits of debt and the costs of that debt. To Kane et al. (1985), firms lengthen debt maturity as the tax advantage of loans and financing decreases, which would result in an inverse relationship between the tax burden and debt maturity. Fan et al. (2012) also point out that the firm's profitability is also related to the debt maturity as the higher it is, the more the company distances from the risk of default. Thus, at this scenario, profitable companies’ managers would increase tax benefits by borrowing on long-term debt.
Based on signaling theory, Flannery (1986) states that companies would seek to differentiate themselves from others by signaling the quality of their projects by choosing their debt maturity. Diamond (1991) points out that, in the presence of transactional costs, companies prefer the issuance of longer-term debt since its issuance cost is diluted throughout the debt maturity. On the other hand, Diamond (1991) observes that companies with a high credit rating represent greater reliability for creditors and, therefore, could have access to debts of greater maturity. However, in the presence of informational asymmetry, they have incentives to use more short-term resources since they estimate that their next rating will be higher, in order to obtain better terms on upcoming debt deals.
Another perspective is the hypothesis of financial liquidity risk. According to Flannery (1986), creditors absorb the costs associated with the risk of bankruptcy to prepare restrictive debt contractual clauses and/or to increase the monitoring of their operations. In this sense, the collateral property of tangible assets, for example, acts as a “real guarantee” for creditors to mitigate the risks associated with loans and financing, allowing greater access to long-term resources for firms that have this condition. However, the increased volatility in the results represents greater unpredictability about the expectations of the firm to honor its obligations. Therefore, an inverse relationship between volatility in the results and DM is expected (Fan et al., 2012).
Finally, in the maturity-matching hypothesis (MMH), the choice of the DM structure should follow a “match” with the cash flow expectations of the assets. Thus, managers would have control over financing needs in order to meet operational demands and, therefore, would distance themselves from the risk of default (Diamond, 1991). According to Emery (2001), when the company is faced with an increase in demand for its products, it is necessary to obtain more supplies to increase its production, and in this scenario, the search for external resources is more favorable. In this way, companies should follow a short-term debt maturity as managers would be prone to constantly renegotiate their debt and, thus, have greater flexibility to respond more efficiently to peaks in demand. Hence, MMH predicts a positive relationship between asset maturity and debt maturity.
2.2. The role of firm life cycle stages in financing decisions
According to Dickinson (2011), although there is no consensus on the definition of firms' life cycle stages (LCSs), the literature assumes that the LCSs present themselves as distinct and identifiable phases resulting from changes in internal factors (e.g., choice of strategy, financial resources, and managerial capacity) and external factors (e.g., competitive environment, macroeconomic factors). Thus, Dickinson (2011) states that the LCSs are the integrated results of companies' strategies and resource allocations.
Habib and Hasan (2019) conducted a systematic review of the literature on LCSs and highlighted the relevance of considering them in accounting and finance studies. According to the authors, the hypothesis of change in the level of informational asymmetry and financial indicators that companies experience in each LCSs substantiate the insights into their influence on financing decisions. Thus, LCSs can be presented as a realistic and dynamic tool in the study of financial policies followed by companies.
In this sense, several studies have empirically contributed to the construction of knowledge about the effect of LCSs on investment and financing decisions, highlighting: DeAngelo et al. (2010), Hasan et al. (2015), Faff et al. (2016), O'connor (2017), Stam and Verbeeten (2017) and Lobo et al. (2018). Such choices reflect the need and ability to execute investment projects, creditors' risk perception, contractual terms of debt, cost of loans and financing (Lobo et al., 2018). Therefore, it is understood that LCSs are fundamental to understanding the phenomenon of DM (Habib & Hasan, 2019).
Additionally, the empirical literature on corporate finance has sought to understand the influence of the LCSs dynamism on capital structure decisions. In general, it appears that the determinants of capital structure vary significantly throughout the LCSs and point to the need for specific adjustments in the capital structure at each of these stages (Teixeira & Coutinho dos Santos, 2014; Castro et al., 2016; Faff et al., 2016; Lobo et al., 2018).
It so happens that the explanatory variables of the capital structure are also used to analyze the determinants of the DM structure (Fan et al., 2012). As such, some researchers broadened the discussion and included LCSs as a dynamic component in financing decisions and investigated the effects of LCSs on debt maturity (Teixeira & Coutinho dos Santos, 2014; Lobo et al., 2018; Geelen, 2019; Zhang & Xu, 2020). Teixeira and Coutinho dos Santos (2014) studied the influence of LCSs on the choices of capital structure and debt maturity of Portuguese and Spanish companies in the period from 1994 to 2003. The authors concluded that companies tend to adopt specific financing strategies as they change LCSs. Specifically, they observed that: (i) total debt increases during the early stages of the companies' life cycle and decreases during the last stage; (ii) leverage is negatively related to profitability at all stages of the life cycle; and (iii) the asset structure is positively associated with long-term debt throughout the LC, except in the maturity stage.
Lobo et al. (2018) examined how the private debt market is influenced by LCSs in defining loan agreement terms. Using a sample of U.S. publicly traded companies from 1994 to 2015, they show that the cost of corporate loans decreases in the introduction and growth stages and reaches the minimum point in the maturity stage but increases in shake-out LCSs (turbulence) and decline. The authors also found that companies' DM and leverage follow an inverted U-pattern along with LCSs. The authors concluded that private credit markets consider LCSs when setting loan prices and characteristics.
Zhang and Xu (2020) investigated the effect of LCSs on the DM of Chinese non-financial companies from 2009 to 2016. The authors found evidence that reinforced the idea that adjustments in the debt maturity structure occur dynamically, through transitions between LCSs. Specifically, Zhang and Xu (2020) identified that the introduction and turbulence stages negatively affected DM, while the growth stage brought a positive effect on long-term debt. However, the authors did not find significant effects of the maturity stage on the DM structure.
2.3. Development of the Hypothesis
According to La Rocca et al. (2011) and Teixeira and Coutinho dos Santos (2014), changes in the level of information asymmetry, agency costs, ability to generate and retain cash flows, growth opportunities, bankruptcy risk, company size, and asset structure tend to influence financing decisions. Habib and Hasan (2019) highlighted that, as firms move along LCSs, they experience fundamental changes in internal and external key factors influencing investment, financing, and dividend decisions. Thus, it is expected that changes in the firm's access to external financing sources and its borrowing capacity resulting from life cycle variations will be reflected in significant changes in the company's capital structure and financing costs (Habib & Hasan, 2019).
According to Lobo et al. (2018), companies in the introduction and decline stages are more exposed to agency problems related to the uncertainties of their operations, therefore, the risk of failure is greater for companies in these groups. It is understood that the lender may attempt to control its risk by granting loans with shorter maturity to these companies. On the other hand, companies in the growth and maturity stages have less asymmetric information, agency problems, higher tangible assets relative to future investment opportunities, and a lower risk of failure, implying that lenders may be willing to provide longer-term loans to these companies (Lobo et al., 2018).
It is also known that profitability, the opportunity for growth, the tangibility of assets, the tax burden, the risk of the firm, size and age are known as determinants of the capital structure and maturity of debt (Fan et al., 2012). According to Dickinson (2011), these variables behave non-monotonically along the LCSs. In this bias, La Rocca et al. (2011) emphasized that agency costs and the level of informational asymmetry are different throughout the LCSs, so managers have specific incentives at each stage of the company to determine the adjustment of the capital structure and maturity of debt (Lobo et al., 2018).
Thus, in view of the previous evidence, we sought to evaluate the following hypothesis (H1):
-
H1: LCSs are significantly associated with the DM of Brazilian firms listed on B3.
Faff et al. (2016) argue that LCSs influence debt maturity in different ways: while companies in the stages of introduction, decline and turbulence tend to have less access to resources, due to uncertainties associated with the earning potential and the ability to pay these companies, those in stages of growth and maturity tend to have greater profitability, payment capacity and therefore greater access to long-term resources. In this context, Zhang and Xu (2020) adds that, as companies in the stages of introduction, turbulence and decline have reasonable uncertainty as to their ability to generate profit, cash, pay dividends and/or bonds, they have higher bankruptcy costs. Therefore, companies at this stage will have lower debt maturity when compared to those classified in growth and maturity LCSs, which have higher profitability, greater compensation capacity of shareholders and capital providers. As a result, they will also have greater access to long-term sources of funding.
3. METHODOLOGICAL PROCEDURES
3.1. Sampling, data collection and data analysis techniques
The sample consisted of 370 non-financial Brazilian companies listed on B3 in the period 2010-2019. Financial data, on a quarterly basis, were obtained from COMDINHEIRO and macroeconomic data from the portal of the Brazilian Institute of Geography and Statistics (IBGE). This period was selected from the mandatory disclosure of the statement of cash flows (SCF) to identify the LCSs according to Dickinson (2011), and to avoid biases due to differences in accounting practices (before 2010 with the partial adoption of international accounting standards). The data were analyzed by descriptive statistics, tests of differences between means, and regression analysis with panel data using the STATA 16® software. The procedures for evaluating econometric assumptions were performed according to Wooldridge (2010).
3.2. Models and Variables
To perform the empirical analysis of the hypothesis (H1) the following models proposed from Kayo and Kimura (2011), Stephan et al. (2011), Kirch and Terra (2012), Fan et al. (2012) and, Orman and Köksal (2017) were used:
3.2.1. Dependent variables
The Corporate Finance literature suggests, as a proxy for debt maturity, the proportion of loans and long-term financing in relation to total debt (Fan et al., 2012; Stephan et al., 2011; Kirch & Earth, 2012; Orman & Köksal, 2017). However, this debt maturity proxy presents some fragility due to the difficulty of reflecting the distance between debt maturities, since its metric groups a proportion of the amount of long-term debt in relation to all bonds and considering that it omits information on the weighted average of the maturity of the different sources of financing of the company. In addition, we observed that debt maturity is assumed when the average term of debt may be higher, or shorter, regardless of the level of indebtedness.
In this sense, aiming at an approximation of the maturity structure of the debt of the companies and greater consistency of the results, a metric that represents the average term of payment of loans and financing was used. This proxy is an adaptation of the average payment and receipt terms that originate from the Financial Statement Analysis literature (Penman, 2013). The advantage of this metric is that it considers the movements of debt fundings and payments and not just the proportional balance of long-term debt used in the traditional proxy referenced in the literature. The variables operationalization used in the models is presented in Appendix A.
3.2.2. Independent Variables
3.2.2.1. Proxy for the firm's life cycle (variable of interest)
In order to identify the different LCSs, the present study followed the approach taken by of Dickinson (2011). Some previous studies used this approach to relate the firm's life cycle to the capital structure (Castro et al. 2016; Tian et al., 2015; Faff et al., 2016; Lobo et al., 2018). According to Habib and Hasan (2019), Dickinson's model (2011) assumes that the transition of companies between the LCSs is not linear. In this way, the LCSs gain a dynamic aspect, referred to as an “organic” approach, oriented to assume the possible transitions between the different stages no matter which one it is in. Habib and Hasan, (2019) highlight the model's considerable prestige since it has a greater ability to forecast future profitability and growth rates, capture economic events and better specification of financial variables during the different stages.
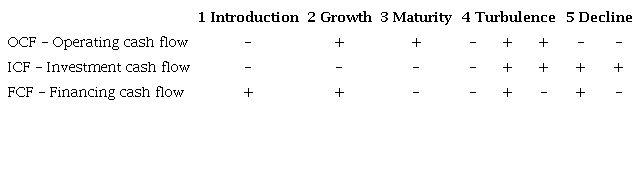
Based on the classification of the firm's life cycle in the stages of introduction, growth, maturity, turbulence and decline, Dickinson (2011) used accounting information extracted from cash flows (operation, investment, and financing). The combinations of cash flow signals are grouped into five LCSs as shown in Table 1.
3.2.2.2. Determinants of Debt Maturity
Therefore, considering the literature, the following variables were considered: Profitability, Growth Opportunity, Asset Tangibility (Kayo & Kimura, 2011; Kirch & Terra, 2012 and Fan et al., 2012) , Size (Stephan et al., 2011; Fan et al., 2012; Orman & Köksal, 2017), Volatility in Results (Stephan et al., 2011; Kirch & Terra, 2012; Orman & Köksal, 2017) , the Tax Burden (Stephan et al., 2011; Fan et al., 2012; Orman & Köksal, 2017), Herfindhal-Hirschman-Index (Kayo & Kimura, 2011; Smith et al., 2015) , the Financial Cycle (Penman, 2013), Inflation Volatility (Kirch & Terra, 2012; Fan et al., 2012), Corporate Governance Level, the Economic Segment and the company age (Kirch & Terra, 2012) to control the influence of LCSs on DM. Operationalization and expected relationships for these variables were detailed in Appendix A.
4. DATA ANALYSIS AND RESULTS DISCUSSION
4.1. Descriptive statistics and tests of differences between means (t-test)
Initially, we analyzed the descriptive statistics of the quantitative variables of the econometric models (Table 2). In general terms, some variables presented high dispersion, such as: RENTit, MTBit, σRESit, TAXBit. Previous studies that analyzed quarterly accounting data have reported greater dispersion in the data, although they allow better estimates, in several contexts (Pimentel & Aguiar, 2012). We found that the DM (DEBTMATit =) was 56%, which shows that more than half of the loans and financing obtained by the companies in the sample are long-term, which is aligned with the studies by Fan et al. (2012) and Kirch and Terra (2012), and higher in relation to the studies by Stephan et al. (2011) and Orman and Koksal (2017). This difference arises, in the perspective of Kirch and Terra (2012), from structural factors such as the level of credit market development, and availability of long-term resources, among others. When analyzing the DM (ADRTit =) alternative proxy, an average turnover of 6.9 was observed, indicating that the average debt payment term of the sample companies is renewed almost 7 times a year. The logic is based on the understanding that the greater the debt turnover within the year, accordingly, the greater the adjustment of the debt maturity structure.
The analysis of the observation proportions by LCSs shows that 40% of the observations are in the maturity stage, 26.8% in the growth stage and the rest of them are divided between the introduction, turbulence and decline LCSs. Although structural differences were observed between the capital markets of each country, especially between emerging and developed markets, this sample distribution was also found in all international studies (Dickinson, 2011; Castro et al., 2016; Tian et al., 2015; Faff et al., 2016; Lobo et al., 2018; Zhang & Xu, 2020). This means that most of the Brazilian companies selected in the period were in stages with lower uncertainties and better conditions for debt rollover, which may reflect on debt costs and accessibility to indebtedness (Hasan et al., 2015; Habib & Hasan, 2017; Ylhaimen, 2017).
Subsequently, we carried out Difference Between Means Tests (T-test) for the dependent and independent variables between the LCSs (Table 2). In general terms, the comparison of the interest variables DEBTMATit and ADRTit between the LCSs demonstrates the existence of statistically significant differences in the means between the different stages. These results reinforce the findings of research such as La Rocca et al. (2011), Tian et al. (2015), Teixeira and Coutinho dos Santos (2014), Rehman et al. (2016) and Castro et al. (2016). In this sense, tests of differences between means of LCSs-dependent variables provide primary pieces of evidence that DM is different in each LCSs, reinforcing the research hypothesis. For Dickinson (2011), the firm's Life Cycle establishes conditions on the moment in which companies signal that there have been significant changes in accounting information. La Rocca et al. (2011) explained that the dynamics of LCSs show differences in the level of informational asymmetry, reputation, and agency costs of companies at a given stage. With that in mind, Teixeira and Coutinho dos Santos (2014) state that, in the transitions between the ECVs, companies experienced different incentives that resulted in strategic or situational adjustments to their financing choices.
Similarly, statistically significant differences were observed in the means of the control variables in each LCSs, this result converges with those observed by La Rocca et al. (2011), Dickinson (2011), Tian et al. (2015), Rehman et al. (2016), Castro et al. (2016), Habib and Hasan (2019) and reinforce that the control variables change as companies move along the LCSs.
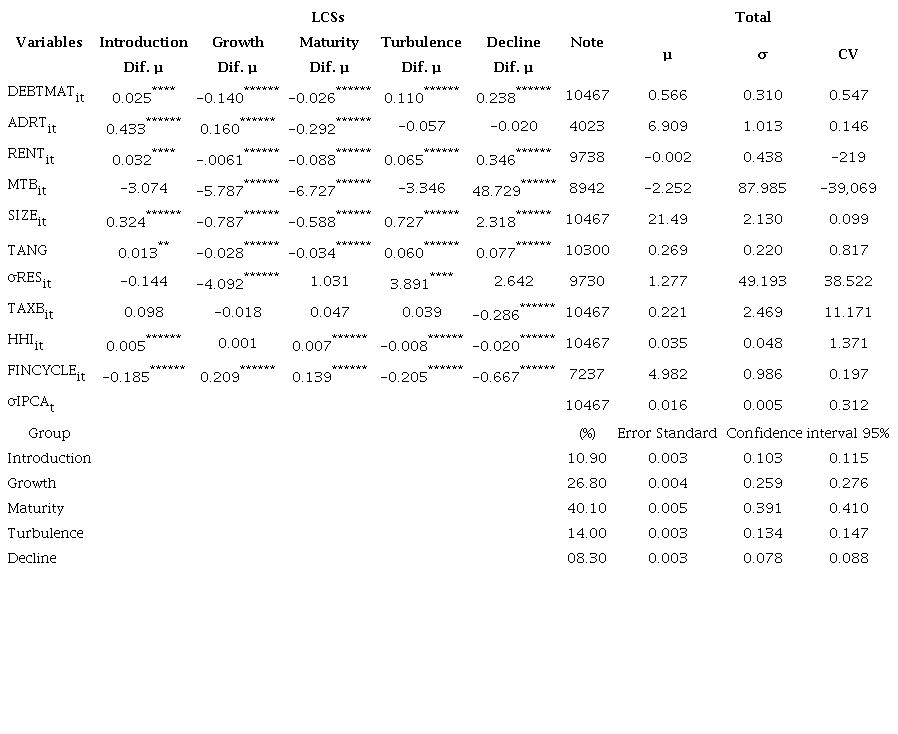
Note: All variables were winsorized in the range between 1% and 99%. ****** p<0.01, **** p<0.05, ** p<0.1, that is, statistically significant at the levels of 1%, 5% and 10%, respectively. The T-test was used to verify significant differences between the means of the groups; µ-mean; σ-standard deviation; CV - Coefficient of variation; Obs. - Number of observations; DEBTMATit - Debt Maturity; ADRTit - Average repayment term for loans and financing; RENTit - Profitability; MTBit - Market-to-book; SIZEit - Size; TANGit - Tangibility of assets; σRESit - Volatility of the result; TAXBit - Tax burden; HHIit - Herfindhal-Hirchsman Index; FINCYCLEit - Financial Cycle; σIPCAt - Inflation volatility as measured by the IPCA. Source: Survey data.
4.2. Association between LCSs and DM
To evaluate the research hypothesis (H1), the econometric models described in section 3.2 were used with the results reported in Table 3. We observed that, for the two econometric models, the Wald Test (x²) was statistically significant at a level of 1%, indicating that the models estimated by generalized least squares (GLS) were well specified and validated.
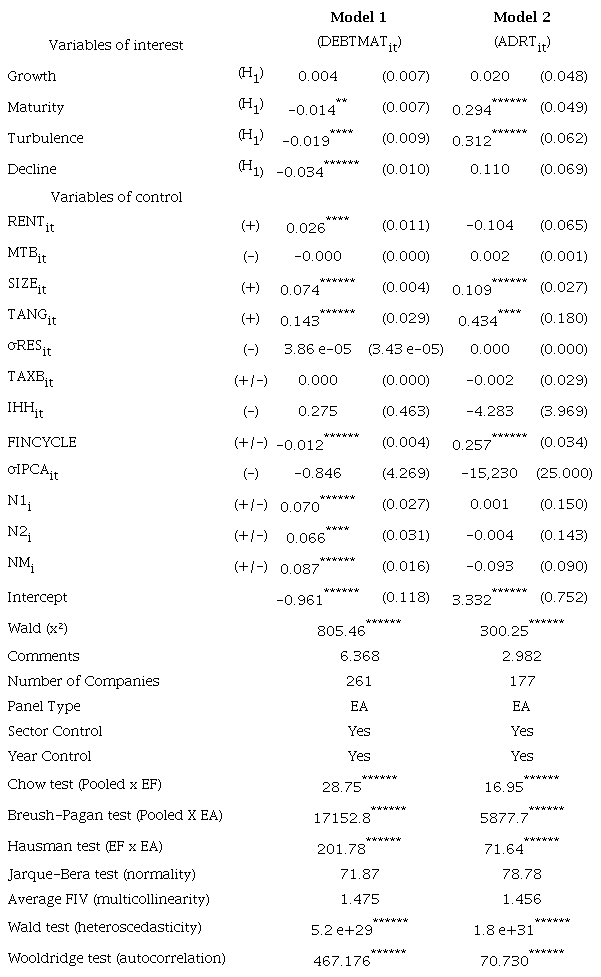
Note:****** p<0.01, **** p<0.05, ** p<0.1, that is, statistically significant at the levels of 1%, 5% and 10%, respectively. Standard errors in parentheses. Winsorized data between 5% and 95%. The Generalized Least Squares (GLS) with adjustments for heteroscedasticity and conformal autocorrelation (Wooldridge, 2010). Source: Survey data.
We verified in Model 1 that companies in the stages of maturity, turbulence, and decline tend to have a negative association with DM (DEBTMATit) 0.014, 0.019 and 0.034 lower than those in the Introduction stage. Faff et al. (2016) used the maturity stage as a benchmark for comparison and found a positive association between the introduction and growth stages and the DM, however, they also found a negative association with the turbulence stage. In this context, Lobo et al. (2018) used the turbulence stage as a basis for their analysis and observed a positive association between the growth and maturity stage and DM and found a negative association with the decline stage. Zhang and Xu (2020) used the maturity stage as a reference for analysis and, thus, observed a negative association between the introduction stage, the turbulence stage, and the DM, but a positive association with the growth stage.
Although the model of the present study presents an inverse relationship in the transition to the maturity stage, it is noteworthy that in the studies of Faff et al. (2016) and Zhang and Xu (2020) positively significant economic effects were observed in the transition from the maturity to the growth stage. In the present study, the evolution of LCSs from the introduction stage was analyzed, so the finding of a reduction in the DM structure in the transition from the growth to the maturity stage is consistent with previous evidence. Therefore, the results of Model 1 reinforce the analyzed hypothesis (HI) of the existence of a significant association between LCSs and DM and converge with the studies of Faff et al. (2016), Lobo et al. (2018) and Zhang and Xu (2020).
When observing the negative sign of the relationship of coefficients between the maturity stages, turbulence and decline on the DM it is shown successive reductions in the DM structure, as the firm moves towards decline. Thus, by controlling the other DM deterministic factors, it is understood that the increase in uncertainties about business continuity and the decrease in the debt settlement capacity of companies in the turbulence and decline stages make firms face greater challenges in accessing long-term resources. From the perspective of Lobo et al. (2018), creditors become more cautious with these companies in these LCSs, increasing the monitoring of contracts and reducing the maturity structure of this debt.
Additionally, we could observe in the Model 2 that the variable (ADRTit) (average debt repayment term) increases by 0.294 and 0.312, respectively, for companies classified in LCSs for the maturity and turbulence stages (at a level of 1% significance). However, a signal change was observed in the relationship between LCSs and DM. Therefore, we found that the maturity and Turbulence is associated with increased MD.
Regarding the Maturity’s LCS, this result was expected and is associated with the perception of lower risk and greater ability to return and remuneration to capital providers. However, the Turbulence’s LCS refers to a stage in which the company presents heterogeneous cash flow behaviors, and, different from that observed in other LCSs, this fact is considered a higher risk signaling when compared to the data of companies classified in the Maturity’s LCS, for example; soon, a negative relationship was expected. However, it is noteworthy that these coefficients capture the association of each LCS compared to that used as a reference, which is, in the present study, the Introduction’s LCS. Therefore, companies classified in maturity and Turbulence’s LCSs tend to have average payment terms higher than those classified in the Introduction’s LCS.
According to Faff et al. (2016), Zhang and Xu (2020), these results are explained by the firm's ability to generate sufficient resources to remunerate the various sources of financing (shareholders, creditors, etc.), and thus capital providers will be more likely to grant funds to those companies that are in the Growth and Maturity stages (as they tend to be more profitable and at lower risk of bankruptcy), which would result in higher DM for these companies. In turn, companies classified in the Introduction, Turbulence and Decline’s LCSs tend to have higher costs and risk of bankruptcy, so providers would be willing to lend them resources with higher costs and shorter maturities, reducing DM.
When analyzing the Model 1’s control variables, we observed that profitability (RENTit), size (SIZEit), tangibility (TANGit), financial cycle (FINCICLEit), corporate governance level (N1I), level 2 of corporate governance (N2I) and the new market (NMI) were statistically significant for explaining the variation in DM. Variable (RENTit) showed a positive and a significant correlation with debt maturity, corroborating the result obtained by Fan et al. (2012). According to these authors, more profitable companies have longer debt maturity structures, as companies would seek to increase tax protections from indebtedness by taking long-term debt. Thus, a positive relationship between profitability and debt maturity structure is expected.
The (SIZEit) variable presented a positive and significant correlation with DM, which converges with the papers from Stephan et al. (2011), Fan et al. (2012), Kirch and Terra (2012), Teixeira and Coutinho dos Santos (2014), Rehman et al. (2016), Orman and Köksal (2017) and Zhang and Xu (2020). According to Stephan et al. (2011), agency conflicts between creditors and shareholders faced by smaller companies are likely to be greater in variety and severity than in large companies. For the authors, reducing DM for smaller companies could help mitigate these agency problems, since they would be more exposed to contracts to renew their debts. On the other hand, larger companies would not need this exposure and thus, their debt rollovers can be extended over longer terms. Furthermore, Stephan et al. (2011) explain that large companies are more transparent in terms of information than medium and small companies as well as are less prone to bankruptcy costs, thus improving creditors' confidence in granting credit at lower costs.
The (TANGit) variable showed a positive and significant correlation with DM. This result reinforces the findings of Fan et al. (2012); Kirch and Terra (2012) and Orman and Köksal (2017). As explained by Fan et al. (2012), the greater proportion of tangible assets acts as a “guarantee” that facilitates access to external financing, mitigating the agency problems associated with debt contracting. Therefore, it is reasonable to expect that a greater proportion of tangible assets will support greater long-term financing.
The analysis of the association between the firm's financial cycle (FINCYCLEit) and the DM measured by (DEBTMATit) and the (ADRTit) has presented a negative association for the former and a positive association for the latter. Regarding (DEBTMATit), it so happens that longer financial cycles require a greater need for financing. However, a significant part of this refers to financing with suppliers, employees, and other short-term obligations. This would cause the level of debt to increase, and most of it would be made up of short-term debt, so the ratio of long-term loans and financing to total loans would tend to decrease.
In turn, when using the metric (ADRTit) we found that the effect of (FINCICLEit) is positive, which suggests a longer average debt payment term for those companies that have longer financial cycles. These results converge with previous evidence observed in the finance literature (D'amato, 2020; Wang et al., 2014), however, they call into question the adequacy of the debt maturity metric normally used by the literature (Fan et al., 2012; Kirch & Terra, 2012) and Orman and Köksal (2017).
Analyzing the association between the Corporate Governance Level (N1I), (N2I) and (NMI) and DM, statistical significance is observed in all. Additionally, the positive coefficients of the relationship suggest that, as companies move to more structured levels of Corporate Governance, creditors have their risk perception reduced and, thus, the quality of these companies is reflected in better conditions on loan and financing agreements (Ashbaugh-Skaife et al., 2006).
Finally, the analysis of the associations between control variables of Model 2 shows that: (SIZEit), (TANGit) and (FINCICLEit) remained statistically significant in explaining DM and reinforced the evidence observed in Model 1. However, the variable (FINCICLEit) remained statistically significant, though, with a negative coefficient with the dependent variable (ADRTit) suggesting that companies with longer cycles tend to have longer debt repayment terms, which is consistent with the concept that companies with longer financial cycles need longer terms to finance their activities.
5. FINAL REMARKS
The aim of this study was to analyze the association between the firm's LCSs and the DM of Brazilian companies listed in B3. The descriptive, documentary work with a quantitative approach analyzed quarterly data from a sample of 370 non-financial companies listed in B3 from 2010 to 2019, using descriptive statistics, tests of differences between means, and regression with panel data.
The results confirmed the hypothesis that LCSs are significantly associated with DM. We observed that the means (medians) of DM present an inverted U-shaped behavior, consistent with the evidence from previous research conducted in foreign markets (Faff et al., 2016, Lobo et al., 2018; Zhang & Xu, 2020). In addition, there is a trend of marginal growth of MD in the introduction, growth and maturity stages with successive reductions in the turbulence and decline stages. Faff et al. (2016), Lobo et al. (2018) and Zhang and Xu (2020) also observed this behavior, which reinforces the theoretical expectation that financing policies are related to the characteristics of each LCSs on financial constraints that require specific strategies for raising and allocating resources. Econometric tests were consistent, including the alternative proxy proposed to capture DM from its average terms, reinforcing the evidence on the phenomenon of decisions about it and suggesting the use of alternative and more appropriate metrics to capture the DM structure.
The results contribute to the academic environment, and the studies of this field by presenting evidence that reinforces the importance of considering dynamic aspects of financial decisions as well as by filling a quite unexplored gap in the corporate finance literature. Additionally, this study suggests the use of an alternative proxy with a better capacity to capture the DM and highlights the importance of considering the financial cycle variable as representative for the phenomenon of financing decisions.
For managers, board members, credit committees, and capital providers in general, the present study provides empirical evidence that supports the importance of considering LCSs in credit analysis, since the proxy can contribute to the risk management and resource allocation process. Furthermore, the evidence on the effect of LCSs presented can help analysts and investors in the decision-making process on the allocation of financial resources (credit, investments, etc.).
Despite the contributions, the study presents scope limitations, as it analyzed data from a non-probabilistic sample, focused on the association between the variables (LCSs and DM), and did not consider other possibilities such as credit availability, environmental dynamism, political connections, among other aspects that could impact DM. In this sense, it is suggested to consider other control possibilities, such as capital cost, bank spread, and availability of resources, among others that can be associated with the phenomena of capital structure and DM. Furthermore, it is suggested to use difference-in-difference method to assess the causality between LCSs and DM.
REFERENCES
Ashbaugh-Skaife, H., Collins, D. W., & LaFond, R. (2006). The effects of corporate governance on firms’ credit ratings. Journal of Accounting and Economics, 42(1-2), 203-243. https://doi.org/10.1016/j.jacceco.2006.02.003
Barnea, A., Haugen, R. A., & Senbet, L. W. (1980). A rationale for debt maturity structure and call provisions in the agency theoretic framework. The Journal of Finance, 35(5), 1223-1234. https://doi.org/10.1111/j.1540-6261.1980.tb02205.x
Castro, P., Tascón Fernández, M. T., Amor-Tapia, B., & de Miguel, A. (2016). Target leverage and speed of adjustment along the life cycle of European listed firms. BRQ Business Research Quarterly, 19(3), 188-205. https://doi.org/10.1016/j.brq.2016.01.003
D’Amato, A. (2020). Capital structure, debt maturity, and financial crisis: Empirical evidence from SMEs. Small Business Economics, 55(4), 919-941. https://doi.org/10.1007/s11187-019-00165-6
DeAngelo, H., DeAngelo, L., & Stulz, R. M. (2010). Seasoned equity offerings, market timing, and the corporate lifecycle. Journal of Financial Economics, 95(3), 275-295. https://doi.org/10.1016/j.jfineco.2009.11.002
Diamond, D. W. (1991). Debt maturity structure and liquidity risk. The Quarterly Journal of Economics, 106(3), 709-737. https://doi.org/10.2307/2937924
Dickinson, V. (2011). Cash flow patterns as a proxy for firm life cycle. The Accounting Review, 86(6), 1969-1994. https://doi.org/10.2308/accr-10130
Faff, R., Kwok, W. C., Podolski, E. J., & Wong, G. (2016). Do corporate policies follow a life-cycle? Journal of Banking & Finance, 69, 95-107. https://doi.org/10.1016/j.jbankfin.2016.04.009
Fan, J. P. H., Titman, S., & Twite, G. (2012). An international comparison of capital structure and debt maturity choices. Journal of Financial and Quantitative Analysis, 47(1), 23-56. https://doi.org/10.1017/S0022109011000597
Flannery, M. J. (1986). Asymmetric information and risky debt maturity choice. The Journal of Finance, 41(1), 19-37. https://doi.org/10.1111/j.1540-6261.1986.tb04489.x
Geelen, T. (2019). Information Dynamics and Debt Maturity, Swiss Finance Institute Research. SSRN. https://doi.org/10.2139/ssrn.2894425
Habib, A., & Hasan, M. M. (2019). Corporate life cycle research in accounting, finance and corporate governance: A survey, and directions for future research. International Review of Financial Analysis, 61, 188-201. https://doi.org/10.1016/j.irfa.2018.12.004
Hasan, M. M., Hossain, M., Cheung, A., Wai-K., & Habib, A. (2015). Corporate life cycle and cost of equity capital. Journal of Contemporary Accounting & Economics, 11(1), 46-60. https://doi.org/10.1016/j.jcae.2014.12.002
Kane, A., Marcus, A. J., & McDonald, R. L. (1985). Debt policy and the rate of return premium to leverage. The Journal of Financial and Quantitative Analysis, 20(4), 479. https://doi.org/10.2307/2330763
Kayo, E. K., & Kimura, H. (2011). Hierarchical determinants of capital structure. Journal of Banking & Finance, 35(2), 358-371. https://doi.org/10.1016/j.jbankfin.2010.08.015
Kirch, G., & Terra, P. R. S. (2012). Determinants of corporate debt maturity in South America: Do institutional quality and financial development matter? Journal of Corporate Finance, 18(4), 980-993. https://doi.org/10.1016/j.jcorpfin.2012.05.004
La Rocca, M., La Rocca, T., & Cariola, A. (2011). Capital structure decisions during a firm’s life cycle. Small Business Economics, 37(1), 107-130. https://doi.org/10.1007/s11187-009-9229-z
Lobo, G. J., Hasan, M. M., Amin, A., & Tresl, J. (2018). Firm life cycle and loan contract terms. Firm life cycle and loan contract terms, 44. https://acfr.aut.ac.nz/__data/assets/pdf_file/0019/190612/LC-and-Loan.pdf
Modigliani, F., & Miller, M. H. (1958). The cost of capital, corporation finance and the theory of investment. The American Economic Review, 48(3), 261-297. https://gvpesquisa.fgv.br/sites/gvpesquisa.fgv.br/files/arquivos/terra_-_the_cost_of_capital_corporation_finance.pdf
Modigliani, F., & Miller, M. H. (1963). Corporate income taxes and the cost of capital: A correction. The American Economic Review, 53(3), 433-443. http://www.jstor.org/stable/1809167
Orman, C., & Köksal, B. (2017). Debt maturity across firm types: Evidence from a major developing economy. Emerging Markets Review, 30, 169-199. https://doi.org/10.1016/j.ememar.2016.12.001
Penman, S. (2013). Análise das demonstrações financeiras e security valuation. Elsevier.
Pimentel, R., & Aguiar, A. (2012). Persistence of quarterly earnings: An empirical investigation in Brazil. Brazilian Business Review, 9(ed. spe.), 38-54. https://doi.org/10.15728/bbrconf.2012.2
Rehman, A., Wang, M., & Yu, H. (2016). Dynamics of financial leverage across firm life cycle in Chinese firms: An empirical investigation using dynamic panel data model. China Finance and Economic Review, 4(1), 19. https://doi.org/10.1186/s40589-016-0041-z
Smith, D. J., Chen, J., & Anderson, H. D. (2015). The influence of firm financial position and industry characteristics on capital structure adjustment. Accounting & Finance, 55(4), 1135-1169. https://doi.org/10.1111/acfi.12083
Stephan, A., Talavera, O., & Tsapin, A. (2011). Corporate debt maturity choice in emerging financial markets. The Quarterly Review of Economics and Finance, 51(2), 141-151. https://doi.org/10.1016/j.qref.2010.12.003
Teixeira, G., & Coutinho dos Santos, M. J. (2014). Do firms have financing preferences along their life cycle? Evidence from Iberia. SSRN. https://doi.org/10.2139/ssrn.676869
Tian, L., Han, L., & Zhang, S. (2015). Business life cycle and capital structure: Evidence from Chinese manufacturing firms. China & World Economy, 23(2). https://doi.org/10.1111/cwe.2015.23.issue-2
Wang, Y., Ji, Y., Chen, X., & Song, C. (2014). Inflation, operating cycle, and cash holdings. China Journal of Accounting Research, 7(4), 263-276. https://doi.org/10.1016/j.cjar.2013.07.001
Wooldridge, J. M. (2010). Econometric analysis of cross section and panel data. MIT Press.
Zhang, X., & Xu, L. (2020). Firm life cycle and debt maturity structure: Evidence from China. Accounting & Finance, 61, 937-976. https://doi.org/10.1111/acfi.12600
Appendix A
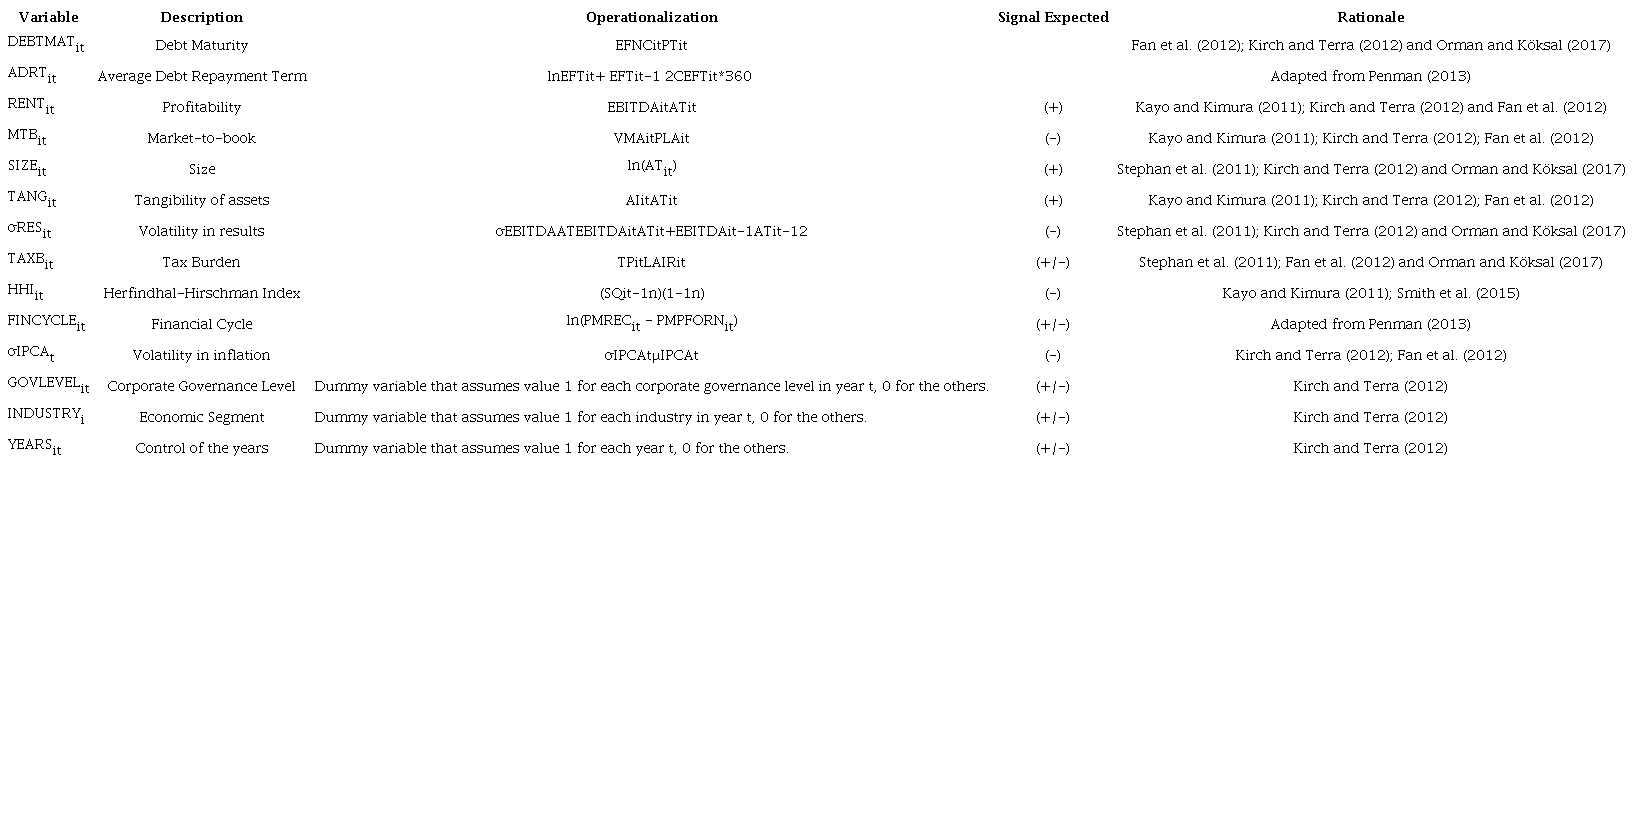
Note: PT - Total liabilities; AT - Total assets; EFNC - Non-current loans and financing; EFT - Total Loans and Financing; CEFT - Funding of new loans and total financing. Variable ADRTit is an adaptation of the average terms of payments and receipts that originate from the literature on the Analysis of Financial Statements; EBITDAit - Earnings before interest, taxes, depreciation and amortization; VMAit - Stock market value; PLAit - Equity value of shares; ATit - Total assets; AIit - Fixed assets; TPit - Tributes paid; LAIRit - Profit before income tax; SQit - Sum of squares of each company's market share measured by net revenue; nit - Number of companies; PMRECit - Average sales receipt time; PMPFORNit - Average Payment term to Supplier; CLit - Client; RLit - Net income; FOit - Supplier; CPit - Purchases; PMRECit - Average term of receipt; PMFORMit - Average payment term suppliers; IPCAit - Broad consumer price index. Source: Prepared by the author.
Notes
Author notes
leonardobregonci@hotmail.comvagner.marques@ufes.brbruno.magri01@gmail.comhfamaral@face.ufmg.br
Conflict of interest declaration