Articles
Liquid brands time: a study on the value of top global brands

Liquid brands time: a study on the value of top global brands
Gestão & Regionalidade, vol. 37, núm. 110, pp. 254-269, 2021
Universidade Municipal de São Caetano do Sul

Esta obra está bajo una Licencia Creative Commons Atribución 4.0 Internacional.
Recepción: 15 Octubre 2019
Aprobación: 18 Febrero 2020
Abstract: We live liquid times in which the constructions of century XX give place to new economic concepts. Intangible assets show growth in the composition of corporate value and the brand is an important component representing a link between companies and customers. A research was carried out with the objective of analyzing the behavior of the most valuable brands worldwide (2001 to 2018) and to identify if the concepts of "liquidification" proposed by Bauman can be used to brands. The Interbrand ranking confirmed that there were fluctuations in the position, brand monetary value besides the appearance of new brands. 25.15% of the brands were in every year, 51% of the brands present in 2001 were also in 2018, but none of the 171 brands that made up the different annual rankings sustained their positions in the period. Results lead to the discussion that we live times of liquid brands.
Keywords: Brand value, Value of Companies, Intangible assets.
Resumo: Vivemos tempos líquidos em que as construções do século XX dão lugar a novos conceitos econômicos. Os ativos intangíveis apresentam crescimento na composição do valor das empresas e a marca constitui-se em importante componente desses ativos, representando um elo entre empresas e clientes. Realizou-se pesquisa com o objetivo de analisar o comportamento das marcas mais valiosas do mundo de 2001 a 2018 e identificar se os conceitos de “liquidificação” propostos por Bauman podem ser empregados à marca. Utilizou-se o Ranking de valor das marcas da Interbrand e constatou-se que houve flutuações na posição, valor monetário das marcas além do surgimento de novas marcas. 25.15% das marcas estiveram em todos os anos, 51% das marcas presentes em 2001 estavam também em 2018, mas nenhuma das 171 marcas que constituíram os diferentes rankings anuais sustentaram suas posições no período. Resultados conduzem à discussão de que vivemos tempos de marcas líquidas.
Palavras-chave: Valor da marca, Valor das Empresas, Ativos intangíveis.
1 INTRODUCTION
Unlike solids, liquids do not have clearly defined spatial dimensions, and the property of changing shape at any time means that, when describing a liquid, time must be considered. The description of a liquid is “instant photo, which needs to be dated”, and in a similar way, it can be said that we live in liquid times, given that our society undergoes a series of structural changes, fast and profound. The era of solid certainties in long-term planning supported by rationality in decision-making is losing more and more space to the era of uncertainty, which demands more flexible planning and organizations. In this context, the information is global and updated at a pace never experienced, occurring a process of increasing individualization that is associated with the idea of the uncertainty of individual choices, which in turn are connected to collective projects and actions. In this sense, the rules of social significance are no longer easily identified and perennial, but rather, liquid and intangible, making people anchor in themselves and the present moment as a reference point for their decisions (BAUMAN, 2000; BAUMAN, 2007).
Fluids travel easily. They 'flow', 'spill', 'run out', 'splash', 'pour over', 'leak', 'flood', 'spray', 'drip', 'seep', 'ooze'; unlike solids, they are not easily stopped - they pass around some obstacles, dissolve some others and bore or soak their way through others still. From the meeting with solids they emerge unscathed, while the solids they have met, if they stay solid, are changed - get moist or drenched. The extraordinary mobility of fluids is what associates them with the idea of 'lightness' There are liquids which, cubic inch for cubic inch, are heavier than many solids (BAUMAN, 2000, p.8).
Bauman also uses his creative metaphor of "liquidation process" to exemplify processes of change in economic issues, corporate strategies, and consumer relations. The conquest of spaces in liquid times involves breaking the barriers imposed by the previous solid structure, enabling economic development in the sense of offering more alternatives of choice, but which generates a separation between the elite with enormous consumption capacity and a mass alien to the consumption. Bauman reinforces his argument by citing Jacques Attali, in La voie humaine, showing that the 49 poorest countries in the world with 11% of the world population have almost the same income as the three richest men in the world (BAUMAN, 2007), which according to Forbes Media LLC (2019) holds equity of $ 311 billion. In the context of corporate strategies, Bauman (2000) exemplifies his concepts by arguing that Fordism was a model of accumulation and regulation industrialization: a combination of ways of adjusting people's expectations and contradictory behavior to the collective principles of the accumulation regime. This industrial paradigm included the Taylorist principle of rationalization added to a constant mechanization. The rationalization was based on the separation of the intellectual and manual aspects of work. When Taylor introduced these principles in the early 20th century, his goal was to create management control over workers. However, the Fordist model was more than that, it became an epistemological place of contraction on which a whole worldview was raised and from which it majestically superimposed itself on the totality of the lived experience.
The Fordist factory - with its meticulous separation between design and execution, initiative and command-following, freedom and obedience, invention and determination, with its tight interlocking of the opposites within each of such binary oppositions and the smooth transmission of command from the first element of each pair to the second - was without doubt the highest achievement to date of order-aimed social engineering (BAUMAN, 2000, p. 68).
At that time, there seemed to be no alternative to the Fordist factory, nor any obstacle to prevent the expansion of this model to the most recessed recesses and fissures of society. According to Bauman (2000, p. 69), “Fordism was the self-awareness of modern society in its “heavy”, “bulky” or “immobile”, “rooted” and “solid” phase.
According to Bauman (2010), capital, administration and work were condemned to remain together for a long time, tied by the combination of huge factory, heavy machinery, and volume workforce. Survival at that time was only possible if companies became "heavy", creating boundaries and making them firm and impenetrable. In its heaviest phase, capital was as fixed to the ground as workers.
However, Henry Ford had been experiencing a strong workforce turnover. To reduce it, avoiding the departure of his employees, Ford doubled wages in an attempt to keep the invisible chain that held workers in place, preventing their mobility. This chain, in the Ford system, was its main link to keep the system working properly, when this chain broke it was the beginning of the decay, towards the accelerated extinction of the Ford model. This part of the story, in the words of Bauman (2000), “could be called, in the absence of a better name, the era of hardware, or heavy modernity - modernity obsessed with volume, a modernity of the type “the bigger, the better”, "Size is power, volume is success".
That was the hardware era; the epoch of weighty and ever more cumbersome machines, of the ever longer factory walls enclosing ever 1 14 Time/Space wider factory floors and ingesting ever more populous factory crews, of ponderous rail engines and gigantic ocean liners. To conquer space was the supreme goal - to grasp as much of it as one could hold, and to hold to it, marking it all over with the tangible tokens of possession and 'No trespassing' boards. Territory was among the most acute of modern obsessions, its acquisition among the most compulsive of modern urges - while guarding the boundaries figured high among the most ubiquitous, resilient, and relentlessly growing modern addictions (BAUMAN, 2010, p.133).
Evans and Wurster (2000) proposed a consistent explanation for what Bauman (2000) called liquid society in the field of organizations. In the early 2000s, when there was still much doubt and fear about the effect of the internet on the environment and business models, they claimed that the traditional economy had a content of a physical nature and another of an informational nature that were inherently integrated, implying certain relatively restricted forms of organization from the point of view of the possibility of combining. The development of the internet has made it possible to separate the economy of informational content, or intangible assets, from the economy of objects, or tangible assets. This separation process has been accelerated by the advancement of technologies and there is a dispute over the domain of intangible assets, coated with greater value in an economy that demands flexibility and fluidity, and is reflected in what Bauman (2000) calls liquid society specifically in business field.
There is a process of liquefaction in various perspectives of the business environment. Regarding the value of brands, according to the Interbrand Ranking (2019), only 5 of 10 most valuable brands in the world in 2010 remained in this range in 2018. (JOHNSTON, 2019) illustrates that in the value of the companies there also has been great volatility, in the ten largest American companies by market value in 2008, only 5 remained in this range in 2018. The Harvard Business Review (2019) ranking of global Chief Executive officers (CEOs) best evaluated in terms of results shows that none of the top ten executives in 2008 continued in this assessment range in 2018.
Empirical evidence exemplifies “liquefaction” and “lightness”, the participation of intangibles in the market value of the companies that make up the S&P 500 index grows decade by decade. In 1975, 17% of the companies' value was formed by intangible assets, this percentage increased to 32% in 1985, 68% in 1995, 80% in 2005 and 84% in 2015 (ELSTEN; HILL, 2017). The value of brands in 2016 represented around 27% of the value of 75 companies in the Interbrand Ranking (2016) and about 33% of the value of intangibles. What reinforces the importance of the brand as a representative intangible in the value of companies (CRISPIM; DORNELLES, 2018).
In this context in which there is a liquidation of the institutions and relationships, there is a natural valuation of the intangible assets in the environment of organizations, given their greater flexibility, with emphasis on brands, which are the link with stakeholders. The following research problem is proposed: Are brands becoming more liquid in line with the liquidation process of society and organizations as identified by Bauman?
Given that for assets that have monetary value the liquidation process should reflect greater value volatility, this article aims to analyze the behavior of the most valuable brands in the world, according to the Interbrand Ranking, since the beginning of the 21st century and consider whether Bauman's philosophy is also applied to brands.
2 LITERATURE REVIEW
2.1 Business Value and Importance of Intangible Assets
The expectations of long-term investors are reflected in the corporate environment by the companies' market value. As economies migrate to predominantly informational and service activities, tangible assets, which were the main drivers of value, have given way to intangibles that have rapidly and significantly increased their influence on the valuation of companies (BOULTON; LIBERT; SAMEK, 2001; RAMASWAMI; SRIVASTAVA; BHARGAVA, 2008; MCDONALD; MOUNCEY, 2009; KOTHARI; MEHTA (RANKA) LATIKA, 2013). The company's value is a variable that depends functionally on the company's performance in the market, which in turn is greatly influenced by three pillars: (a) product innovation management; (b) customer relationship management; (c) supply chain management. The brand is an intangible asset particularly associated with customer relationships and, therefore, it is an important source of creating company value (SRIVASTAVA; SHERVANI; FAHEY, 1998; VODÁK, 2011).
Intangibles
The companies' market value or market capitalization represents the present value of the projected earnings streams for the future, which in turn reflects investor expectations. In the past, tangible assets were the biggest influencers of these investor expectations, but in recent decades, in parallel with the shift from a predominantly manufacturing economy to a service and information economy, the influence of intangible assets has significantly increased in creating value for companies, according to Ramaswami, Srivastava and Bhargava (2008).
Boulton, Libert and Samek (2001) identified that in the early 1980s, for more than 10,000 companies traded in the North American stock markets, about 5% of the market value was defined by intangible assets, and 95% by tangible assets captured by traditional accounting in the form of balance sheets. By the end of the 1990s, the share of intangible assets in the total amount had already increased from 5% to 72%. According to Mc Donald and Mouncey (2009) in 2006 the importance of intangibles in the value of companies already reached 80% in the United States and United Kingdom. Elsten and Hill (2017) developed a periodic study called IAMV - Intangible Asset Market Value that identified an increase in the share of intangible assets in the value of S&P component companies in 17%, in 1975, to 84%, in 2015, and expanded the estimated share of intangibles in total value for companies in Europe and the East in 2015: S&P Europe 350 for 16 countries in Europe (71%), Kosdaq Index for Asia (54%), Shanghai Shenxehn CSI 300 for China (35%) and Nikkei 225 from Japan (31%). Figure 1 illustrates the evolution of the participation of intangibles in the total value for S&P 500 from 1975 to 2015 and the importance in 2015 in the regions mentioned above. The Brand Finance Institute (2017) estimated that intangible assets represented 52% of the value of global companies in 2016. Finally, in all perspectives it is clear the great importance of intangible assets, which already represents more than half the value of global companies, and the continuous growth of this importance according to Sinclair and Keller (2017).
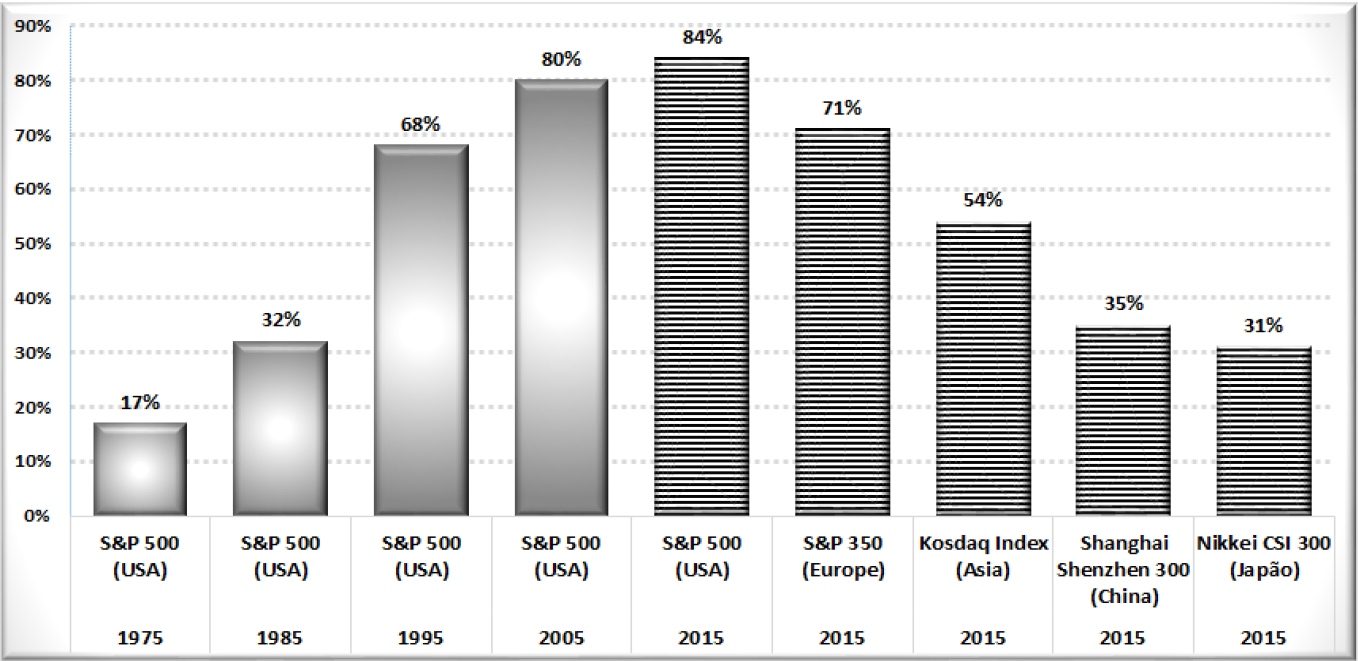
Figure 1
Share of Intangible Assets in Companies' Market Value: Evolution of S&P and Situation of the Main Global Markets in 2015
Adapted from "Intangible Asset Market Value Study?”, C. Elsten & N. Hill, 2017. Journal of the Licensing Executives Society
The importance of intangible assets is directly associated with the transformation of the nature of the economy from predominantly physical to informational and knowledge-based, making the capacity for change and flexibility of companies fundamental competitive attributes, and according to Kothari and Mehta (Ranka) Latika (2013) the valuation of intangible assets has been the subject of research since the mid-1960s, ever since its concept evolved into so-called intellectual capital. The value of intangible assets, or intellectual capital, reflects their ability to influence cash flow and market capitalization, or appreciation, for companies. In this sense, according to Vodák (2011), intellectual capital can be observed only if there is a connection with tangible assets through the added value based on the greater competitiveness of the products and the company.
According to Edvinsson (1997) Skandia - a Swedish service company that pioneered experiments with intellectual capital and gave rise to many studies on the subject - defined intellectual capital as the ownership of knowledge, applied experience, organizational technology, relationships with suppliers and professional skills that can increase your market value and provide competitive advantage. The components of intellectual capital, including market-based assets, and their relationship to the value of companies are illustrated in figure 2.
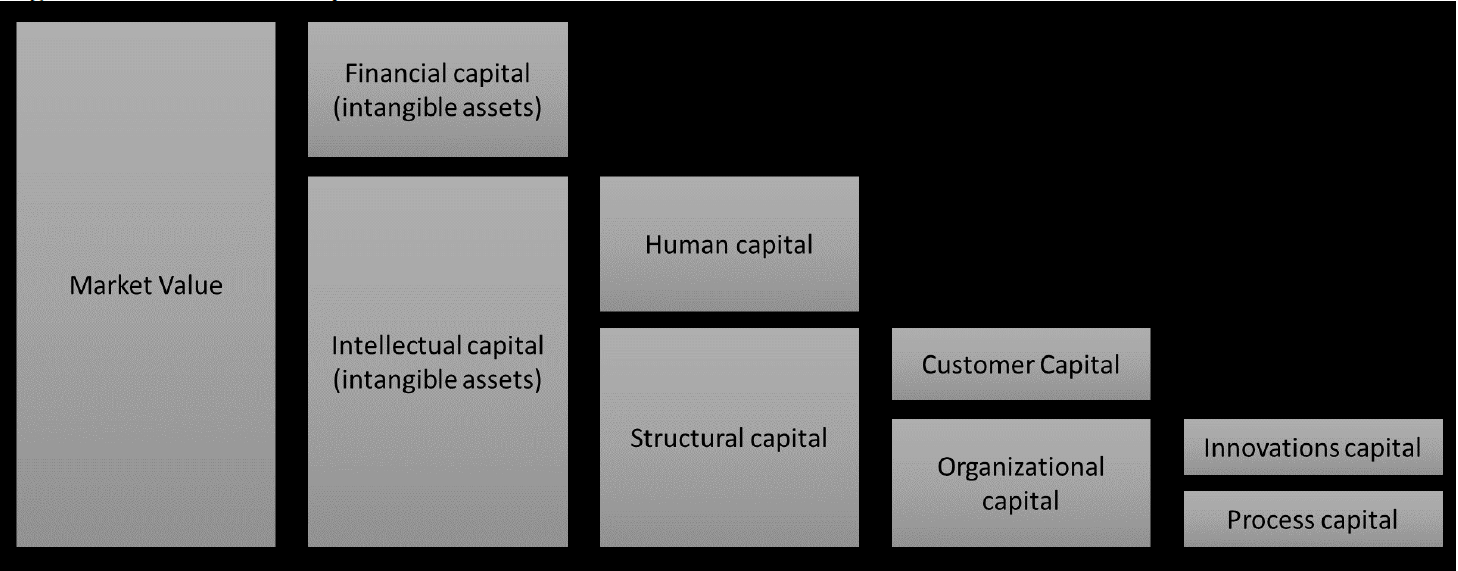
Figure 2
Intellectual Capital and Business Creation and Value Process
Adapted from “Developing Intellectual Capital at Skandia”, L. Edvinsson, 1997. Long Range Planning
2.2 Brand Value
Aaker (1998) defines brand as:
a distinguishing name and/or symbol (such as logo, trademark, or package design) intended to identify the goods or services of either one seller or a group of sellers, and to differentiate those goods or services from those of competitors. A brand thus signals to the customer the source of the product and protects both the customer and the producer from competitors who would attempt to provide products that appear to be identical (AAKER, 1998, p. 7)
Although it may seem simple, evaluating a company is a task that requires a lot of technique, art, and knowledge. In large part, the difficulty of finding a value is related to the uncertainty about the future. This uncertainty reflects exogenous variables, such as the dynamic political and economic scenarios over which companies have no control and are increasingly complex forecasts.
Another difficulty associated with the evaluation process is to attribute value to intangible assets - assets that have no physical form (Damodaran, 2017), but that are part of a company's value. According to Kayo et al. (2006), intangibles are basically divided into human assets, innovation assets, structural assets, and relationship assets. Some examples are patents, knowledge, brands, market channels.
The determination of the brand value has several methodologies elaborated with different approaches by specialized consultants. Mizik and Jacobson (2009) highlight BrandZ, which was developed by marketing consultants Millward Brown and WPP and is based on the factors: presence, relevance; performance, advantage, and bond. Another recognized methodology is Brand Finance, which focuses on seven factors: (a) Calculating the strength of the brand; (b) Determine the royalty rate; (c) Calculate the royalty rate according to the strength of the brand; (d) Determine brand-specific revenues; (e) Determine the expected revenue for the brand under study; (f) Apply the royalty rate to expected revenues; (g) Calculation of the brand value.
Also noteworthy is Global Finance, which also has seven steps to determine the value of brands: (a) Calculate the strength of the brand; (b) Determine the royalty rate; (c) Calculate the royalty rate according to the strength of the brand; (d) Determine the brand-specific revenues; (e) Determine the expected revenue for the brand under study; (f) Apply the royalty rate to expected revenues; (g) Calculation of the brand value.
Mizik and Jacobson (2009) also cites consultancy Interbrand, a pioneer in the creation of a Brand Value Ranking, which establishes its model based on (a) identification of real gains strictly related to the brand; (b) capitalization of these gains, applying a multiple to historical gains as a discount rate on future cash flow. For this, two factors are listed: (a) brand gains, which consists of accounting only for the brand's profitability; (b) strength of the brand in which points are observed and analyzed, such as: positioning, market in which it operates, previous performance, competition, future plans and risks. The strength of the brand is defined as a set of seven factors weighted as follows: (a) Leadership (25%): ability to be a dominant and influential force in your market; (b) Stability (15%): a brand's ability to survive for a long period of time; (c) Market (10%): evaluation of aspects such as growth in potential customers, volatility and barriers to new entrants; (d) Geographic expansion (25%): capacity for cultural adaptation of the brand according to its geographical capillarity; (e) Trend (10%): ability to remain relevant to consumers; (f) Support (10%): quantity and quality of marketing and communication activities invested in the brand; (g) Protection (5%): legal right of ownership of the brand.
3 METODOLOGY
Despite the absolute values produced by the methodologies being different, a study by Jonoskova and Krizanova (2017) demonstrated that the evolution of the values over time is similar. The brand values estimated using Interbrand's methodology were chosen because it is widely recognized and accepted by the market and was the first company to have its methodology certified according to ISO 10668, which refers to the necessary requirements for the monetary evaluation of brands.
To analyze the behavior of the most valuable brands in the world, the 2001 to 2018 ranking of the consulting firm Interbrand was used. This Ranking has 100 positions in decreasing order of the monetary value of global brands and it is published annually on the website of the consulting company at www.interbrand.com.
The brands consolidated by economic sectors were analyzed according to the criteria for grouping the Standard & Poors business consultancy consulted directly on the company's website at https://www.standardandpoors.com.
Normalities were tested with the Kolmogorov-Smirnov test and then the appropriate descriptive statistics analysis was performed. Spearman's correlations were used because they are more suitable for non-parametric distributions (MAROCO, 2007; HAIR et al., 2006).
4. Results
Ranking Position
In the period from 2001 to 2018, 171 different brands made up the Interbrand Ranking, of which only 43, or 25%, were present in all years, and of the 100 brands that were in the 2001 Ranking, 51 are present in the Ranking of 2018. Table 1 shows the number of brands present in year versus year.
| Year | 01 | 02 | 03 | 04 | 05 | 06 | 07 | 08 | 09 | 10 | 11 | 12 | 13 | 14 | 15 | 16 | 17 | 18 |
| 01 | - | |||||||||||||||||
| 02 | 90 | - | ||||||||||||||||
| 03 | 87 | 96 | - | |||||||||||||||
| 04 | 80 | 88 | 91 | - | ||||||||||||||
| 05 | 74 | 82 | 85 | 93 | - | |||||||||||||
| 06 | 72 | 80 | 83 | 91 | 98 | - | ||||||||||||
| 07 | 71 | 79 | 83 | 90 | 94 | 95 | - | |||||||||||
| 08 | 68 | 76 | 78 | 85 | 89 | 90 | 92 | - | ||||||||||
| 09 | 67 | 75 | 76 | 82 | 85 | 87 | 89 | 93 | - | |||||||||
| 10 | 63 | 71 | 71 | 76 | 80 | 80 | 81 | 86 | 90 | - | ||||||||
| 11 | 62 | 70 | 71 | 76 | 80 | 80 | 81 | 85 | 87 | 97 | - | |||||||
| 12 | 62 | 70 | 72 | 75 | 78 | 78 | 81 | 83 | 86 | 92 | 94 | - | ||||||
| 13 | 62 | 70 | 72 | 75 | 78 | 78 | 81 | 82 | 85 | 89 | 91 | 97 | - | |||||
| 14 | 59 | 67 | 69 | 71 | 74 | 74 | 77 | 78 | 80 | 84 | 86 | 92 | 95 | - | ||||
| 15 | 55 | 63 | 65 | 67 | 70 | 70 | 73 | 74 | 76 | 81 | 83 | 89 | 91 | 95 | - | |||
| 16 | 54 | 62 | 64 | 66 | 69 | 69 | 72 | 73 | 75 | 80 | 82 | 88 | 89 | 92 | 97 | - | ||
| 17 | 51 | 59 | 61 | 63 | 67 | 67 | 69 | 72 | 73 | 79 | 81 | 86 | 87 | 89 | 94 | 97 | - | |
| 18 | 51 | 59 | 62 | 64 | 68 | 68 | 70 | 72 | 72 | 77 | 79 | 84 | 85 | 88 | 90 | 92 | 95 | - |
Similarly, it is possible to determine the brands that remained in their positions in the Ranking throughout the year. Table 2 presents the result for all years, in which it is observed that of the 51 brands that were in the 2001 Ranking and that remain in the 2018 Ranking (see Table 1), none maintained its position and that the maximum value occurs between the Ranking from 2009 to 2010 in which 27 brands remained in the same position, or otherwise, of the 100 brands that constituted the 2009 Ranking, 90 remained in 2010 (see table 1), however 73 brands changed their position.
| Year | 01 | 02 | 03 | 04 | 05 | 06 | 07 | 08 | 09 | 10 | 11 | 12 | 13 | 14 | 15 | 16 | 17 | 18 |
| 01 | - | |||||||||||||||||
| 02 | 11 | - | ||||||||||||||||
| 03 | 10 | 23 | - | |||||||||||||||
| 04 | 9 | 12 | 11 | - | ||||||||||||||
| 05 | 8 | 11 | 10 | 13 | - | |||||||||||||
| 06 | 7 | 11 | 9 | 17 | 19 | - | ||||||||||||
| 07 | 6 | 9 | 11 | 9 | 11 | 20 | - | |||||||||||
| 08 | 6 | 6 | 7 | 6 | 8 | 4 | 24 | - | ||||||||||
| 09 | 4 | 4 | 7 | 4 | 4 | 4 | 8 | 10 | - | |||||||||
| 10 | 4 | 2 | 3 | 3 | 5 | 4 | 6 | 12 | 22 | - | ||||||||
| 11 | 4 | 1 | 3 | 4 | 3 | 7 | 7 | 8 | 14 | 27 | - | |||||||
| 12 | 5 | 2 | 4 | 6 | 3 | 5 | 6 | 5 | 4 | 9 | 12 | - | ||||||
| 13 | 1 | 0 | 1 | 5 | 3 | 6 | 3 | 2 | 4 | 3 | 7 | 19 | - | |||||
| 14 | 2 | 1 | 1 | 1 | 0 | 3 | 2 | 1 | 6 | 5 | 4 | 9 | 18 | - | ||||
| 15 | 5 | 0 | 1 | 0 | 1 | 3 | 2 | 1 | 4 | 5 | 4 | 4 | 8 | 15 | - | |||
| 16 | 3 | 1 | 3 | 1 | 2 | 0 | 2 | 2 | 3 | 3 | 2 | 4 | 7 | 10 | 20 | - | ||
| 17 | 1 | 1 | 0 | 3 | 1 | 2 | 2 | 3 | 3 | 4 | 4 | 4 | 10 | 6 | 9 | 23 | - | |
| 18 | 0 | 1 | 0 | 3 | 1 | 3 | 1 | 4 | 0 | 4 | 3 | 2 | 7 | 4 | 11 | 8 | 15 | - |
Brand value
The total value of the 100 brands present in the Ranking in 2001 was around 988 billion dollars. In 2018 this sum increased, totaling around 2 trillion dollars, thus showing growth at a rate of 4.28% per year. It is noted that as of 2011, the standard deviation of this sum grows to a greater proportion compared to the average, showing greater differences between the values of the brands of this select group and raising, already high, coefficients of variation. In 2001, the variation coefficient was 1.26, rising to 1.47 in 2018, that is, an increase of about 16%. Table 3 illustrates the minimum, maximum, sums, averages, and standard deviations year-on-year of the Ranking.
| Year | Min. | Max. | Max.-Min. | Sum | Mean | SD |
| 2001 | 1002 | 68945 | 67943 | 988287 | 9882.87 | 12491.50 |
| 2002 | 1509 | 69637 | 68128 | 976657 | 9766.57 | 11863.79 |
| 2003 | 1612 | 70453 | 68841 | 973955 | 9739.55 | 11937.38 |
| 2004 | 2147 | 67394 | 65247 | 995601 | 9956.01 | 11635.59 |
| 2005 | 2357 | 67525 | 65168 | 1045065 | 10450.65 | 11636.30 |
| 2006 | 2689 | 67000 | 64311 | 1092334 | 10923.34 | 11763.10 |
| 2007 | 3026 | 65324 | 62298 | 1155707 | 11557.07 | 12079.82 |
| 2008 | 3338 | 66667 | 63329 | 1214805 | 12148.05 | 12418.70 |
| 2009 | 3081 | 68734 | 65653 | 1158304 | 11583.04 | 12360.83 |
| 2010 | 3110 | 70452 | 67342 | 1202909 | 12029.09 | 12841.30 |
| 2011 | 3512 | 71861 | 68349 | 1258151 | 12581.51 | 13646.19 |
| 2012 | 3731 | 77839 | 74108 | 1384642 | 13846.42 | 16041.45 |
| 2013 | 3920 | 98316 | 94396 | 1500559 | 15005.59 | 18286.15 |
| 2014 | 4103 | 118863 | 114760 | 1600376 | 16003.76 | 19990.73 |
| 2015 | 4114 | 170276 | 166162 | 1714631 | 17146.31 | 23618.85 |
| 2016 | 4011 | 178119 | 174108 | 1796387 | 17963.87 | 24869.25 |
| 2017 | 4004 | 184154 | 180150 | 1871729 | 18717.29 | 26132.15 |
| 2018 | 4214 | 214480 | 210266 | 2015311 | 20153.11 | 29667.83 |
No normalities were found in any of the distributions studied. The Spearman correlations (rho) between the values of the year versus year marks are shown in Table 4 and resulted in positive and highly significant correlations (p < 0.01). According to the classification of Hinkle, Wiersma and Jurs (2003), it is observed that as there is a distance between the years studied, the correlation loses intensity. Taking 2001 as an example, it is possible to notice that the results show very strong correlations (rho > .90) for a time interval from 2002 to 2006, strong (.70 < rho < .90) between 2007 and 2012 and moderate (.50 < rho < .70) between 2013 and 2018.
| Year | 2001 | 2002 | 2003 | 2004 | 2005 | 2006 | 2007 | 2008 | 2009 | 2010 | 2011 | 2012 | 2013 | 2014 | 2015 | 2016 | 2017 | 2018 |
| 2001 | - | |||||||||||||||||
| 2002 | .99** | - | ||||||||||||||||
| 2003 | .97** | .99** | - | |||||||||||||||
| 2004 | .94** | .97** | .99** | - | ||||||||||||||
| 2005 | .93** | .96** | .97** | .99** | - | |||||||||||||
| 2006 | .90** | .93** | .95** | .98** | .99** | - | ||||||||||||
| 2007 | .89** | .92** | .94** | .96** | .97** | .99** | - | |||||||||||
| 2008 | .88** | .92** | .93** | .94** | .95** | .97** | .99** | - | ||||||||||
| 2009 | .86** | .89** | .90** | .90** | .91** | .94** | .96** | .98** | - | |||||||||
| 2010 | .82** | .85** | .86** | .87** | .88** | .91** | .92** | .95** | .99** | - | ||||||||
| 2011 | .79** | .82** | .83** | .84** | .85** | .88** | .90** | .93** | .98** | .99** | - | |||||||
| 2012 | .71** | .77** | .79** | .80** | .81** | .84** | .87** | .91** | .95** | .96** | .97** | - | ||||||
| 2013 | .65** | .72** | .73** | .73** | .74** | .77** | .81** | .85** | .90** | .92** | .95** | .97** | - | |||||
| 2014 | .58** | .66** | .67** | .68** | .69** | .72** | .75** | .79** | .83** | .86** | .89** | .92** | .97** | - | ||||
| 2015 | .71** | .78** | .78** | .76** | .75** | .78** | .81** | .84** | .89** | .91** | .92** | .94** | .96** | .99** | - | |||
| 2016 | .68** | .76** | .74** | .72** | .71** | .73** | .76** | .79** | .85** | .87** | .88** | .90** | .93** | .95** | .98** | - | ||
| 2017 | .66** | .74** | .72** | .70** | .70** | .72** | .73** | .79** | .83** | .86** | .87** | .88** | .90** | .93** | .96** | .99** | - | |
| 2018 | .58** | .66** | .65** | .65** | .66** | .69** | .70** | .75** | .79** | .83** | .85** | .86** | .89** | .92** | .95** | .98** | .99** | - |
Position in the Ranking by sectors
Table 5 shows the number of brands by sector that made up the Rankings for the period evaluated. Over the years, there was a predominance (minimum value of 79% in 2011 and maximum of 84% in 2001 and 2009) in the presence of brands in the sectors of Daily Consumption, Information Technology and Discretionary Consumption. In a comparison between 2018 versus 2001, it is noted that the only sectors to show growth in number of brands were Discretionary consumption (14.71%) with 34 brands in 2001 and 39 in 2018, Industrial (133.33%) with 3 in 2001 and 7 in 2018 and Financial (125.00%) with 4 brands in 2001 and 9 in 2018.
| Sector | 01 | 02 | 03 | 04 | 05 | 06 | 07 | 08 | 09 | 10 | 11 | 12 | 13 | 14 | 15 | 16 | 17 | 18 | 18 vs 01% |
| DC | 34 | 33 | 35 | 38 | 39 | 40 | 39 | 39 | 42 | 35 | 35 | 36 | 38 | 37 | 38 | 38 | 38 | 39 | 14.71 |
| CD | 22 | 20 | 20 | 17 | 17 | 16 | 16 | 15 | 16 | 19 | 17 | 18 | 19 | 18 | 17 | 16 | 16 | 15 | -31.82 |
| E | 3 | 3 | 3 | 3 | 2 | 2 | 2 | 2 | 2 | 1 | 1 | 1 | 1 | 1 | 1 | 1 | 1 | 1 | -66.67 |
| F | 4 | 6 | 7 | 9 | 9 | 9 | 12 | 12 | 9 | 13 | 13 | 10 | 9 | 9 | 9 | 9 | 9 | 9 | 125.00 |
| H | 2 | 3 | 3 | 3 | 3 | 3 | 1 | 1 | 1 | 1 | 1 | 1 | 1 | 1 | 1 | 1 | 1 | 1 | -50.00 |
| I | 3 | 5 | 4 | 3 | 3 | 3 | 3 | 4 | 3 | 4 | 5 | 5 | 5 | 7 | 7 | 7 | 7 | 7 | 133.33 |
| IT | 28 | 27 | 25 | 25 | 26 | 26 | 26 | 26 | 26 | 26 | 27 | 28 | 26 | 26 | 26 | 27 | 27 | 26 | -7.14 |
| TS | 4 | 3 | 3 | 2 | 1 | 1 | 1 | 1 | 1 | 1 | 1 | 1 | 1 | 1 | 1 | 1 | 1 | 2 | -50.00 |
Value of brands by sectors
Grouping the monetary values of the brands over the 18 years studied, Table 6 is obtained, which shows both the values in millions of dollars and the percentage distribution for each year.
| Year | DC | CD | E | F | H | I | IT | TS | |
| 01 | T | 262714 | 189540 | 8506 | 58801 | 18623 | 48341 | 387945 | 13817 |
| % | 26.6% | 19.2% | .9% | 5.9% | 1.9% | 4.9% | 39.3% | 1.4% | |
| 02 | T | 255971 | 195925 | 8558 | 73675 | 21417 | 51000 | 358390 | 11721 |
| % | 26.2% | 20.1% | .9% | 7.5% | 2.2% | 5.2% | 36.7% | 1.2% | |
| 03 | T | 261661 | 202266 | 8972 | 80340 | 22568 | 50599 | 335724 | 11825 |
| % | 26.9% | 20.8% | .9% | 8.2% | 2.3% | 5.2% | 34.5% | 1.2% | |
| 04 | T | 274039 | 194184 | 9139 | 96448 | 22398 | 50488 | 338798 | 10107 |
| % | 27.5% | 19.5% | .9% | 9.7% | 2.2% | 5.1% | 34.0% | 1.0% | |
| 05 | T | 297170 | 196283 | 6850 | 99442 | 20767 | 61004 | 356902 | 6647 |
| % | 28.4% | 18.8% | .7% | 9.5% | 2.0% | 5.8% | 34.2% | .6% | |
| 06 | T | 317168 | 195832 | 7183 | 107537 | 20664 | 64199 | 373124 | 6627 |
| % | 29.0% | 17.9% | .7% | 9.8% | 1.9% | 5.9% | 34.2% | .6% | |
| 07 | T | 339295 | 197847 | 7125 | 137103 | 3445 | 68641 | 395344 | 6907 |
| % | 29.4% | 17.1% | .6% | 11.9% | .3% | 5.9% | 34.2% | .6% | |
| 08 | T | 368064 | 200615 | 7382 | 127020 | 3582 | 74354 | 426595 | 7193 |
| % | 30.3% | 16.5% | .6% | 10.5% | .3% | 6.1% | 35.1% | .6% | |
| 09 | T | 366264 | 207419 | 6944 | 75658 | 3847 | 64375 | 427274 | 6523 |
| % | 31.6% | 17.9% | .6% | 6.5% | .3% | 5.6% | 36.9% | .6% | |
| 10 | T | 346341 | 223316 | 4003 | 94969 | 4155 | 62924 | 460482 | 6719 |
| % | 28.8% | 18.6% | .3% | 7.9% | .3% | 5.2% | 38.3% | .6% | |
| 11 | T | 370784 | 204483 | 4483 | 96190 | 4072 | 68538 | 503218 | 6383 |
| % | 29.5% | 16.3% | .4% | 7.6% | .3% | 5.4% | 40.0% | .5% | |
| 12 | T | 405525 | 226207 | 4788 | 82507 | 4378 | 71953 | 583636 | 5648 |
| % | 29.3% | 16.3% | .3% | 6.0% | .3% | 5.2% | 42.2% | .4% | |
| 13 | T | 459343 | 239613 | 5535 | 81984 | 4777 | 78113 | 626214 | 4980 |
| % | 30.6% | 16.0% | .4% | 5.5% | .3% | 5.2% | 41.7% | .3% | |
| 14 | T | 504278 | 238064 | 6288 | 90141 | 5194 | 87561 | 663748 | 5102 |
| % | 31.5% | 14.9% | .4% | 5.6% | .3% | 5.5% | 41.5% | .3% | |
| 15 | T | 547389 | 233132 | 5530 | 94569 | 5533 | 85938 | 737777 | 4763 |
| % | 31.9% | 13.6% | .3% | 5.5% | .3% | 5.0% | 43.0% | .3% | |
| 16 | T | 595810 | 223638 | 4599 | 96227 | 5790 | 88189 | 777814 | 4320 |
| % | 33.2% | 12.4% | .3% | 5.4% | .3% | 4.9% | 43.3% | .2% | |
| 17 | T | 623309 | 219047 | 4823 | 101572 | 6041 | 91163 | 820182 | 5592 |
| % | 33.3% | 11.7% | .3% | 5.4% | .3% | 4.9% | 43.8% | .3% | |
| 18 | T | 701000 | 213079 | 5276 | 109548 | 6231 | 82586 | 884304 | 13287 |
| % | 34.8% | 10.6% | .3% | 5.4% | .3% | 4.1% | 43.9% | .7% |
As in the analysis by number of brands, there was a predominance (minimum value of 81.1% in 2004 and maximum of 89.2% in 2018) of the monetary value of brands in the sectors of Daily Consumption, Information Technology and Discretionary Consumption. In a comparison between 2018 versus 2001, the only sectors to show involution were Energy (-37.97%), Health (-66.54%) and Telecommunication Services (-3.84%).
When comparing the number of brands with monetary value of the brands, the Information Technology sector stands out, which decreased 7.14% in number of brands in the ratio 2018 and 2001, but presented an increase of 127.95% in terms of monetary value of the brands.
5 FINAL CONSIDERATIONS
The beginning of the 21st century is notably undergoing movements never seen in important fields of social, economic, and political construction of the world. Contemporary philosophy strives to elucidate and justify these movements that originated at the end of the last century. The markets and their elements are also influenced by these times that Bauman defines as liquid. The companies, important players in this market, present relevant changes in the composition of their assets. The value of companies is increasingly converging on intangible assets and, as is known, the brand is a significant portion of these assets, thus deserving attention from the business and academic points of view. Brand management is one of the functions of Marketing and can represent an important contribution in determining the monetary value of companies and can also contribute as an important key performance indicator and link with organizations' financial area.
Research was carried out with the aim of analyzing the behavior of the most valuable brands in the world, according to the Interbrand Ranking, since the beginning of the 21st century and considering whether Bauman's philosophy is also applied to brands. To this end, a review of the literature was carried out in the area in which the increasing participation of intangible assets was found, in which at the beginning of the 1980s they participated with 5% in the value of companies, in the late 1990s this participation rose to 72%, and in 2015 already reached 84% of the value of the companies that make up the S&P 500. Data from Rankings of the consulting firm Interbrand were also recovered for the period from 2001 to 2018 in which the relative position, monetary value of the brands and the economic segments defined by the company were analyzed by Standard & Poors.
It was possible to observe that in the 21st century, brands are becoming more and more valuable, following the growth of intangible assets. In this study, there was great dynamics in the Ranking of brands, either as a change in the positions they occupied, and consequently relative value of these brands, or in the inclusion and exclusion of brands regardless of the economic sectors. As expected, due to the nature of B2C (Business to Consumer) businesses, the sectors of Daily Consumption, Information Technology and Discretionary Consumption have the most brands and the highest monetary value of them, even if the average monetary value is studied, highlighting the Information Technology sector for evidencing a concentration of valuable brands in this economic sector.
With the results obtained, it is still possible to verify that there is great variation in positions and presence in the different rankings of the brands' value. In the period studied, 171 brands made up the Ranking, but only 43 (25%) were present in all the periods. When studying the value of the brands, it was also possible to see that the year-versus-year correlations lose intensity, which allows for a greater repositioning of brands in the Rankings and the emergence of new brands.
In this way it is possible to identify that at least for the sectors most sensitive to the performance of the brands, which are the Business to Consumer markets, we are experiencing a moment of strong oscillation, or taking inspiration from Bauman to say that we live in times of liquid brands.
REFERENCES
AAKER, D. A. Marcas: Brand Equity. Gerenciando o valor da marca. São Paulo: Elsevier, 1998.
BAUMAN, Z. Modernidade Líquida. Rio de janeiro: Zahar, 2000.
BAUMAN, Z. Tempos Líquidos. Rio de Janeiro: Zahar, 2007.
BAUMAN, Z. Capitalismo parasitário e outros temas contemporâneos. Rio de Janeiro: Zahar, 2010.
BOULTON, R. E. S.; LIBERT, B. D.; SAMEK, S. M. Decifrando o Código de Valor. Rio de Janeiro: Ed Campus, 2001.
BRAND FINANCE INSTITUTE. Global Intangible Finance Tracker 2017. Brand Finance Institute. 2017. Disponível em https://brandirectory.com/reports/global-intangible-finance-tracker-gift-2017. Acesso em 31 de ago. 2019.
CRISPIM, S. F.; DORNELLES, M. Brand value in times of crisis: brand and market value, revenue, and profit of companies with the most valuable global brands during and in the post crisis of 2008. International Journal for Innovation Education and Research, Jan. 2020.
DAMODARAN, A. Valuation. Rio de Janeiro: LTC, 2017.
EDVINSSON, L. Developing Intellectual Capital at Skandia. Long Range Planning, 1997. 366-373.
ELSTEN, C.; HILL, N. Intangible Asset Market Value Study? Journal of the Licensing Executives Society, 6 set. 2017.
EVANS, F. ; WURSTER, T. A Explosão dos Bits. Rio de Janeiro: Campus, 2000.
FORBES MEDIA LLC. Billionaires: The richest people in the world. Forbes. Disponível em https://www.forbes.com/billionaires/#2c9bf11a251c. Acesso em 28 de abr. 2019.
HAIR, J. F. et al. Multivariate Data Analysis. Uppersaddle River: Pearson Prentice Hall, 2006.
HARVARD BUSINESS REVIEW. Os CEOs de melhor desempenho no mundo de 2018. https://hbrbr.com.br/os-ceos-de-melhor-desempenho-no-mundo-2/. 2019.
HINKLE, D.; WIERSMA, W.; JURS, S. Applied Statistics for the Behavioral Sciences. Boston: Houghton Mifflin, 2003.
INTERBRAND. Ranking Interbrand das marcas mais valiosas do mundo 2016. Disponível em http://www.rankingmarcas.com.br/. Acesso em 29 de mai. 2019.
INTERBRAND. Ranking Interbrand das marcas mais valiosas do mundo 2019. Disponível em http://www.rankingmarcas.com.br/. Acesso em 20 de ago. 2019.
JANOSKOVA, K.; KRIZANOVA, A. Comparison of selected internationally recognized brand valuation methods. OeconomiaCopernicana, 2017. 99-110.
JOHNSTON, S. Largest companies 2008 vs. 2018, a lot has changed. Nova Zelândia. 2019.
KAYO, E. K. et al. Ativos intangíveis, ciclo de vida e criação de valor. Revista de Administração Contemporânea, jul. / set. 2006.
KOTHARI, M.; MEHTA(RANKA)LATIKA, N. Intangible Assets: A Study of Valuation Models. Research Journal of Management Sciences, 6 fev. 2013. 9-13.
MAROCO, J. Análise estatística - com utilização do SPSS. Lisboa: Sílabo, 2007.
MCDONALD, M.; MOUNCEY, P. Marketing de Resultado: Como Medir e Analisar a efetividade do Marketing em sua Organização. Rio de Janeiro: Campus, 2009.
MIZIK, N.; JACOBSON, R. Value of Marketing. Journal of Marketing, Nov. 2009. 137-153.
RAMASWAMI, S.; SRIVASTAVA, R. K.; BHARGAVA, M. Market-Based Capabilities and Financial Performance of Firms: Insights into Marketing's Contribution to Firm Value. Journal of the Academy of Marketing Science, Jun. 2008. 97-116.
SINCLAIR, R.; KELLER, K. L. Brand value, accounting standards, and mergers and acquisitions: ‘‘The Moribund Effect’’. Journal of Brand Management, Jan. 2017.
SRIVASTAVA, R. K.; SHERVANI, T. A.; FAHEY, L. Market-Based Assets and Shareholder Value: A Framework for Analysis. Journal of Marketing, 1998. 2-18.
VODÁK, J. The Importance of intangible assets for making. Human Resources Management & Ergonomics , fev. 2011. 104-119.
Notas de autor
scrispim@uol.com.br