Artigos
Recepción: 29 Julio 2021
Aprobación: 08 Noviembre 2021
Abstract: Regional inequalities in Brazil are also related to sport performance and, in particular, to football (soccer) performance. In this work, we use data related to the performance of the Brazilian federative units and macro-regions in the first division of the local football championship between 2003 and 2019 to analyze these inequalities. Results indicate a strong correlation between the performance of the Brazilian macro-regions and their gross domestic product (GDP). Considering the 15 federative units that participated in at least one edition of the Brazilian first division this correlation is reaffirmed. The presence of occasional outliers (Southern region and Rio de Janeiro, for example) suggests that additional factors (such as tradition and number of fans) may contribute to explaining regional performance in the Brazilian football championship. Measurement issues and the collinearity of these factors with other indicators, however, pose additional difficulties to this kind of analysis.
Keywords: regional inequalities, football soccer, federative units, Brazil.
Resumo: As desigualdades regionais que marcam o país refletem-se também no desempenho esportivo e, em particular, no futebol. Neste trabalho, empregam-se dados relativos ao desempenho das unidades da federação e das macrorregiões brasileiras na série A do campeonato brasileiro, entre 2003 e 2019, para analisar essas desigualdades. Os resultados indicam que o desempenho das macrorregiões brasileiras mantém uma forte correlação com o produto interno bruto (PIB). No conjunto das 15 unidades da federação que estiveram representadas na série A do campeonato brasileiro também se observa, de modo geral, uma forte correlação entre desempenho e PIB. A presença de eventuais outliers (região Sul e Rio de Janeiro, por exemplo) sugere que fatores adicionais (como a tradição e o número de torcedores) podem contribuir para explicar o desempenho das regiões no campeonato brasileiro, embora dificuldades de aferição e problemas de colinearidade com outras variáveis imponham dificuldades adicionais para sua inclusão nos modelos.
Palavras-chave: desigualdades regionais, futebol, unidades da federação, Brasil.
1 Introduction
Brazil is widely recognized for its high degree of regional inequality. More than half a century ago Williamson (1965, p. 111-115) referred to the country as the one with the most notorious North-South problem and universally cited for its severe North-South schism. Likewise, Baer (2008, p. 243) highlights how inequality in the geographic distribution of income has been a feature of the Brazilian economy since colonial times. Although possible movements of convergence have been observed over the last decades, the regional inequalities that mark the country have been recurrently reaffirmed both in academic publications and in the political debate (Monteiro Neto, 2014; Figueiredo & Porto Junior, 2015; Gimenez, 2017).
Regional inequalities measured on the basis of economic indicators are strongly associated with other social indicators such as education and health. Although it is not easy to establish causal links between these variables, there is recurrent evidence of deep regional inequalities in education, higher education and infant mortality indicators, for example. Thus, the Human Development Index (HDI) – which results from a weighting of income, education and health indicators – also proves to be quite unequal in the country (Mendes et al., 2020).
However, analyses regarding regional inequalities in Brazil hardly ever involve achievements in sports. In the specific case of football, for example, intuition suggests that teams of the Southern and Southeastern regions tend to collect more titles, but there is no systematic analysis of indicators related to the performance of regions - or teams of each macroregion or federative unit (states and federal district), for example – and their possible correlation with the regional inequalities that mark the country. This topic is still little explored in Brazil, but it has been subject of publications abroad, whether regarding the inequalities in performance at the Olympic games (Reiche, 2016) or regarding the performance of football teams in different regions (Garcia et al., 2007; Doran & Jordan, 2018; Jones & Jordan, 2019). These publications tend to rely on exploratory and multidisciplinary analyses. According to Garcia et al. (2007, p. 83), “sports geography in general and football geography in particular can be analyzed using concepts found in a wide variety of disciplines, including cultural, historical, economic, demographical, urban and political economy views”.
This paper analyzes regional inequalities in football (soccer) achievements in Brazil based on data related to the performance of the federative units and the Brazilian macro-regions in the first division of the Brazilian championship between 2003 and 2019. Besides this introduction, this paper is structured in four additional sections. In section 2, a brief literature review of the relationship between economic indicators and performance in sports is presented. The third section describes the data and methods used to assess regional inequalities in football in Brazil. The results are the subject of section 4. Lastly, the fifth section presents the paper’s main conclusions.
2 Literature Review
There is a wide bibliographic production on regional inequalities in Brazil addressing both economic and social aspects (Monteiro Neto, 2014; Figueiredo & Porto Junior, 2015; Gimenez, 2017, Mendes et al., 2020). In addition to analyses dedicated to differences in GDP per capita, there are also studies that analyze, for example, inequalities related with access to health services or the internet (Albuquerque et al., 2017; Barbosa, 2018). However, with regard to sports performance in general, and to football activities in particular, no available publications for the Brazilian case have been identified so far. Predictive analyses of the performance of countries (obviously represented by a single team) in the football world cup are based, in general, on characteristics of the teams themselves (for example, their performance in the period immediately prior to the analyzed event or their indication as top seed) and not on variables related to the countries they represent (Monks & Husch, 2009).
For that reason, publications that point to explanatory factors of the performance of countries at the Olympics and a reasonably specific bibliography on the factors associated with the performance of football teams were used to support the analyses presented in this paper. These two approaches – briefly discussed in sections 2.1 and 2.2 below – support the design of the methodological procedures and the analysis of the results of this article.
2.1 Performances at the Olympic games
Although the importance of competing rather than winning is generally emphasized, the success of national athletes at the Olympic games is obviously a source of prestige for countries (Bian, 2005). For that reason, several authors have sought to identify the reasons why some countries perform better than others.
About fifty years ago, Novikov and Maximenko (1972) analyzed the correlations between socioeconomic variables and the performance of countries participating at the 1964 Tokyo Olympic Games. Their research revealed that “the achievements of socialist countries in the Olympic games are markedly higher in comparison with the sports successes of capitalist countries” (ibid., p. 38). Novikov and Maximenko (1972, p. 39) indicate the variables that exhibited positive correlations with sports performance. These variables, in descending order of magnitude of the correlation coefficients, are: i) per capita income; ii) calories in the food consumed by population; iii) average life expectancy; iv) illiteracy rate; v) urbanization rate; vi) number of inhabitants. Regarding the number of inhabitants, however, the authors point to the absence of “significant dependence”. Although still limited from the point of view of the statistical analysis methods it employs, the work by Novikov and Maximenko (1972) already identifies GDP (which corresponds to GDP per capita × population) as the main variable associated with performance at the Olympic games. At about the same time, Grimes, Kelly and Rubin (1974) built a socioeconomic model of performance at the Olympic games to verify whether communist countries would have better results than other countries when controlling for economic and demographic aspects. The authors conclude that communist countries effectively performed better than other countries even after controlling for other variables.
Based on a similar logic, Bernard and Busse (2004) developed a model to predict the number of medals obtained by a given country. The authors consider population, GDP per capita, a dummy for the host country, a dummy for countries under Soviet influence and a dummy for planned economies (eq. 1).

In equation 1, 𝜏𝑖 is a variable that captures the idiosyncratic characteristics of each country and 𝜀𝑖 is an error term with normal distribution.
Bernard and Busse (2004) conclude that all these factors are significant but point out that “per capita income and population have identical effects at the margin, suggesting that total GDP is the best predictor of national Olympic performance” (Bernard & Busse, 2004, p. 417).
Johnson and Ali (2004) analyze participation and performance at winter and summer Olympic games. Their conclusions are, to a large extent, intuitive and similar to those of Bernard and Busse (2004). However, they emphasize that participation in winter games, compared to summer games, is more affected by income indicators, less affected by population indicators, less biased in favor of the host country, and more weather-sensitive. Despite those possible differences between the two types of events, Johnson and Ali (2004) conclude that socioeconomic variables explain the participation and the performance of countries at the Olympic Games quite well.
Bian (2005, p. 43) reaffirms the conclusions of Bernard and Busse (2004) and Johnson and Ali (2004): “socioeconomic variables, including population size, economic resources, hosting advantage, and political structure have a significant impact on a country’s Olympic performance”. Pfau (2006) uses a similar model (except for the inclusion of dummies for Scandinavian, German, Alpine, and North American countries) to predict the performance of countries at the 2006 Winter Olympics in Turin. Once again, the central role of demographic and economic variables in the performance at Olympic games is confirmed. Bernard (2008), in a simpler work, applies the method developed by Bernard and Busse (2004) to predict the performance of countries at the Beijing Olympic Games.
Rathke and Woitek (2008) use a stochastic frontier method to assess the ‘efficiency’ of countries to produce medals, taking into account the multiple resources available to them (GDP, population and dummies for planned economies or for countries that hosted the games, for example). Similarly, Wu, Liang and Yang (2009), albeit limiting the explanatory variables to GDP per capita and population, apply a data envelopment analysis (DEA) model to measure the performance of countries at six editions of the Olympic Games between 1984 and 2004. The authors obtain a ranking of countries that, in practice, captures their efficiency in converting ‘inputs’ (i.e., explanatory variables) into ‘outputs’ (i.e., medals). Jablonsky (2018) also uses a two-stage DEA model, but instead of resorting to ‘traditional’ variables (“population, economic strength measured by gross domestic product and tradition in sports”), he seeks to assess countries’ performance “with respect to the resources they can spend”.
Reiche (2016) consolidated several analyses of this nature in a book entitled “Success and Failure of Countries at the Olympic Games”. The author divides the explanatory factors into two large blocks: general and specific Olympic success factors. The general factors involve ideology, wealth, population, and geography, while the specific focus on public policies involving promotion of women, institutionalization, specialization, and early learning.
Throughout the publication, the author refines several analyses mentioned in this section. For example, in relation to wealth, Reiche (2016, p. 11) indicates that “many studies emphasize the correlation of GDP and Olympic success”, but argues that “the importance of wealth depends on the type of sport and Games”, because “wealth of a country matters more at the Winter than at the Summer Games because the Winter Olympics are more dependent on costly infrastructure”. As a result, the population is more relevant in determining performance at summer games than at winter games.
To sum up, there is considerable convergence among the various authors mentioned in this section regarding the central role of demographic and economic variables in countries’ performances at the Olympic games. Of course, in this case, unlike football teams (which may hire players from other regions, for example), the reliance on the total population (as a kind of proxy for the ability to supply athletes) can play a distinct role in the results.
2.2 Football teams’ performance
Unlike the previous section which focuses on the performance of countries involved in multiple competitions at the Olympic games, this section deals with the performance of individual football teams. The purpose is to verify whether the available bibliography would point to local variables capable of explaining the performance and thus affecting regional inequalities relating to this aspect.
There is a relatively vast literature on the factors that influence the performance of football teams. The focus can be on national teams as well as on clubs or associations. Part of the analyses of national teams uses their previous performance as an explanatory variable. Robberechts and Davis (2018), for example, used the performance of national teams in the World Cups between 2002 and 2014 to predict the results of the 2018 World Cup. Other authors use parameters analogous to those used in the analysis of performance in the Olympic games. Hoffmann, Ging, Ramasamy (2002), for example, sought to identify the explanatory variables for the scores obtained by the national teams in the ranking of the Fédération Internationale de Football Association (FIFA) in January 2001 and found that economic, demographic, cultural, and climatic factors exert a strong influence on the results. In particular, the gross national product (GNP) per capita, the average annual temperature, the share of the country's population in the world population, a dummy for host countries since the 1930 World Cup and the combination of a dummy for Latin countries with population proved to be significant in the estimated regressions.
In the case of clubs (which, in general, can have access to players of multiple nationalities), the availability of resources for contracting and training players and for investing in training infrastructure is also an explanatory variable for performance. In order to review the labor market of football players in the main European championships, Frick (2007) registers the market values of the first division teams in England, Italy, Spain, Germany, and France in the 2005/2006 and 2006/2007 seasons. The aggregate transfer values range between €2.33 billion (England, relating to the 2006/2007 season) and €1.08 billion (France, relating to the previous season). Those values suggest that, in theory, richer regions (or, at least, teams that mobilize more resources from their fans or those interested in their matches) would tend, ceteris paribus, to have better players and more robust structures and to present better performances. When analyzing the teams in the ‘Serie A’ of the Italian championship between the 2007-2008 and 2013-2014 seasons, Ferri et al. (2017) conclude that performance is positively associated with players’ salaries. The authors, however, do not identify a significant effect of transfer values on team performance.
The analysis of the clubs’ efficiency in converting resources into results was the subject of some previous works. Ribeiro and Lima (2012) use a DEA model to measure the efficiency of the first division Portuguese teams and Zambom-Ferraresi, García-Cebrián and Lera-López (2017) analyze the UEFA Champions League over multiple seasons. Although the focus of those analyses is on club management (i.e., their ability to convert resources into results), it is clear that, as a rule, teams from richer and more populous regions tend to mobilize more resources and to perform better.
In line with that perception, Garcia et al. (2007, p. 83) test “the relative influence of the main demographic and economic factors that determine the international football success of a representative sample of European cities”. The nuclear hypothesis is that the ability of cities to support local teams is a function of the size and wealth of their population. Omondi-Ochieng (2015) examines the association between gross national income (GNI) per capita, acquisition of football workers (including players) and performance (measured on the basis of qualifications in continental championships). The results indicate that the GNI per capita is positively and significantly associated with the acquisition of football workers, but it is not a good predictor of performance. Omondi-Ochieng (2015) argues that “football officials and professionals emerged to be the key predictors of football performance and not per capita GNI”. In this way, the GNI per capita would only indirectly influence performance.
The concept of agglomeration economies (Combes, Duranton & Gobillon, 2011) has also been used by some authors to analyze the performance of football teams. Bäker, Mechtel and Vetter (2012) indicate that derbies between teams from the same city or region catch more public attention than ‘normal’ matches, even if their objective indicators (eg, number of goals scored) are not statistically different.
3 Methodological Procedures
This section describes the data and methods of analysis used to assess regional inequalities in the first division of the Brazilian championship.
3.1 Data
The GDP and population data of the municipalities, federative units and macro-regions were tabulated for the year 2018, which corresponds to the last one available at this level of aggregation on the website of the Brazilian Institute of Geography and Statistics (IBGE).
The performance data (measured on the basis of the participation and accumulated points) of the teams of the first division of the Brazilian championship were tabulated on a yearly basis for the period in which the competitions were played under the point tally system in a league format (between 2003 and 2019). After that, the data were consolidated to obtain the shares and accumulated points in the period (Table 1). Of course, the accumulated points can be affected by the behavior of teams which, in the last rounds, (when their chances of title, access to other competitions or relegation to the second division are already shaped) do not have incentives to accumulate more points. An alternative would be to use, instead of the accumulated points, ordinal indicators (that is, the position in the group of teams). That option, however, would not be able to capture exceptionally good or bad performances. For that reason, this paper uses the participation and the accumulated points in the first division of the Brazilian championship.
As shown in section 2, other factors can explain the performance of the teams and the regions where they are based in football championships. These factors may involve:
Tradition, measured by the team’s or region’s past performance in football championships.
Number of fans, which affects the ability to mobilize financial resources and thus to hire human resources (including players).
Regional rivalries, which can, through agglomeration economies, positively affect the performance of local teams.
Available budget, related both to the ability to raise funds (partners, public in stadiums, television quotas and sponsorships, for example) and expenses (payroll, and expenses with training infrastructure, for example).
Public resources invested in sports and incentive policies (for example, public facilities such as stadiums and tax breaks).
However, the measurement of those aspects is, in general, controversial. In the case of tradition, somewhat intuitive for football fans, even authors that have pointed out its role in determining international rankings (Macmillan; Smith, 2007) recognize the difficulties for consolidating quantitative data that could be used in regressions. As for the number of fans, research institutes (such as Ibope or Datafolha) only release occasional data based on samples and using different methods. Therefore, there is no unified methodology and rankings of number of fans can present significant differences. Issues such as the profile of fans of teams with national coverage (distinct from that of fans of regional teams) would also have to be taken into account for the eventual inclusion of this variable in regression models. That is because the profile of fans is associated with both income levels and the involvement of fans with the team and affects the way the number of fans interferes with the capacity to raise funds. In the case of regional rivalries, although the concept is also intuitive, its definition, in practice, requires facing aspects such as the definition of ‘region’ (states, metropolitan regions or municipalities). Definitions of this kind would affect, for example, the extent to which teams of the Santos region have regional rivals in the city of São Paulo. Club budgets, on the other hand, are not widely available and, even if they were, would also be subject to controversy over their accounting. Finally, there is no consolidated data on public resources invested in sports and incentive policies at the subnational level. In any case, if available, those data would hardly diverge significantly from other more general economic indicators (such as GDP or GDP per capita).
Even if it were possible to obtain data for these additional factors, their inclusion would, in many cases, cause problems of collinearity with the performance itself, which would limit their possibilities of use in econometric regressions. For example, tradition is, to some extent, also a metric of past performance. In any case, the absence of these data obviously limits the possibilities of analyzing regional inequalities in Brazilian football and only their possible future availability would allow for a refinement of the models used in this work. Therefore, due to the aforementioned limitations, it was decided to use only demographic and economic data. This procedure, albeit limited, is in line with several of the references mentioned in section 2, as detailed below.
3.2 Methods of analysis
Among the references mentioned in section 2.1, the most frequent method of analysis is based on linear regressions in which a dependent variable (participation in sport events or performance in such events) is associated with a set of independent variables, with an emphasis on demographic and economic ones. Likewise, some works cited in section 2.2. such as Garcia et al. (2007) and Omondi-Ochieng (2015),correlate demographic and economic variables of subnational jurisdictions to the performance of local football teams.
When taking into account performance, demographic (population), economic (GDP) and other aspects mentioned in section 3.1 (tradition, number of fans, presence of regional rivalries, budget and public resources), a general model (which would correspond to the ‘theoretical basis’ of the present work) could be:

In this model, the subscripts i and t represent the jurisdiction (macro-region or federative unit, for example) and the period (season or accumulated seasons). The idiosyncratic characteristics of each jurisdiction are captured by 𝜏𝜏𝑖𝑖 and 𝜀𝜀𝑖𝑖𝑖𝑖 is the error term with normal distribution.
A series of practical difficulties stand in the way of applying a model of this nature to macro-regions or federative units in Brazil:
The reduced number of observations (five, in the first case, and 27, in the second), so that the regressions would have reduced statistical significance.
This problem is aggravated by the presence of a reasonably high number of explanatory variables (which reduces the degrees of freedom);
The presence of a significant number of observations for which the dependent variable is zero (in the case of states that were not represented in the first division of the Brazilian championship during the period considered).
As argued above, the inclusion of additional explanatory variables would imply problems related to data quality and their collinearity with one another and with the performance itself.
For these reasons, this work uses simpler analyses in which the correlations between the variables are explored through a set of graphs, avoiding regressions whose statistical significance could be questioned. In this sense, although equation 2 summarizes the theoretical basis adopted in this work, the regressions adopted here are simple regressions, not multiple regressions.
It is evident that these relatively simple analyses can be refined in future work, either by including additional explanatory factors or by using units of analysis that increase the number of observations (e.g., municipalities or metropolitan regions).
4 Results
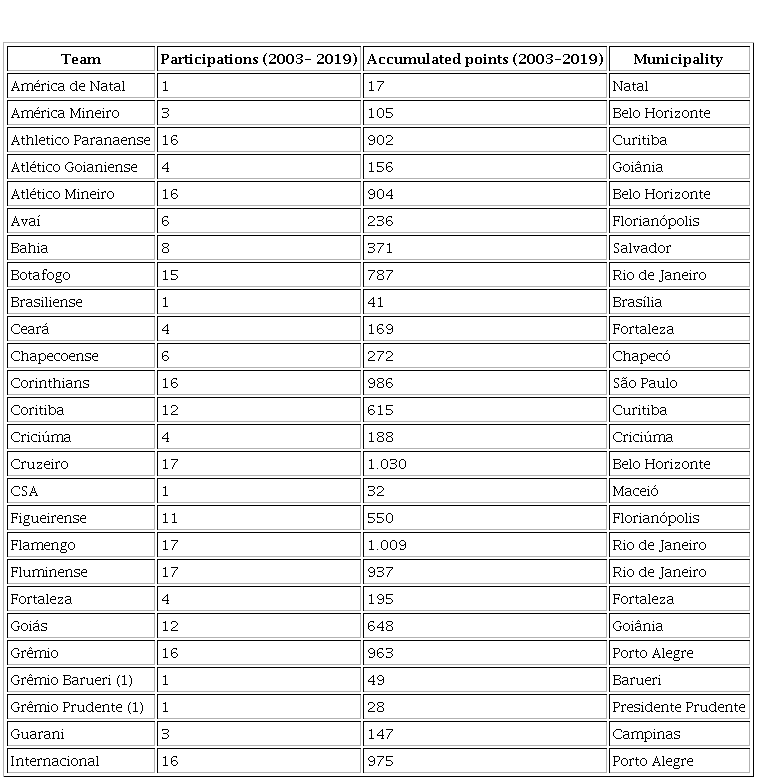
The participations and the accumulated points of the teams in the first division of the Brazilian championship calculated according to the procedures described in section 3.1 are indicated in table 1.
Table 1– Performance (participation and accumulated points) of the teams in the first division of the Brazilian championship (2003-2019)
Performance participation and accumulated points of the teams in the first division of the Brazilian championship 20032019
Performance participation and accumulated points of the teams in the first division of the Brazilian championship 20032019
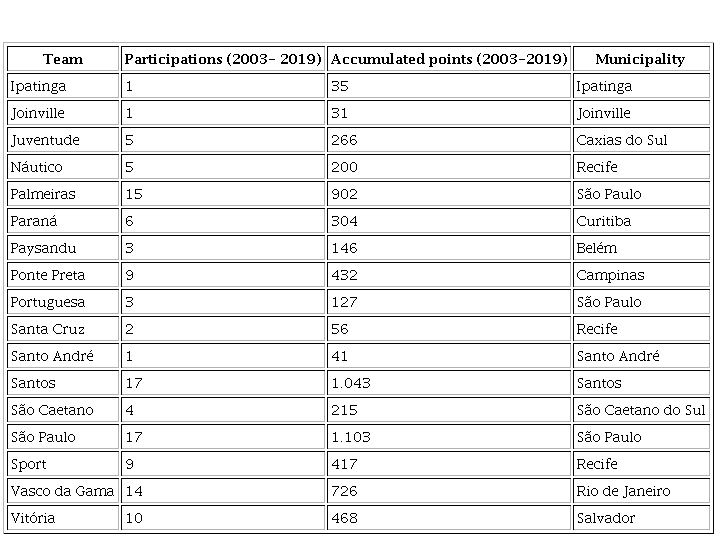
Note 1: Grêmio Barueri and Grêmio Prudente were considered different teams. Source: elaborated by the author.
As shown in the table, considering the participations in the period, there were 43 teams headquartered in 25 municipalities and 15 federative units. All five Brazilian macro-regions are represented in the sample
As indicated in the previous section, regressions with only five macro-regions would not be minimally robust. Exercises were also carried out with regressions for the 27 federative units using only GDP and population as explanatory variables (since the other variables indicated in equation 2 were not available). Regression models were tested using ordinary least squares (OEM) and generalized linear models (GLM) with Poisson and negative binomial distributions. Although in some cases positive and significant coefficients have been obtained (especially in the case of the population), for the reasons explained at the end of section 3.2, it was decided to favor simpler analyses in which the correlations between the variables are explored in graphs.
Figures 1, 2 and 3 relate the total number of participations of the five Brazilian macroregions in the first division of the Brazilian championship between 2003 and 2019 with population, per capita GDP and GDP, respectively. Figure 4 relates the accumulated points in the same period with GDP.
Figure 1 –– Participation of the teams in the first division of the Brazilian championship (2003-2019) by population (million inhabitants, 2018) and by Brazilian macro-regions
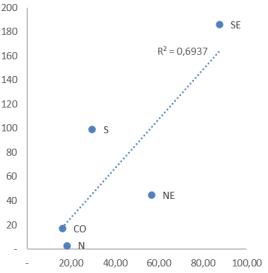
Figure 2
–Participation of the teams in the first division of the Brazilian championship 2003 2019 by per capita GDP current R thousand 2018 and by Brazilian macroregions
Figure 2 –Participation of the teams in the first division of the Brazilian championship (2003- 2019) by per capita GDP (current R$ thousand, 2018) and by Brazilian macro-regions
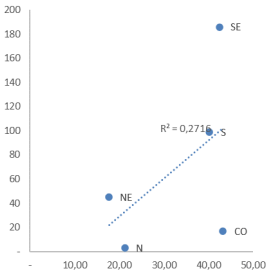
Figure 3
–– Participation of the teams in the first division of the Brazilian championship 20032019 by GDP current R billions 2018 and by Brazilian macroregions
Figure 3 –– Participation of the teams in the first division of the Brazilian championship (2003-2019) by GDP (current R$ billions, 2018) and by Brazilian macro-regions
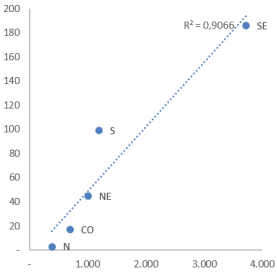
Figure 4
–– Accumulated points of the teams in the first division of the Brazilian championship 2003 2019 by GDP current R billions 2018 and by Brazilian macroregions
Figure 4 –– Accumulated points of the teams in the first division of the Brazilian championship (2003- 2019) by GDP (current R$ billions, 2018) and by Brazilian macro-regions
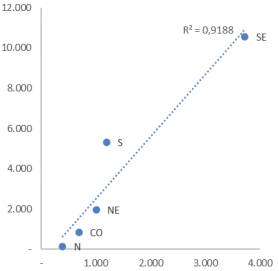
Figure 4
–– Accumulated points of the teams in the first division of the Brazilian championship 2003 2019 by GDP current R billions 2018 and by Brazilian macroregions
Source: elaborated by the author.
Although obviously simplified, the figures already point to some methodological conclusions related to regional inequalities in Brazilian football.
When considering participation, population (figure 1) and per capita GDP (figure 2) exhibit lower adjustments than those obtained using GDP (figure 3). In addition, accumulated points (figure 4) show a slightly higher adjustment than that resulting from the use of the participations(figure 3). The R2 values obtained in those two cases (0.9066 and 0.9188) confirm this perception. The correlation between performance and GDP is consistent with the regressions mentioned in section 2.1, according to which the best adjustments for performance at the Olympic games were obtained by combining population and per capita GDP (since, of course, GDP = population × per capita GDP). As evidenced in section 2.1, several authors point out the existence of a positive correlation between GDP and performance at the Olympics (Novikov; & Maximenko, 1972; Bernard & Busse, 2004; Bian, 2005; Reiche, 2016; Jablonsky, 2018). The results reported in this work are also consistent with some works mentioned in section 2.2, which deal with the performance of football teams. In particular, the results are consistent with the works of Garcia et al. (2007) and with those who extend the concept of agglomeration economies to football performance.
In addition to the methodological conclusions, the figures confirm the perception that there is a correlation between GDP and participations (figure 3) or accumulated points (figure 4) of Brazilian macro-regions in the first division of the Brazilian championship. This result, in general terms, is consistent with the works mentioned in section 2 of this article. Of course, this is the general trend. When analyzing the macro-regions individually, four of them are ‘underrepresented’ (that is, situated below the trend line), while the Southern region exhibits a performance around 40% higher than expected considering its GDP. This suggests that other factors may explain their performance in the Brazilian first division. These factors could involve, for example, tradition, the number of fans and regional rivalries (which, as argued in section 2.2, can positively affect the performance of local teams). These aspects could also explain the underrepresentation of the Northern and Center-Western regions. Both regions have fewer traditional teams with fewer fans and, in many cases, lack regional rivals to encourage their performance. Thus, in general, deviations from the trend shown in figures 3 and 4 could be attributed to a kind of circular and cumulative causation (Myrdal, 1957): regions that perform better in football tend to become more traditional, to mobilize more fans and to favor local rivalries and, with that, to improve their performance. On the other hand, in regions where these factors are absent, performance tends to decrease and, therefore, to limit the occurrence of factors that could improve it
As stressed above, the inclusion of those factors is limited because i) there are no established metrics of tradition, number of fans and regional rivalries that would allow their use in econometric regressions; and ii) even if the data were immediately available, problems of collinearity would have to be dealt with. For these reasons, this work did not seek to include additional variables in the proposed model.
By extending the analysis to the 15 federative units represented in the sample, graphs 5 and 6 are obtained, in which the participations and accumulated points are correlated with GDP.
Figure 5 –Participation of the teams in the first division of the Brazilian championship (2003- 2019) by GDP (current R$ billions, 2018) and by Brazilian federative units
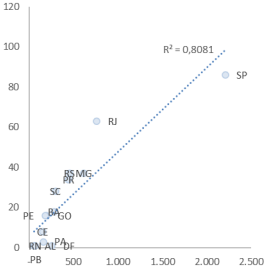
Figure 6
–– Accumulated points of the teams in the first division of the Brazilian championship 20032019 by GDP current R billions 2018 and by Brazilian federative units
Figure 6 –– Accumulated points of the teams in the first division of the Brazilian championship (2003-2019) by GDP (current R$ billions, 2018) and by Brazilian federative units
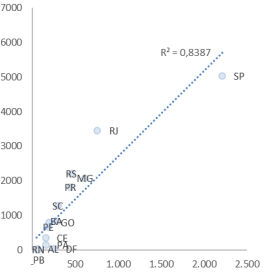
Figure 6
–– Accumulated points of the teams in the first division of the Brazilian championship 20032019 by GDP current R billions 2018 and by Brazilian federative units
Source: elaborated by the author.
The results indicated in figures 5 and 6 are largely intuitive. First, they reaffirm the perception that GDP is, in general, a good predictor of participation and performance in the first division of the Brazilian championship. This proposition is obviously limited to the set of 15 federative units represented in the sample. This procedure is similar to that adopted by Bernand and Busse (2004), who limited their analysis to the countries that participated at the Olympic Games. In any case, this set of 15 federative units represented 88.60% of the country's GDP in 2018. In both graphs, the states in the Southeast region (except Espírito Santo) and the three states of the Southern region stand out. The other states of the federation appear at the bottom left of the graph. In any case, the correlation between the performance of the federative units in the first division the Brazilian championship and GDP is consistent – as in the case of the macroregions – with several works analyzed in section 2 of this paper.
In absolute terms, the main outlier of graphs 5 and 6 is Rio de Janeiro, whose indicators are superior to those that would be predicted based on its GDP. The same additional factors mentioned above contribute to explain this behavior. In addition, as Rio de Janeiro was the country’s capital until 1960 (that is, during the period when football became more popular), it ended up hosting teams that mobilized the interest of fans from outside the state as well, which could contribute to the amplification of extra-economic factors that contribute to the team’s performances. Interestingly, in São Paulo where many extra-economic factors would be present in the case of its better positioned teams, the performance observed is inferior to what would be expected considering its GDP. In this case, the high economic concentration in that state did not fully translate into performance in the first division of the Brazilian championship between 2003 and 2019.
5 Concluding Remarks
This paper analyzed football regional inequalities in Brazil based on data related to the performance of the federative units and the Brazilian macro-regions in the first division of the Brazilian championship between 2003 and 2019. A brief bibliographical review indicated that sport performance it is strongly correlated with demographic and economic indicators. This perception was confirmed in works that analyze the performance of countries at the Olympics. In the case of performance in football, many analyses are based on the previous performance of the teams and not on indicators of their host regions. Yet, it was possible to observe that richer regions tend to have more robust structures and to present superior performances. In the case of European football, evidence was also reported of an association between regional economic indicators, the ability to hire football professionals and performance measured on the basis of qualifying for continental championships. Furthermore, the literature review showed that the presence of local rivals (made possible by larger urban scales) can contribute to the performance of teams.
Data on the performance of the teams of the first division of the Brazilian championship were tabulated for the period in which the competitions were played in point tally league format (between 2003 and 2019). Future works may also include data of the second division from 2006 onwards. With that, 30 new teams and three more federative units would compose the sample. However, the eventual inclusion of the second division teams would require some type of criteria to adjust their performance with the performance of teams in the first division. As a result, this ad hoc procedure would need to be clearly defined before it could be possible to extend the analysis to the second division.
he results indicate that the performance of Brazilian macro-regions in the first division of the Brazilian championship between 2003 and 2019 is strongly correlated with GDP. This result is consistent with several references mentioned in section 2, according to which the best adjustments were obtained by combining population and per capita GDP (since GDP = population × per capita GDP). The exception is the Southern region, whose performance is around 40% higher than would be expected considering its GDP. The correlation between performance and GDP was reaffirmed when analyzing the 15 federative units (corresponding to 88.60% of the country's GDP) that were represented on at least one occasion in the first division of the Brazilian championship. The main exception, in this case, is the state of Rio de Janeiro, which outperforms what would be predicted based on its economic indicators. The presence of possible outliers suggests that other factors may explain the performance in the first division of the Brazilian championship. As pointed out in section 4, tradition, these factors could involve the number of fans and the presence of regional rivalries that would configure a kind of circular and cumulative causation: regions that perform better in football tend to become more traditional, to mobilize new fans and to favor local rivalries and, therefore, to improve their performance. Although it is not possible, at this time, to include these additional factors in the regressions (due to measurement difficulties and their collinearity with economic indicators), their correlation with the performance of teams in the Brazilian championship cannot be ruled out. Thus, the present work could be the starting point for a series of future improvements to investigate the relationship between regional inequalities and performance in football, which also involve the inclusion of additional explanatory factors and the use of units of analysis that increase the number of observations (municipalities or metropolitan regions).
Despite their limitations, the findings presented in this paper have a number of implications for sport policymakers and football team managers. First, peripheral regions are unlikely to be able to exhibit exceptional cumulative performances. Although this may occasionally happen, economic aspects will tend to make performance fall back to the average (that is, to adjust, broadly speaking, to GDP). Yet, the combination of additional factors (tradition and number of fans, for example) can contribute to improving performance. Although these factors require time to be constructed by a given team, it is possible that communication strategies more adjusted to the new social context can contribute to capturing more fans and to obtaining better performances. Finally, contrary to the emotional reaction of the fans (who tend to want the failure of regional rivals), the presence of antagonists with compatible performances tends to contribute to improving the performance of teams and regions.
References
Albuquerque, M. V., Viana, A. L. A., Lima, L. D., Ferreira, M. P., Fusaro, E. R., & Iozzi, F. L. (2017). Desigualdades regionais na saúde: mudanças observadas no Brasil de 2000 a 2016. Ciência & Saúde Coletiva, 22(4), 1055-1064.
Baer, W. (2008). The Brazilian Economy: Growth and Development (6ª ed.). Lynne Rienner Publishers.
Bäker, A., Mechtel, M., & Vetter, K. (2012). Beating thy neighbor: derby effects in German professional soccer. In R. H. Koning & W. Maennig (Eds.), Sports Economics: Present and Future Impact on General Economics. Lucius & Lucius Verlagsgesellschaft mbH.
Barbosa, J. R. A. (2018). Reflexões sobre desigualdades regionais referentes ao uso da internet no território brasileiro. Revista contexto geográfico, 3(5), 75-81.
Bernard, A. B. (2008). Going for the gold: who will win the 2008 Olympic Games in Beijing. Tuck School of Business.
Bernard, A. B., & Busse, M. R. (2004). Who Wins the Olympic Games: Economic Resources and Medal Totals. Review of Economics and Statistics, 86(1), 413-417.
Bian, X. (2005). Predicting Olympic medal counts: the effects of economic development on Olympic performance. The Park Place Economist, 13.
Combes, P.-P., Duranton, G., & Gobillon, L. (2011). The identification of agglomeration economies. Journal of Economic Geography, 11(2), 253–266.
Doran, J., & Jordan, D. (2018). The effect of geographical proximity and rivalry on performance: evidence from the English Football League. Regional Studies, 52(11), 1559–1569.
Ferri, L., et al. (2017). Financial Versus Sports Performance: The Missing Link. International Journal of Business and Management, 12(3), 36.
Figueiredo, E., & Porto Junior, S. (2015). Persistência das desigualdades regionais no Brasil: polarização e divergência. Nova Economia, 25(1), 195-208.
Frick, B. (2007). The football players’ labor market: empirical evidence from the major European leagues. Scottish Journal of Political Economy, 54(3), 422–446.
García, P. C., Castro, J. A. D., & Santos, J. M. S. (2007). The economic geography of football success: empirical evidence from European cities. Rivista diritto ed economia dello sport, III(2).
Gimenez, D. M. (2017). Política social e desequilíbrios regionais no Brasil em tempos de crise. Campinas: Unicamp / Instituto de Economia (texto para discussão n. 301).
Grimes, A. R., Kelly, W. J., & Rubin, P. H. (1974). A socioeconomic model of national olympic performance. Social Science Quarterly, 55(3), 777–783.
Hoffmann, R., Ging, L. C., & Ramasamy, B. (2002). The Socio-Economic Determinants of International Soccer Performance. Journal of Applied Economics, 5(2), 253–272.
Jablonsky, J. (2016). Ranking of countries in sporting events using two-stage data envelopment analysis models: a case of Summer Olympic Games 2016. Central European Journal of Operations Research, 26(4), 1-16.
Johnson, D. K. N., & Ali, A. (2004). A tale of two seasons: participation and medal counts at the Summer and Winter Olympic Games. Social Science Quarterly, 85(4).
Jones, C., & Jordan, D. (2019). Agglomeration, urbanization, and competitive performance: the natural experiment of English football. Regional Studies, Regional Science, 6(1), 421-438.
Macmillan, P., & Smith, I. (2007). Explaining International Soccer Rankings. Journal of Sports Economics, 8(2), 202–213.
Mendes, W. A., et al. (2020). Desenvolvimento humano e desigualdades regionais nos municípios brasileiros. Latin American Research Review, 55(4), 742–758.
Monks, J., & Husch, J. (2009). The Impact of Seeding, Home Continent, and Hosting on FIFA World Cup Results. Journal of Sports Economics, 10(4), 391-408.
Monteiro Neto, A. (2014). Desigualdades regionais no Brasil: características e tendências recentes. Boletim regional, urbano e ambiental, 9, jan.-jun.
Myrdal, G. (1960). Teoria econômica e regiões subdesenvolvidas. Rio de Janeiro: UFMG Biblioteca Universitária (Edição original: 1957).
Novikov, A. D., & Maximenko, A. M. (1972). The Influence of Selected Socio-Economic Factors on the Level of Sports Achievements in the Various Countries: (using as an example the 18th Olympic Games in Tokyo). International Review of Sport Sociology, 7(1), 27–44.
Omondi-Ochieng, P. (2015). Gross national income, football workers, and national football team performances: a logistic regression analysis. Team Performance Management, 21(7/8), 405-420.
Pfau, W. D. (2006). Predicting the medal wins at the 2006 Winter Olympics. The Korea economic review, 22(2).
Rathke, A., & Woitek, U. (2008). Economics and the Summer Olympics: An Efficiency Analysis. Journal of Sports Economics, 9(5), 520–537.
Reiche, D. T. (2016). Success and failure of countries at the Olympic Games. Abingdon, Oxon; New York, NY: Routledge.
Ribeiro, A. S., & Lima, F. (2012). Portuguese football league efficiency and players’ wages. Applied Economics Letters, 19(6), 599–602.
Robberechts, P., & Davis. (2018). Forecasting the FIFA World Cup: combining result- and goal-based team ability parameters. In U. Brefeld, J. Davis, J. Haaren, & A. Zimmermann (Eds.), Machine Learning and Data Mining for Sports Analytics. 5th International Workshop, MLSA 2018.
Williamson, J. G. (1968). Regional Inequality and the Process of National Development. In L. Needleman (Ed.), Regional Analysis: Selected Readings. Penguin Books, p. 99-158.
Wu, J., Liang, L., & Yang, F. (2009). Achievement and benchmarking of countries at the Summer Olympics using cross efficiency evaluation method. European Journal of Operational Research, 197(2), 722–730.
Zambom-Ferraresi, F., García-Cebrián, L. I., & Lera-López, F. (2017). Sports Results measurement and efficiency in UEFA Champions League. Athens Journal of Sports, 4(4).
