Artigos
Regional concentration of the red ceramic industry in Paraíba, Brazil (2006 - 2020)
Regional concentration of the red ceramic industry in Paraíba, Brazil (2006 - 2020)
Gestão & Regionalidade, vol. 39, e20237960, 2023
Universidade Municipal de São Caetano do Sul
Recepción: 28 Junio 2021
Aprobación: 12 Julio 2022
Abstract: This work analyzed the regional concentration of the red ceramic sector, from 2006 to 2020. It carried out a statewide analysis of the sector's conjuncture, its relation to firewood consumption and the regional concentration was determined through the indicators: Concentration Ratio CR(k ), Herfindahl-Hirschman Index (HHI), Theil entropy (E) and the Gini coefficient (G). The results showed that Borborema has the highest number of red ceramic companies when compared to the other mesoregions of the state. The CR(k) rated with moderately low concentration. The HHI for municipalities and microregions showed low concentration. The municipal, micro-regional and meso-regional E indices of Paraíba indicated deconcentration. G showed weak to average inequality for municipalities and microregions and weak inequality for mesoregions. Thus, it was concluded that the ceramic sector in Paraíba is not concentrated and that the supply is associated with raw material stocks and the energy vector of firewood.
Keywords: regionalization, concentration measures, bioenergy.
Resumo: Este trabalho analisou a concentração regional do setor de cerâmica vermelha, no período de 2006 a 2020. Realizou uma análise estadual de conjuntura do setor, sua relação consumo de lenha e a concentração regional foi determinada por meio dos indicadores: Razão de Concentração CR(k), Índice de HerfindahlHirschman (HHI), Entropia de Theil (E) e o coeficiente de Gini (G). Os resultados mostraram que na Borborema encontra-se as maiores quantidades de empresas de cerâmica vermelha quando comparada às demais mesorregiões do estado. O CR(k) classificou com concentração moderadamente baixa. O HHI para os municípios e microrregiões demonstrou baixa concentração. Os índices de E municipais, microrregionais e mesorregionais da Paraíba indicaram desconcentração. O G mostrou desigualdade fraca a média para os municípios e microrregiões e desigualdade fraca para as mesorregiões. Assim, concluiuse que setor cerâmico da Paraíba não é concentrado e que a oferta encontra-se associada aos estoques de matéria-prima e ao vetor energético da lenha
Palavras-chave: regionalização, medidas de concentração, bioenergia.
1 Introduction
The use of natural resources, for a long time, was used as a basic source of subsistence for the human species. In the last century, however, their importance for development and expansion grew and they started to be used in the modern world aiming at convenience and economic growth (NATHANIEL, 2021). One of the industrial sectors that collaborates with economic development is red ceramics, which plays an important role in economic, artistic, and cultural heritage terms. Ceramic was one of the first objects to be manufactured and, due to its various applications, it persists to this day as an added value input (HEIN; KILIKOGLOU, 2018).
Activities aimed at meeting human needs, such as the exploitation of natural resources and energy consumption, have environmental consequences (NATHANIEL, 2021). Within the dimension of sustainability, the ceramic industries contribute to the generation of environmental impacts. This sector has been providing negative environmental impacts over the years, mainly due to the use of raw materials and other inputs extracted directly from nature, such as firewood and clay (ABRAHÃO; CARVALHO, 2017 DEL RIO et al., 2022; GIUDICE et al., 2017). In recent years, the development of the Brazilian red ceramic industry has led to the expansion of micro and small companies, mainly in the semi-arid region. In this area there is the availability of materials with low production cost, favoring the regional economic growth of the sector. Other factors such as environmental conditions and inspection difficulties allow this sector to use natural resources in an exacerbated way (SILVA; MEXAS; QUELHAS, 2017).
In 2018, the global ceramics market had an estimated value of around US$ 229.13 billion, with growth projections of 8.6% from 2019 to 2025 (DEL RIO et al., 2022). The demand is related to the construction industry, technological advances in nanotechnology, 3D printing and ceramics in health (i.e. oral health through the production of dental crowns, implants and bridges) (ALY et al., 2012). In Brazil, in 2015, there were 6,903 ceramic factories distributed throughout the country, with annual revenue of R$ 18 billion and a 4.8% share of the civil construction industry in the country (ASSOCIAÇÃO NACIONAL DA INDUSTRIA CERÂMICA – ANICER, 2015). The Brazilian Northeast was the third largest producing region of ceramic materials in Brazil, where the state of Ceará had the largest number of red ceramic companies, with more than 200 units. Bahia, despite being the second largest in number of companies, had the highest production with 380 x103 thousand/month, followed by the states of Ceará, Rio Grande do Norte, Pernambuco, Maranhão, Paraíba, Sergipe, Piauí and Alagoas. Paraíba was in sixth place, producing 57 x103 thousand/month (ANNUAL REPORT OF SOCIAL INFORMATION – RAIS, 2017).
In Paraíba, the sector has approximately 150 small and medium-sized companies in 30 municipalities, registering 20 thousand direct jobs and annual revenue of around R$140 million. Ceramic products (75% of blocks and 25% of tiles) are intended to serve the domestic market and, mainly, neighboring states such as Pernambuco and Rio Grande do Norte (RAIS, 2017; SINDICATO DA INDÚSTRIA DE CERAMICA VERMELHA DO ESTADO DA PARAÍBA – SINDICER, 2018). The state of Paraíba has two ceramic-producing poles, where the largest companies in Paraíba are concentrated. The first hub brings together cities from Zona da Mata and Agreste regions of Paraiba, due to the existence of sedimentary basins with clay deposits, making them more conducive to the extraction of better quality material for the production of red ceramics. The second ceramic producing pole is in the interior of the state, with smaller companies and availability of energy resources, such as firewood (COELHO JUNIOR; BURGOS; SANTOS JUNIOR, 2018; COELHO JUNIOR et. al, 2018; MARTINS et al., 2018).
The concentration of companies in a region consists of the increase in the control exercised by it in an economic activity. Knowing this market structure helps the organization of strategies and investments, modifying performance, competitiveness among participants in a sector, as well as identifying areas with higher levels of companies’ concentration. For an economy to develop, it must implement diversification strategies in underexplored markets that have growth potential. Concentration measures are used to analyze the market structure and highlight the dimension of competitiveness. These indicators summarize in a concept of multiple dimensions, such as supply and demand, technological capacity, cost structure, and others (COELHO JUNIOR et al., 2013; POSSAS, 1999; ROCHA, 2010).
Currently, industrial concentration indicators are applied to the productive sector, as Selvatti et al. (2019) for world MDF exports and Coelho Junior et al. (2021) for bioelectricity thermoelectric plants in Brazil. In view of that the concentration of ceramic industries is related to forestry activities for the production of energy resources, this paper points out Coelho Junior et al. (2013) with world exports of forest products, Simione et al. (2017) the production of firewood and charcoal from forestry in Brazil, Coelho Junior et al. (2018) on firewood from Paraíba and Coelho Junior et al. (2022) on firewood in Rio Grande do Norte.
Concentration measures help decision-making by providing empirical guiding elements for public policies and investments. To assist the local and regional development of the ceramic sector, this work analyzed the regional concentration among the red ceramic industries in the state of Paraíba, Brazil, from 2006 to 2020.
2 Material and methods
Data and Conjuncture Analysis
Data from the red ceramic sector in Paraíba (Figure 1), from 2006 to 2020, were obtained from the Annual Report of Social Information (RAIS) of the Ministry of Labor, Brazil. The category of manufacture of ceramic and baked clay artifacts for use in construction was used, except for tiles and floors. The analysis of the regional distribution and concentration of the red ceramic industries in Paraíba, with geographic cuts at the municipal, micro-regional and mesoregional levels.
The conjuncture analysis included the evolution of red ceramic companies in the mesoregions of Paraíba, from 2006 to 2020. Through quartiles (Equation 1), the spatial distribution of companies in the municipalities and microregions in Paraíba was evaluated, for 2006, 2013 and 2020 (DAWSON, 2011).
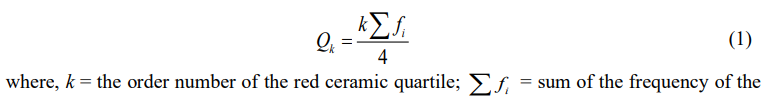
number of red ceramic companies in the municipalities and microregions of the state of Paraíba. The number of companies in the ceramic sector was categorized into levels: low (Quartile one – Q1), medium (Quartile two – Q2), high (Quartile three – Q3) and very high (Quartile four – Q4) (YADAV; SINGH; GUPTA, 2019).
Measures of Concentration and Inequality
The following four concentration indicators were used: Concentration Ratio CR(k), Herfindahl–Hirschman Index (HHI), Theil Entropy Index (E) and Gini Coefficient (G) (COELHO JUNIOR et al., 2018). The results obtained by the HHI, E and G index are more reliable than those of the CR(k) index, considering the total number of participants, called summary indices (BOFF; RESENDE, 2002). The Concentration Ratio CR(k), Equation 2, calculates the market share of the k (where k = 1, 2, ..., n) ceramic companies in the state of Paraíba (BAIN, 1959).

where, CR(k) = concentration ratio of k red ceramic producing regions; Si: market share of region i (municipalities and microregion) for the number of ceramic companies in the state of Paraíba. It calculated the CR(4) and CR(8) of red ceramic companies in the municipalities and microregions and classified it according to Table 1. It also used the municipal CR(20) and CR(30).
Figure 1 -- Geographic location of the state of Paraíba, in Brazil and in the Northeast Region.
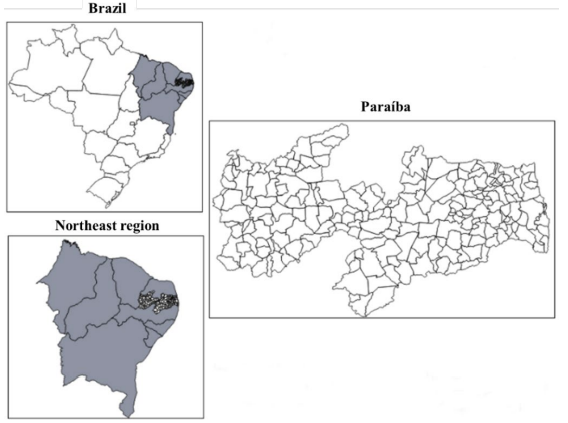
Figure 1
Geographic location of the state of Paraíba in Brazil and in the Northeast Region
Source: Instituto Brasileiro de Geografia e Estatística - IBGE (2018).
Table 1 - Degree of concentration classification by means of the Concentration Ratio [CR(k)]
| Very high | CR(4) ≥ 75% | CR(8) ≥ 90% |
| High | 65% ≤ CR(4) < 75% | 85% ≤ CR(8) < 90% |
| Moderately high | 50% ≤ CR(4) < 65% | 70% ≤ CR(8) < 85% |
| Moderately low | 35% ≤ CR(4) < 50% | 45% ≤ CR(8) < 70% |
| Low | CR(4) < 35% | CR(8) < 45% |
Source: Coelho Junior et al. (2022).
The Herfindahl–Hirschman index (HHI) (Equation 2) was calculated based on the sum of the number of companies squared, for the municipal, micro-regional and meso-regional levels of Paraíba. The HHI varies from its lower limit 1/n (minimum concentration) to 1 (maximum concentration) (HIRSCHMAN, 1964).
where, n = Number of participants in the number of companies in Paraíba, at regional levels (municipalities, microregion and mesoregion) and 2 Si = market share of region i (municipalities, microregion and mesoregion) for the number of companies of ceramics in the state of Paraíba. For comparative analyses, when there is variation in the number of regions with ceramic companies, that is, entry or exit of participants, Resende (1994) suggested the adjusted Herfindahl-Hirschman Index (HHI'), according to Equation 4.

The use of the HHI' implies an interval variation between 0 and 1, thus, as the index moves away from zero, the greater the concentration. The indicator can be classified as shown in Table 2.
Table 2 -Degree of concentration classification of the adjusted Herfindahl-Hirschman Index (HHI’).

Source: Resende and Boff (2002).
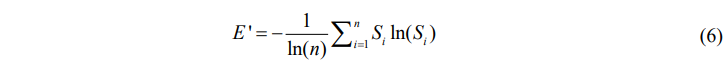
Theil's Entropy calculation (E), Equation 5, proposed by Theil (1967), was developed based on the information theory and can be used as an indicator of concentration.

where, Si = market share of region i (municipalities, microregion and mesoregion) for the number of ceramic companies in the state of Paraíba; ln = Neperian logarithm e n = Number of participants with ceramic companies, at regional levels (municipalities, microregions and mesoregions) of Paraíba.
The index of E measures the inverse of the concentration, the E presents variation between 0 and ln(n), being 0 for monopoly condition and ln(n) for a homogeneous market, in this case, the industries have equal market shares, that is, minimum concentration (RESENDE; BOFF, 2002). Similar to the HHI, Resende (1994) suggested that, for intertemporal analyses, Entropy should be adjusted (E'), according to Equation 6. Thus, Entropy varies between 0, monopoly (maximum concentration), and 1, perfect competition (minimum concentration).
The Gini Index (G) verified the degree of inequality in the number of industries by regional level (municipalities, microregions and mesoregions). The G, Equation 7, was used as an accessory tool to the concentration coefficients since a high concentration implies greater inequality.
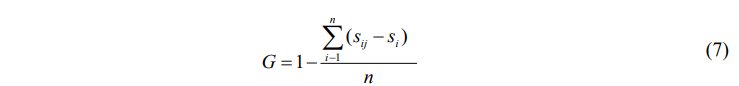
where, Si = region’s market share i (municipalities, microregion and mesoregion) for the number of ceramic companies in the state of Paraíba; Sij = cumulative participation (j) of region i (municipalities, microregions and mesoregions) for the number of ceramic companies in Paraíba; n = number of participants with ceramic companies, at the regional levels (municipalities, microregion and mesoregion) of Paraíba. The Gini index varies between 0 and 1, classified as follows: 0.101 – 0.250 null to weak inequality; 0.251 – 0.500 weak to medium inequality; 0.501 – 0.700 medium to strong inequality; 0.701 – 0.900 strong to very strong inequality; 0.900 – 1.000 very strong to absolute inequality (COELHO JUNIOR; BURGOS; SANTOS JUNIOR, 2018).
3 Results and discussion
Table 3 shows the evolution of the number of red ceramic companies in the mesoregions of the state of Paraíba, from 2006 to 2020. It was found that ceramic companies were part of the economy of all mesoregions of the state, for all the years analyzed. The Agreste was the region with the highest number of ceramic companies in Paraíba. In 2020, 39.1% of the ceramic industries in the state were located in the Agreste region, followed by 23.2% in Borborema, 18.8% in Mata Paraibana and 18.8% in the Sertão region. The activity grew in the state between 2006 and 2020, jumping from 45 to 69 installed ceramic industries. In percentage terms, there was an average growth of 3.10% p.a. for the sector. The Sertão mesoregion had the greatest expansion for the period, with an increase of 11.04% p.a., followed by: Agreste (5.36% p.a.), Mata Paraibana (1.20% p.a.) and Borborema, which decreased at a rate of -0.84% p.a.). The evolution of the sector demonstrates the impact of ceramic industries on the regional economy.
Table 3 -Evolution of red ceramic companies in the mesoregions of the state of Paraíba, from 2006 to 2020.

45
Source: RAIS (2022).
The large availability of industries in the Agreste and Borborema region (mainly between 2011 and 2015) may be associated with the supply of polycationic and sodium smectites. Pereira et al. (2014) pointed out that the state of Paraíba is the largest national supplier, with deposits located in the municipality of Boa Vista and new reserves in the municipalities of Cubatí, Pedra Lavrada and Sossêgo, all located in the Borborema mesoregion and close to the Agreste. Another factor that enables the installation of ceramic industries in the mesoregions of Agreste and Borborema is the availability of energy resources. According to IBGE data (2022) the mesoregions showed growth in firewood production, the main energy vector for the sector, with an increase of 0.89% p.a. in Agreste production, and 2.00% p.a. in Borborema, in contrast to the state's behavior, with a decrease of 0.08% p.a.. Coelho Junior et al. (2018) also pointed out that the production of firewood in the state has been decreasing, a situation justified by the environmental damage caused by the consumption of this resource, as well as the limitation of reserves and greater inspection by government agencies.
Figure 2 shows the quartiles of red ceramic industries for the municipalities and microregions of the state of Paraíba, for 2006, 2013 and 2020. It was possible to observe an increase in the number of red ceramic industries, mainly in the municipalities belonging to the Sertão and Agreste mesoregions. In 2006, the municipalities that represented the greatest number of ceramic industries were Picuí, with 4 industries (Quartile 4 – very high), Guarabira, Mulungu, Santa Rita and São José de Sabugi, each district with 3 industries, which characterized Q3 – high. Such values are due to the geographic location, the environmental conditions, and mainly the lack of supervision, making it possible that the natural resources can be extracted in high quantities.
Figure 2 -Quartiles of red ceramic companies for the municipalities and microregions of the state of Paraíba, for 2006, 2010 and 2020.
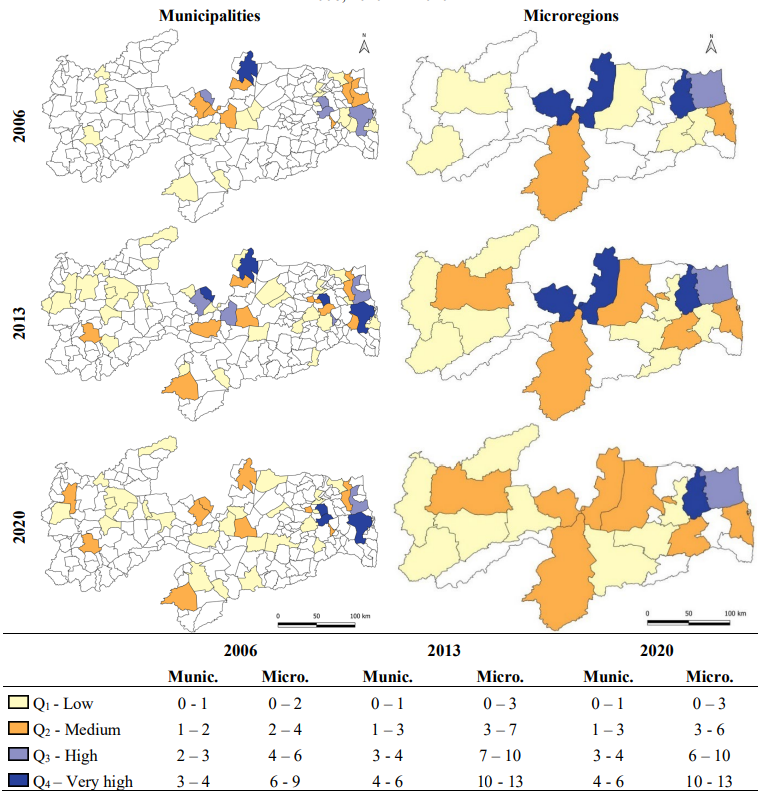
Figure 2
Quartiles of red ceramic companies for the municipalities and microregions of the state of Paraíba for 2006 2010 and 2020
Source: Research data (2022).
Quartile 2 (medium) consisted of the municipalities of Caldas Brandão, Juazeirinho, Junco do Seridó, Mamanguape, Nova Palmeira, Rio Tinto and Santa Luzia, with 2 industries each. Quartile 1 (low) showed only one ceramic industry in each municipalities, which were Aparecida, Belém, Congo, Cruz do Espírito Santos, Cuitegí, Itaporanga, Jacaraú, João Pessoa, Monteiro, Olivedos, Pirpirituba, Santa Cruz, Sapé, Soledade and Taperoá. In 2013, there was a small expansion of ceramic companies, the municipality of Guarabira, located in Mata Paraibana, and São José do Sabugi, from Agreste, which became participants in Q4, bringing the total to 6 companies installed, along with Picuí, also with 6 ceramic industries. Also, in Q4, the growth in the participation of Santa Rita stood out, which jumped from 3 to 5 ceramic industries, and it should be noted that the district reached the mark of 7 industries installed in 2012. Q3 consisted on the cities of Santa Luzia, Juazeirinho, Rio Tinto and Caldas Brandão. In 2020, with the closure of several companies in the sector, the municipality of Santa Rita presented 6 companies. The other participants in Q3 were Mulungu and Guarabira.
For the microregion level, there was an increase in the number of ceramic industries, mainly in the microregion of Guarabira, jumping from 9 companies in 2006 to 13 in 2020. In 2006, the regions participating in Q4 were Guarabira, Seridó Ocidental and Seridó Oriental and, as well as the municipalities, these regions had access to energy reserves and sources. Q3 consisted of Litoral Norte, focusing on Rio Tinto and Mamanguape. Q2 for the microregion of João Pessoa (highlighting Santa Rita) and Cariri Ocidental. Abrahão and Carvalho (2017) highlighted the Guarabira region as an area with a predominance of ceramic industries, and argue that the area has a high clay concentration soil (with high degree of purity) and favorable physical/climatic conditions.
In 2013, Q4 consisted of the municipalities of Seridó Oriental, Guarabira and Seridó Ocidental. Menezes, Neves and Ferreira (2001) highlighted that the Seridó area has potential for research and clay production. Q3 consisted only of the Litoral Norte region, remaining in the same quartile as in 2006. In turn, Q2 had 5 microregions: Cariri Ocidental, João Pessoa, Sousa, Itabaiana and Curimataú Ocidental. The last year of analysis showed a decrease in the total number of companies, but Guarabira continued as the most representative microregion (Q4), followed by Litoral Norte (Q3) and João Pessoa (Q2). For the study period, Sapé and Umbuzeiro were the microregions with the lowest number of companies, reaching a maximum of 2 and 1 company per year, respectively.
The construction industry represented a high importance in the economic and social development of the state. According to the Annual Survey of the Civil Construction Industry (IBGE, 2018), the civil industry in Paraíba grew approximately 97% from 2008 to 2018, increasing the number of ceramic companies that supply their products for construction. The ceramic industry is one of the sectors that develops the most, and this growth is due to the large population increase in cities. In expansion, the increase in the number of companies provides development in the economic sphere. However, environmental problems arising from processes inherent to production are also intensified, such as the removal of vegetation and problems related to soil wear.
Felipe (2002) showed that the expansion of ceramic companies in the state of Rio Grande do Norte has been worrying society and the agencies that take care of the environment in the state. These activities use as energy sources wood removed from the vegetation of the caatinga, which is in a state of scarcity, which creates the conditions for the emergence of deserts when destroyed. Within this necessary scenario, policies to encourage cleaner production are created, in order to guarantee the sustainability of the company and the nondegradation of natural resources. Figure 3 shows the concentration of red ceramic industries for the municipalities and microregions of the state of Paraíba for the years 2006 to 2020. For the municipalities, it was observed that between the years 2006 to 2010, the CR(4), Figure 3.a, ranged from 28.90% to 33.33%, being the period of greatest concentration for the indicator. For the entire period analyzed, the mean CR(4) was 27.94% with a moderately low concentration classification. In 2020, the participants of the CR(4) were the municipalities of Santa Rita, Guarabira, Mulungu and Rio Tinto.
For CR(8) the average was 46.57%, classifying the sector as having a moderately low concentration. For the period from 2006 to 2010, the index average was 53.96%, which showed an increase in the spatial distribution of industries in the state. The year with the lowest degree of concentration 38.10% was 2014, the highest concentration occurred in 2008, with 57.89%. The average concentration ratio for the 20 municipalities CR(20)Munic was 74.41%. For the entire period of analysis, 70 municipalities had ceramic companies, which demonstrates that there is specialization of some municipalities for this industrial activity.
Figure 3 -Evolution of the Concentration Ratio [CR(k)] of red ceramic companies by municipalities and microregions of Paraíba, from 2006 to 2020.
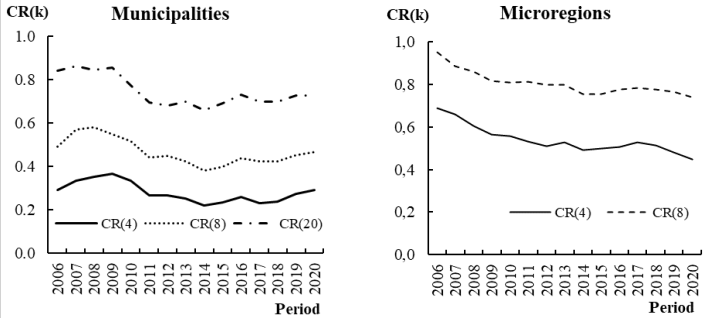
Figure 3
Evolution of the Concentration Ratio CRk of red ceramic companies by municipalities and microregions of Paraíba from 2006 to 2020
Source: Research data (2022).
For the micro-regional level, Figure 3.b, the average of CR(4) was 54.14%, characterizing a market with moderately high concentration, according to Coelho Junior et al. (2018) when four microregions hold more than 40% of the market, the structure of this market is oligopolistic. The Guarabira microregion was the main region for ceramic industries for 10 years, from 2006 to 2007, 2012 and 2014 to 2020. During 2008 to 2011 and in 2013, the main microregion was Seridó Oriental, reaching 14 industries in 2013. The microregions of Guarabira, Seridó Oriental, Seridó Ocidental and Cariri Ocidental and Litoral Norte contributed to compose the CR(4)Micro, for most of the period studied. The CR(8) had an average of 80.57%, a moderately high concentration. The microregions of Sapé and Itaporanga had the lowest number of companies. Coelho Junior, Burgos and Santos JUNIOR (2018), in the period from 1994 to 2014, found that the microregions with the highest production of firewood in the state of Paraíba were Itaporanga, Cariri Ocidental, Sousa, Cariri Oriental, Serra do Teixeira, Piancó, Seridó Ocidental Paraibano, Curimataú Ocidental and Seridó Oriental Paraibano, Cajazeiras and Patos, which showed a strong relationship with the microregions where the largest amounts of red ceramics were found in the state.
According to Martins et al. (2018), the intensive demand for firewood in these regions, mainly to meet the demand of red ceramic companies, has accelerated the process of desertification in the northeastern semi-arid region. Also, according to the authors, the Brazilian Northeast has a level of desertification similar to that of African countries and this activity exerted pressure on forest resources, collaborating with the intensification of this environmental impact. Although the Concentration Ratio index [CR(k)] indicated moderate concentration, the inclusion of summary indices complements the analysis performed. Figure 4 presents the Herfindahl-Hirschman Indices (HHI) for red ceramic companies at municipal, microregional and mesoregional levels, from 2006 to 2020.
For the level of municipalities, an average HHI of 0.0403 was observed, with a lower limit of 0.02624, thus, it was possible to observe that there is no strong concentration among the districts. Due to the counting of the number of participants, it is possible to see a smoothed behavior between the years, however, the period from 2007 to 2010 was the one with the highest concentration trend. For HHIMicro, it was characterized with an average of 0.1031, while LL was 0.06, which showed a non-concentrated market. The concentration measured by the HHIMicro was decreasing and had the highest concentration index in 2006 (0.144). For the mesoregions, there were only four participants, which resulted in a higher level of concentration. The average of the HHIMeso was 0.2871 and the LLMeso was 0.25, considering that the four mesoregions had industries in the ceramic segment, from 2006 to 2020, these values showed low concentration.
Figure 4 -Evolution of the Herfindahl-Hirschman Index (HHI), the lower limit of the HHI (LL) and the adjusted HHI (HHI') for red ceramic companies for the municipalities, microregions and mesoregions of the state of Paraíba, from 2006 to 2020.
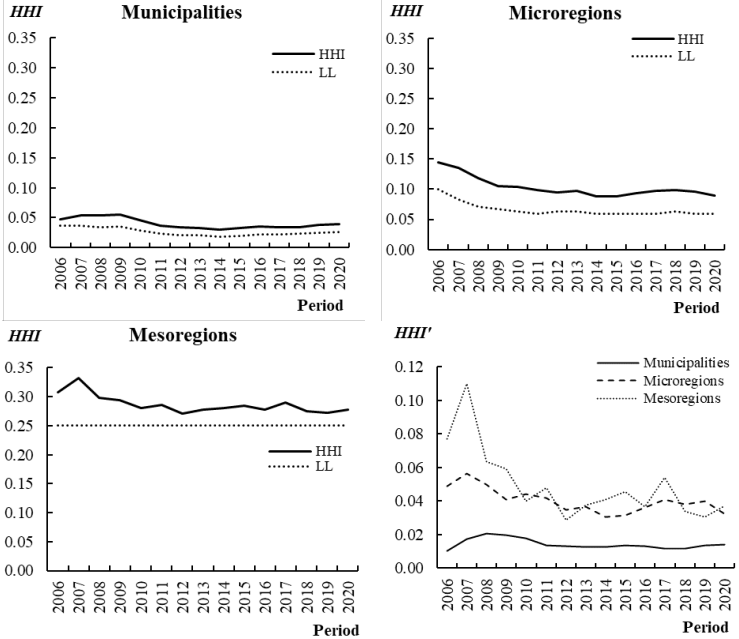
Figure 4
Evolution of the HerfindahlHirschman Index HHI the lower limit of the HHI LL and the adjusted HHI HHI' for red ceramic companies for the municipalities microregions and mesoregions of the state of Paraíba from 2006 to 2020
Source: Research data (2022)
The average HHI' for the municipalities was 0.014, which characterized a competitive market, the maximum value was 0.020 (2008), when the municipalities of Picuí and Santa Rita dominated the sector, with 6 companies each. For HHI'Micro, the average was 0.040, which also indicated a highly competitive market. Among the microregions, the highest concentration occurred in 2007 (0.056), with Guarabira, Seridó Oriental and Seridó Ocidental, as the most representative regions. For the mesoregions there was also no concentration, considering the index average (0.049), however, in 2007, the sector was classified as not concentrated, with HHI'Meso = 0.1100, a result found by the high accumulation of companies in the Borborema region. Red ceramic companies use a large part of the firewood production in the state of Paraíba, Coelho Junior, Burgos and Santos JUNIOR (2018) highlighted that the firewood market at the municipal and microregional level, between 1994 and 2014, was highly competitive, which reflects the disposition of industries in the state.
petitive, which reflects the disposition of industries in the state. Theil’s Entropy Indexes for the number of red ceramic companies are shown in Figure 5, for the municipalities, microregions and mesoregions for the years 2006 to 2020. The municipal, microregional and meso-regional E indices of Paraíba remained close to the Upper Limit (UL) indicating that the sector is competitive. Entropy for the municipalities had an average of 3.45 (with UL = 3.67), the microregions of 2.46 (with UL = 2.73) and mesoregions an average of 0.87 (with UL = 1.39).
Figure 5 -Evolution of the Entropia Index (E), upper limit (UL) and adjusted entropy (E') for red ceramic companies for the municipalities, microregions and mesoregions of Paraíba, from 2006 to 2020.
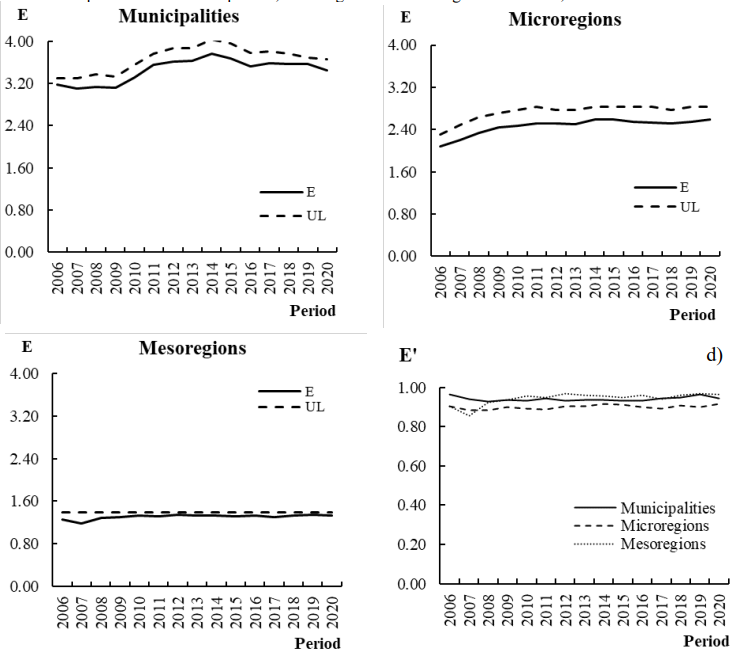
Figure 5
Evolution of the Entropia Index E upper limit UL and adjusted entropy E' for red ceramic companies for the municipalities microregions and mesoregions of Paraíba from 2006 to 2020
Source: Research data (2022).
The results found for Entropy corroborate the Concentration Ratio and the HerfindahlHirschman Index, evidencing a highly competitive market for municipal and micro-regional levels. According to the adjusted Entropy index, Figure 5.d, the regions of Paraíba indicated minimum concentration over the years observed and the means for adjusted entropy were: EMeso = 0.9427, EMicro = 0.9001, EMuni = 0.9404. Coelho Junior, Burgos and Santos JUNIOR (2018) point out that the Entropy Index for firewood production showed similar behaviors between municipalities and microregions of the state of Paraíba, showing low concentration. The municipal, micro-regional and mesoregional E indices of Paraíba remained close to the Upper Limit (UL) indicating that the sector is competitive. Entropy for the municipalities had an average of 3.45 (with UL = 3.67), the microregions of 2.46 (with UL = 2.73) and mesoregions with an average of 0.87 (with UL = 1.39). The results found for Entropy corroborate the Concentration Ratio and the Herfindahl-Hirschman Index, evidencing a highly competitive market for municipal and micro-regional levels. According to the adjusted Entropy index, Figure 5.d, the regions of Paraíba indicated minimum concentration over the years observed, the means for adjusted entropy were: EMeso = 0.9427, EMicro = 0.9001, EMuni = 0.9404. Coelho Junior, Burgos and Santos Junior (2018) point out that the Entropy Index for firewood production displayed similar behaviors between municipalities and microregions of the state of Paraíba, showing low concentration.
Figure 6 shows that regional inequality in the number of ceramic industries remained practically stable for municipalities and microregions. In the period from 2006 to 2020, the inequality between ceramics was 0.6314 for municipalities and 0.6046 for microregions, which characterized the regional levels as weak to medium inequality. For the meso-regional level, inequality was classified as null to weak, with an average of 0.2271. According to Silva, Mexas and Quelhas (2015), the number of ceramic companies in a given location directly influences the environmental quality of the region. Where a high number of ceramic companies are concentrated, the environmental quality index for regions and these areas were classified as having a high level of atmospheric pollution, environmental degradation and modification of the natural landscape. Ceramic companies are mostly concentrated in the Seridó region, also recognized as the area with the highest desertification rate in the territory, which is justified by the greater production of firewood in the area, causing adverse situations in environmental terms. This activity expanded inordinately, as did the demand for firewood.
Figure 6 -Evolution of the Gini index for red ceramic companies for the municipalities, microregions and mesoregions of Paraíba, from 2006 to 2020.
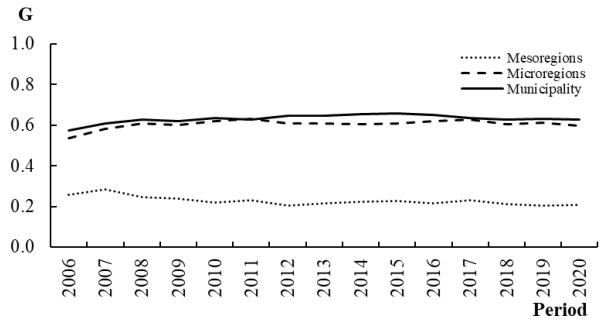
Figure 6
Evolution of the Gini index for red ceramic companies for the municipalities microregions and mesoregions of Paraíba from 2006 to 2020
Source: Research data (2022).
4 Conclusion
Ceramic companies are part of the economy of all the mesoregions of the state of Paraíba. Borborema and Agreste were the mesoregions where the largest quantities of red ceramic companies in the state of Paraíba were found, which was related to the production of firewood and the availability of clay to produce goods. The most representative municipalities in terms of quantity quartiles of ceramic companies were Guarabira, Santa Rita, Mulungu, Rio Tinto and the microregions were Litoral Norte, Cariri Ocidental, Seridó Ocidental, Seridó Oriental and Guarabira. Thus, like the meso-regional level, the zones with more resources had a greater number of developments.
The municipalities of Santa Rita, Rio Tinto, Mulungu and Guarabira were the ones that most represented the CR(4)Munic. over the years studied. The degree of concentration of red ceramic companies for the CR(4)Munic. ranged from 21.9% to 36.6%, which indicates a moderately low degree of concentration. The microregions of Guarabira, Seridó Oriental, Seridó Ocidental and Cariri Ocidental contributed to compose the CR(4)Micro. For the evaluation of the four largest microregions, the CR(4)Micro ranged from 50% to 70% and indicated a moderately high degree of concentration.
The CR(8)Munic ranged from 40% to 60% over the years under study, indicating a moderately high degree of concentration. At the microregion level, the CR(8)Micro ranged from 80% to 100% with very high concentration in the microregions of Guarabira, Seridó Oriental, Seridó Ocidental, Cariri Ocidental, Litoral Norte, João Pessoa, Sousa and Itaporanga. CR(20)Munic showed a very high concentration. The CR(30)Munic showed a very high concentration level of ceramic companies in the years 2006, 2007, 2008 and 2009, and showed a reduction after the year 2010.
Between 2006 and 2020, deconcentration was observed at all levels evaluated. It was inferred that EMunic, EMicro and EMeso remained stable at low concentration levels. The Gini index for the municipalities and microregions remained with approximate values and were classified with a very strong level of inequality. The Gini Index for the mesoregions presented a concentration that varied from weak to medium.
Thus, this paper concludes that the ceramic sector in Paraíba is not concentrated and that the supply is associated with raw material stocks and the energy vector of firewood. The results guide the development of the sector, collaborating with sustainable economic growth, based on the responsible management of raw material stocks and firewood resources. Future studies can assess the availability of forests for sustainable firewood production, indicating areas for the installation of new ceramic industries.
References
ABRAHÃO, R.; CARVALHO, M. Environmental impacts of the red ceramics industry in Northeast Brazil. Int. J. Emerg. Res. Manag. Technol, v. 6, p. 310-317, 2017.
ALY, M.; HASHMI, M. S. J.; OLABI, A. G.; MESSEIRY, M.; ABADIR, E. F.; HUSSAIN, A. I. Effect of colloidal nano-silica on the mechanical and physical behaviour of waste-glass cement mortar. Materials & Design, v. 33, p. 127-135, 2012.
ASSOCIAÇÃO NACIONAL DA INDUSTRIA CERÂMICA - ANICER. Relatório Anual 2015. Disponível em: https://www.anicer.com.br/relatorio-anual/. Acesso em: 08 mai. 2022.
BAIN, J. Industrial Organization. New York: J. Wiley, 274 p. 1959.
COELHO JUNIOR, L. M.; MARTINS, K. L. C.; SILVA, M. V. B.; PINTO, P. A. L. A. Spatial distribution of firewood production in northeastern Brazil (1994-2013). Revista Árvore, v. 42, p. e420402, 2018.
COELHO JUNIOR, L. M., REZENDE, J. L. P; OLIVEIRA, A. D. Concentração das exportações mundiais de produtos florestais. Ciência Florestal, Santa Maria, v. 23, n. 4, p. 691- 701. 2013.
COELHO JUNIOR, L. M.; BURGOS, M. C.; SANTOS JÚNIOR, E. P. Concentração regional da produção de lenha da Paraíba. Ciência Florestal, v. 28, n. 4, p. 1729 – 1740, 2018.
COELHO JUNIOR, L. M. SANTOS JÚNIOR, E. P.; NUNES, A. M. M.; De SOUZA, Á. N.; BORGES, L. A. C.; SIMIONI, F. J. Concentration and clusters of black liquor thermoelectric plants in Brazil. IEEE Latin America Transactions, v. 19, n. 12, p. 2122-2129, 2021.
COELHO JUNIOR, L. M.; BURGOS, J. V. C.; SANTOS JUNIOR, E. P.; NUNES, A. M. M.; JOAQUIM, M. S.; SOUZA, A. N.; BORGES, L. A. C. Regional concentration of native firewood production in Rio Grande do Norte - Brazil. Ciência Rural, v. 52, p. e20200357, 2022.
DAWSON, R. How Significant is a Boxplot Outlier?. J. Stat. Educ., v. 19, n. 2, 2011. doi:10.1080/10691898.2011.11889610.
DEL RIO, D. D. FURSZYFER et al. Decarbonizing the ceramics industry: A systematic and critical review of policy options, developments and sociotechnical systems. Renewable and Sustainable Energy Reviews, v. 157, p. 112081, 2022.
FELIPE, J. L. A. Economia Rio Grande do Norte: estudo geo-histórico e econômico. João Pessoa-PB: Grafset, 2002.
GIUDICE, A. L.; INGRAO, C.; CLASADONTE, M. T.; TRICASE, C.; MBOHWA, C. Life cycle assessment for highlighting environmental hotspots in the Sicilian traditional ceramic sector: the case of ornamental ceramic plates. Journal of Cleaner Production, v. 142, p. 225-239, 2017.
HEIN, A.; KILIKOGLOU, V. Modeling of the microstructure of ancient functional ceramics and assessment of their performance. Procedia Structural Integrity, v. 10, p. 219-226, 2018.
HIRSCHMAN, A. O. The paternity of an index. The American Economic Review, v. 54, n. 5, p 761-762, 1964.
IBGE - Instituto Brasileiro de Geografia e Estatística. Malhas digitais. Disponível em: http://mapas.ibge.gov.br/pt/bases-e-referenciais/bases-cartograficas/malhas-digitais. Acesso em: 10 fev. 2018.
IBGE. INSTITUTO BRASILEIRO DE GEOGRAFICA E ESTATÍSTICA. PAIC - Pesquisa Anual da Indústria da Construção. Disponível em: https://www.ibge.gov.br/estatisticas/economicas/industria/9018-pesquisa-anual-da-industriada-construcao.html. Acesso em: 09 de maio 2022.
IBGE. Produção da extração vegetal e silvicultura 2022. Rio de Janeiro: IBGE, 2022. Disponível em: http://www.florestal.gov.br/snif/images/stories/ProducaoFlorestal/Extracao/analise_ibge_pevs%202015.pdf. Acesso em: 04 maio 2022.
MARTINS, K. L. C.; MELQUIADES, T. F.; REZENDE, J. L. P.; COELHO JUNIOR, L. M. Plant Extractivism Production Disparity Between Northeast Brazil and Brazil. Floresta e Ambiente, v. 25, p. 1 – 9, 2018.
MENEZES, R. R.; NEVES, G. A.; FERREIRA, H. C. Mapeamento de argilas do Estado da Paraíba. Cerâmica, v. 47, p. 77-81, 2001.
NATHANIEL, S. P. Environmental degradation in ASEAN: assessing the criticality of natural resources abundance, economic growth and human capital. Environmental Science and Pollution Research, v. 28, n. 17, p. 21766-21778, 2021.
PEREIRA, I. D. S.; SILVA, I. A.; CARTAXO, J. M.; MENEZES, R. R.; SANTANA, L. N. L.; NEVES, G. A.; FERREIRA, H. C. Estudos de caracterização dos novos depósitos de argilas esmectíticas do município de Sossego, PB. Cerâmica, v. 60, n. 354, p. 223-230, 2014.
POSSAS, M. L. Estruturas de Mercado em Oligopólio: economia e planejamento. 2ª ed. São Paulo: Hucitec, 1999. 191 p.
RAIS - Relação Anual de Informações Sociais. Manual de Orientação da Relação Anual de Informações Sociais (RAIS): ano base 2017. Brasília: MTb, SPPE, DER, CGCIPE, 2017. 49 p.
RAIS - Relação Anual de Informações Sociais. Dados do sistema. Disponível em: https://bi.mte.gov.br/bgcaged/caged_rais_estabelecimento_id/caged_rais_estabelecimento_basico_tab.php. Acesso em: 01 mai. 2022
RESENDE, M. Medidas de concentração industrial: uma resenha. Revista Análise Econômica, Porto Alegre, v. 12, n. 21, p. 24-33, 1994
RESENDE, M.; BOFF, H. Concentração Industrial. In: HASENCLEVER, L.; KUPFER, D. (Org.). Economia industrial: fundamentos teóricos e práticas no Brasil. Rio de Janeiro: Campus, p. 73-90, 2002.
ROCHA, F. Dinâmica da concentração de mercado na indústria brasileira,1996-2003. Economia e Sociedade, Campinas, SP, v. 19, n. 3, p. 477-498, 2010.
SELVATTI, T.S.; BORGES, L. A. C.; SOARES, H. C. C.; SOUZA, Á. N. D.; COELHO JUNIOR, L. M. Global production concentration of medium density fiberboard (MDF) (1995-2016). Rev. Árvore., v. 42, n. 5, p. e420506, 2018.
SINDICER - Sindicato da Indústria de Cerâmica Vermelha. Setor cerâmico. Disponível em: http://www.sindicerpb.com.br/setorceramico. Acesso em 24 abr. 2022.
SILVA, A. C.; MEXAS, M. P.; QUELHAS, O. L. G. Restrictive factors in implementation of clean technologies in red ceramic industries. Journal of Cleaner Production, v. 168, p. 441 – 451, 2017.
SIMIONI, F. J.; MOREIRA, J M. M. A. P.; FACHINELLO, A. L.; BUSCHINELLI, C. C. A.; MATSUURA, M. I. S. F. Evolução e concentração da produção de lenha e carvão vegetal da silvicultura no Brasil. Ciência Florestal, v. 27, n. 2, p. 731-742, 2017.
THEIL, H. Economics and information theory. North-Holland, Amsterdam, Netherlands, 1967, 488 p.
YADAV, S. K.; SINGH, S.; GUPTA, R. Measures of Location. In: Biomedical Statistics. Springer, Singapore, 2019. p. 53-58.