Artigos
A multidimensional analysis of rural development in Brazilian MATOPIBA
A multidimensional analysis of rural development in Brazilian MATOPIBA
Gestão & Regionalidade, vol. 39, e20237963, 2023
Universidade Municipal de São Caetano do Sul
Recepción: 15 Octubre 2021
Aprobación: 30 Junio 2022
Abstract: In view of the Brazilian agricultural industry in generating jobs, income and foreign exchange, a potential study on rural development in the Cerrado of Maranhão, Tocantins, Piauí and Bahia (MATOPIBA) is pertinent. Thus, this study aims to identify which set of variables better differentiate the groups of municipalities in MATOPIBA, in relation to rural development. Specifically, it is intended to analyze the determining factors of rural development; group the municipalities according to level of rural development and classify these municipalities into defined strata. To meet the proposed objectives, factor analysis techniques, clusters and discriminant analysis were used. The results revealed an expressive heterogeneity in rural development, with a minority portion of the municipalities that obtained an expressive factorial score in the dimension referring to agricultural sustainability. Among the set of variables studied, those allocated to the factor called knowledge intensive are the ones that best differentiate the groups.
Keywords: rural development, multivariate statistical analysis, municipalities of MATOPIBA.
Resumo: Em face da relevância do setor agrícola brasileiro na geração de empregos, renda e divisas, faz-se pertinente um estudo potencial sobre o desenvolvimento rural nos cerrados do Maranhão, Tocantins, Piauí e Bahia (MATOPIBA). Assim, este estudo se propõe identificar qual conjunto de variáveis melhor diferenciam os grupos de municípios do MATOPIBA em relação ao desenvolvimento rural. Especificamente, pretende-se analisar os fatores determinantes do desenvolvimento rural; agrupar os municípios, segundo nível de desenvolvimento rural e classificar esses municípios em estratos previamente definidos. Para cumprir os objetivos propostos foram utilizadas as técnicas de análise fatorial, clusters e análise de discriminante. Os resultados revelaram uma expressiva heterogeneidade no desenvolvimento rural, com parcela minoritária de municípios que obtiveram escore fatorial expressivo na dimensão referente à sustentabilidade agrícola. Dentre o conjunto de variáveis consideradas, as alocadas no fator denominado intensivo de conhecimento são as que melhor diferenciam os grupos.
Palavras-chave: desenvolvimento rural, análise estatística multivariada, municípios do MATOPIBA.
INTRODUCTION
The actions of the II National Development Plan (II PND) in the 1970s guided the attenuation of regional inequalities, promoting the relative deconcentration of economic activity in the South/Southeast towards the national periphery (North and Northeast), as highlighted by Lima Junior (2014). Due to the above, from 1980 onwards, “islands of prosperity” can be seen in peripheral areas of the country (PACHECO, 1998). This scenario, guided by productive restructuring, exacerbated the combination of use of industrialized chemical inputs, machinery for production and cultural treatments, towards the cerrados of the Midwest and Northeast of Brazil (CANO, 2011).
In this sense, the favorable performance of commodities in the first decade of the 21st century boosted the expansion and later incorporation of the Brazilian agricultural frontier, which comprises the cerrados of Maranhão, Tocantins, Piauí and Bahia (MATOPIBA). Due to the above, these areas significantly encompass the production of grains, from the perspective of competitive advantages, such as mild relief, favorable climate, water availability, in addition to agricultural machinery and implements (EMBRAPA, 2020; PEREIRA; CASTRO; PORCIONATO, 2018).
Data from the General Register of Employed and Unemployed (CAGED, 2020) for 2017 show that the macro-regions of the South, Southeast and Midwest of Brazil obtained, respectively, a cumulative number of jobs, in absolute terms, of -44, +450 and +3,595, concerning the cultivation of soy, corn and herbaceous cotton. In this respect, the MATOPIBA Region generated 1,448 formal job vacancies, only behind the Brazilian Midwest. Nevertheless, in 2010, the national average of the Municipal Human Development Index (IDHM) registered 0.73, against 0.64 in MATOPIBA (UNITED NATIONS PROGRAM FOR DEVELOPMENT, 2021).
The vision of rural development is only associated with the perception of agricultural development due to the fact that the propositions of the model adopted have strongly increased agricultural production, but they do not systematically solve the bottlenecks in rural areas nor generate a standard of living that meets the needs of the who live in the countryside (MATTEI, 2013; FEIJÓ, 2011). Under this framework, Pinto and Coronel (2016) and Moura and Sousa (2020) complement these considerations, stating that rural development is strongly associated with the living conditions of the human contingent allocated in rural areas.
Considering the relevance of this geographic area, a series of recent studies aimed at MATOPIBA have been developed (RIBEIRO et al., 2020; BUAINAIN; GARCIA; VIEIRA FILHO, 2018; BRAGANÇA, 2018; VIEIRA; FISHLOW, 2017), among others. However, It was detected the absence of studies with an emphasis on rural development in these areas in light of a multidimensional approach, being relevant a potential study in this regard, considering that, according to the IBGE (2020b), this spatial cut comprises 77,10 %, 39.19% and 28.78%, respectively, of jobs in the agricultural sector, in relation to the Southeast, South and Center-West macro-regions, in addition to covering 6.86% of the Brazilian rural population (DATASUS, 2020).
In fact, It is worth noting that the main contribution of this article in relation to economic literature refers to the geographic scope, in addition to the approach to rural development based empirically, in a majority manner, on the 2017 Agricultural Census, the most recent database and complete concerning Brazilian agricultural studies.Given this context, this work is based on the following questions: Which set of variables best differentiates the groups of municipalities in the Brazilian MATOPIBA in relation to rural development? What are the determining factors for rural development in MATOPIBA?
In view of these considerations, the main objective of this article is to identify which set of variables best differentiate the groups of municipalities in MATOPIBA, in relation to rural development. Specifically, It is intended to analyze the determining factors of rural development in MATOPIBA; group these municipalities, according to the level of rural development; and classify these municipalities into previously defined strata. Under such a proposition, these analyzes are of importance, as they are essential for public planning and the elaboration of public policy measures aimed at the population that is on the margins of rural development.
In addition to this introduction, the second section presents the national empirical studies carried out on this topic. In the third, the area of study, database and variables considered, and the empirical strategies adopted are described. In the fourth, the results and discussion are presented. Finally, the final considerations are shown.
LITERATURE REVIEW
Rural development: theoretical evidence and empirical applications
The debate over the definition of development is practically inexhaustible. Multiple factors contribute to the development process of rural areas, highlighting greater access to education, with the aim of raising income and reducing poverty; the diversification of agriculture, providing greater development in rural areas; in addition to the set of well-founded institutions, allowing for an appreciation of the territory (VEIGA, 2002).
In this sense, development cannot be treated only by the economic dimension, due to its multiple dimensions addressed, including socioeconomic, technological, distributive transformations, etc (KAGEYAMA, 2008). In light of the lessons of Kageyama (2008), there is a relative consensus in the literature that rural development includes multiple determining factors, classifying itself as a multidimensional phenomenon. In this aspect, rural development is seen as a process that involves the following dimensions: economic, social, demographic and environmental and not just as a process of economic growth measured solely by product or income (GRISA; SCHNEIDER, 2015).
Rural development can also be understood as a process of multiple actions articulated with the objective of providing social, economic, institutional and environmental changes in rural areas to improve aspects of the rural population, such as income, quality of life and well-being social (NAVARRO, 2001). Furthermore, It can be seen as a combination of external and internal forces in which both rural actors and the region's local and external networks are involved (KAGEYAMA, 2004).
In view of these considerations, the economic literature referring to rural development demonstrates that the authors address this issue in multiple geographic areas. Among these, the works at regional levels stand out, Polastrini, Martins and Tredezini (2015) centering the discussion on the Northeast and Midwest regions. In the case of the mesoregions, Fortini, Silveira and Moreira (2016) and Bittencourt and Lima (2014) work with a sample of the Minas Gerais mesoregions, while Pinto and Coronel (2016) analyze all the mesoregions of Rio Grande do Sul. In terms of municipalities, notably in the Center-South, there are studies by Santos, Ferreira and Salgado (2017) for Minas Gerais; Begnini and Almeida (2016) for Santa Catarina. Regarding the Northeast, the study by Moura and Sousa (2020) considers a sample of municipalities in Ceará and Pernambuco.
Polastrini, Martins and Tredezini (2015) analyzed the Rural Development Index (RDI) of the Food Security and Local Development Consortia (CONSAD) in the Midwest and Northeast regions. The results showed that, of the 12 CONSADS analyzed in the Northeast Region, only two are in the high category, that of Itaparica do Pernambuco, which obtained the highest household income, and Sertão do São Francisco in Sergipe, which stood out due to the proportion of rural households with water access infrastructure. Only one CONSAD is in the middle category, which is Baturité in Ceará, which had the best average years of schooling in the proportion of children aged 7 to 14 years in school, while the others are in the low category.For the Midwest region, of the five CONSADS studied, three belonging to the state of Mato Grosso do Sul are classified in the medium category, and the rest are identified as high.
For the North and Jequitinhonha mesoregions in the state of Minas Gerais, Fortini, Silveira and Moreira (2016) revealed disparities in the conditions in which rural development is found in the studied mesoregions, with socioeconomic and climatic conditions, in addition to the permanence of an agricultural model of subsistence production, interfered in the rural development of the mesoregions.
Bittencourt and Lima (2014) found through factor analysis that 53.03% of the municipalities are in a situation of low level of rural development, converging with the conceptions of Kageyama (2004) who stated that the process of agricultural modernization in the molds of productive restructuring it achieved high productivity in the agricultural sector, but it was not accompanied by an improvement in the standard of living of the rural population.
For the mesoregions of Rio Grande do Sul, Pinto and Coronel (2016) measured rural development in the years 2000 and 2010. From this study, they realized that there are divergent patterns of rural development within the territory of Rio Grande do Sul. The mesoregions that obtained the highest averages in the level of rural development were the Northeast, Northwest and Center-Eastern regions, in which they stood out in factors related to housing conditions and rural education at the basic level. In contrast, the West, Southeast, Southwest and Metropolitan had the lowest indicators.
In municipal terms, Santos, Ferreira and Salgado (2017) investigated the main determinants of rural development in the municipalities of Minas Gerais. The results reinforce the importance of social factors, sectorial public investment, political-demographic aspects, public policies for family farming, agricultural and environmental conditions. Of the total of 853 municipalities, 31.30% are in very favorable or favorable rural development situations, while 68.70% of the municipalities were grouped in the very unfavorable and unfavorable classes in relation to this typology.
Begnini and Almeida (2016) assessed the rural development of the 293 municipalities in Santa Catarina for the year 2010. The main determinants for rural development were the use of electricity, irrigation techniques and rural education.
From this perspective, Moura and Sousa (2020) found that the determinants of rural development in the municipalities of Ceará and Pernambuco refer to the dimensions: socioeconomic, demographic and environmental. Nevertheless, they found that the rural population is a strategic variable for the study of this multidimensional phenomenon.
As observed in the literature review, although there is a broad discussion about rural development in Brazil, empirical studies of this nature were not found in the municipalities of MATOPIBA, in addition to not looking into the techniques of factor analysis, cluster and discriminant, together, nor did they mostly use the 2017 Agricultural Census. Therefore, this work contributes to the literature, by providing a potential study in this regard, with the adoption of three multivariate analytical methods, bold in a relatively recent database.
METHODOLOGY
This section is intended to describe the methodology applied in this work. Therefore, the database and variables are presented, in addition to the explanation of the empirical strategies adopted.
Database and description of variables
Assuming that rural development has a multidimensional character, variables1 were selected that contemplate the dimensions inherent to the intensive use of knowledge in the agricultural environment, intensive use of capital and labor, in addition to the intensive use of agricultural sustainability (Frame 1).
In this sense, Frame 1 shows the variables weighted by the municipal rural population, based on the propositions of Kageyama (2004), who consider rural development associated with population dynamism, since an increase in the population contingent increases capacity of the rural area in retaining the population. However, the variables may consider extreme values, as they are averages, constituting a possible limitation. Furthermore, these variables act as proxies for measuring rural development.
| V1 | Number of agricultural establishments using electricity per capita | 2017 IBGE Agricultural Census | Bittencourt and Lima (2014) | |
| V2 | Number of agricultural establishments that acquired technical guidance per capita | 2017 IBGE Agricultural Census | Santos, Ferreira and Salgado (2017) | |
| V3 | Number of agricultural establishments with water resources per capita | 2017 IBGE Agricultural Census | Rodrigues et al. (2018) | |
| V4 | Number of machines, tractors and agricultural implements in agricultural establishments per capita | 2017 IBGE Agricultural Census | Begnini and Almeida (2016); Alves (2012) | |
| V5 | Number of agricultural establishments using crop rotation per capita | 2017 IBGE Agricultural Census | Kageyama (2004) | |
| V6 | Number of agricultural establishments using limestone and/or other soil pH correctors per capita | 2017 IBGE Agricultural Census | Polastrini, Martins and Tredezini (2015) | |
| V7 | Number of agricultural establishments using soil preparation per capita | 2017 IBGE Agricultural Census | Moura andSousa (2020);Pinto and Coronel (2016) | |
| V8 | Number of agricultural establishments that contracted financing per capita | 2017 IBGE Agricultural Census | Pinto and Coronel (2016); Stege (2011) | |
| V9 | Expenditure on animal and vegetable inputs in agricultural establishments per capita | 2017 IBGE Agricultural Census | Santos, Ferreira and Salgado (2017) | |
| V10 | Number of agricultural establishments in which the producer has completed high school per capita | 2017 IBGE Agricultural Census | Bittencourt and Lima (2014) | |
| V11 | Number of formal employment relationships on 12/31/2017 per capita | Annual Social Information List (RAIS) | Moura and Sousa (2020); Stege (2011) | |
| V12 | Nominal salary of formal agricultural links on 12/31/2017 per capita | Annual Social Information List (RAIS) | Stege (2011) |
Empirical strategies
Identification of determinants of rural development in MATOPIBA
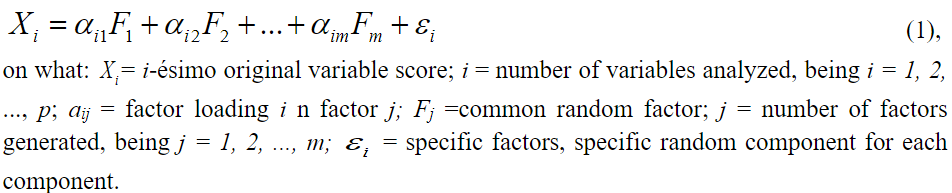
To fulfill the first specific objective of this work, which is to identify the determining factors of rural development in the municipalities of MATOPIBA, the multivariate statistical technique of exploratory factor analysis in principal components was used. According to Fávero et al. (2009), this instrument consists of synthesizing the relationships between variables based on common factors, that is, reducing a large number of variables into factors, thus facilitating the interpretation of data. Thus, the factor analysis model can be expressed algebraically:
To use the multivariate technique of factor analysis, according to Fávero et al. (2009), it needs to be available. The main procedures used to verify the adequacy of this technique refer to three tests.
i)Analysis of the correlation matrix: the relationship between the variables will be confirmed based on the significance level of the estimated coefficients (p-value -0.05). The analysis will start with an examination of the correlation matrix to verify the existence of significant values that justify the use of the technique.ii)Bartlett's Sphericity Test: this procedure tests whether the correlation matrix is an identity matrix with determinant equal to 01. If this hypothesis is not rejected, factor analysis cannot be used.iii)Kaiser-Meyer-Olkin (KMO): his technique serves to compare the magnitudes of the observed correlation coefficients with the magnitudes of the partial correlation coefficients. Therefore, it represents a measure of homogeneity of the variables, which compares the partial correlations observed between the variables.
Also according to Fávero et al. (2009), regarding the classification, the lower the KMO value, the weaker the relationship between the variables and the factors will be, and the index may vary from less than (0.5), which characterizes the use as unacceptable. from factor,analysis, up to (1.0), signaling that the data are subject to the use of the technique.
The number of factors considered was based on the latent root criterion. For Fávero et al. (2009), this criterion shows that the number of factors considered is a function of characteristic roots that exceed unity, and these eigenvalues greater than one reveal the explained variance of each factor.
For factor rotation, the Varimax method was used, which aims to maximize the variation between the weights of each main component, maintaining the orthogonality between them.After orthogonal rotation, the factor coefficient matrix was calculated, obtained from the product of the transposed matrix of factor loadings with the inverse of the simple correlation matrix between the variables used in the study (CARVALHO, 2013).
Grouping of municipalities with similar characteristics in MATOPIBA
After applying the factor analysis and possessing the extracted factors, the cluster analysis was applied. This framework designates the fulfillment of the second specific objective.
Regarding this analytical method, Hair Junior et al. (2005) point out that this is a statistical technique of interdependence that allows allocating objects or variables into homogeneous groups depending on the degree of similarity between individuals, based on predetermined variables.
This analysis aims to divide the elements of the sample, or population, into groups so that the elements belonging to the same group are similar with respect to the variables that were measured in them, and the elements in different groups are heterogeneous in relation to these same characteristics (HÄRDLE; SIMAR, 2015; MINGOTI, 2005).
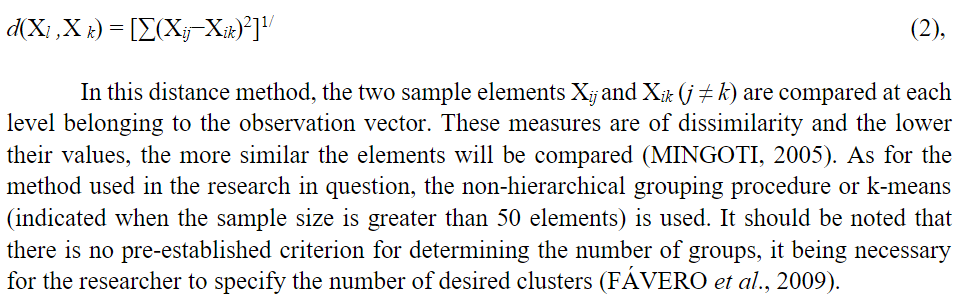
In this study, the Euclidean squared distance was used, whose distance between two observations (j and k) is equivalent to the sum of the squares of the differences between j and k for all variables. Formally in equation (2):
Identification of the variables that best discriminate the groups of municipalities in MATOPIBA
To meet the third specific objective, which is to classify these municipalities into previously defined strata, the Discriminant Analysis will be used. This method is extensively used to differentiate which variables better differentiate the groups of a given phenomenon studied, for that, the simultaneous procedure will be used. With the selection of discriminant (explanatory) variables for the formation of groups, the discriminant functions are identified (MINGOTI, 2005).
The advantage of this analytical instrument is that it is less affected by covariance inequalities and more robust when the assumption of normality of the variables is not met (HAIR JÚNIOR et al., 2005).
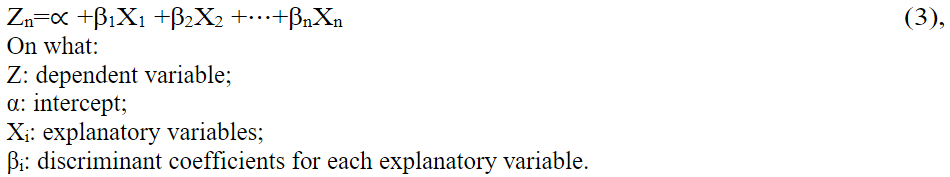
This technique is similar to regression analysis in terms of objectives and characteristics and, in this way, its general function can be represented by means of the following linear equation (3):
In the understanding of Hair Junioret al. (2005), It is essential to define the correct sample size to be studied, since this technique is very sensitive to the proportion of sample size in relation to the number of predictor variables. Therefore, there should not be a great variability of dimensions between groups. For this study, the dependent variable is composed of three groups (defined by cluster analysis). To assess the adequacy of the method, the assumption regarding the existence of homogeneity of the variance and covariance matrices must be evaluated.
This assumption is verified using Box's M statistic (Box's M), which allows evaluating one of the assumptions of the discriminant analysis, which is the homogeneity of the covariance matrices, in each of the groups, for each of the study variables. If, when performing the test, its p- value (sig.) is greater than the significance level, then the equality of the matrices is supported, if It is smaller the assumption is violated. Therefore, the objective is not to reject the hypothesis that the matrices are homogeneous. This test mentioned above can be sensitive to the sample size and the non-compliance with the hypothesis of multivariate normal distribution.
Fortunately, discriminant analysis is a technique that is quite robust to violating these assumptions, provided that the group size is greater than the number of variables under study and that the means of the groups are not proportional to their variances, that is, if the homogeneity of the matrices is violated, there will be an increase in the probability of classifying observations in the group that has the greatest dispersion (NÓBREGA, 2010).The next hypothesis test is Wilk's Lambda, which, according to Maroco (2007), serves to test the significance of discriminant functions and is calculated from the determinant of the matrix of the sum of squares and crossed products within the groups; and the matrix determinant of the sum of squares and total cross products. The purpose of the test is not to accept the H0, as the means must be significantly different to better discriminate the groups. For the operationalization of factor analysis, clusters and discriminant, the Statistical Package for Social Sience software (SPSS 20.0) was used.
RESULTS AND DISCUSSION
The results of the article are shown and discussed in this section, being structured in three parts, in which the results concerning the identification of the determining factors of rural development exposed in the first part are shown; the grouping of municipalities and identification of the variables that best differentiate the groups, respectively, in the second and third part.
Identification of determinants of rural development
According to Frame 2, the application of the factor analysis method requires the variables to be correlated, that is, to accept the alternative hypothesis that the correlation matrix is not diagonal. This is confirmed by Bartlett's statistical test of sphericity, as its obtained value (3,875.76) was significant at 1% probability. The Kaiser-Meyer-Olkin (KMO) test has also been used to verify the suitability of this analytical tool. In this study, the value of 0.84 was found. There fore, the data are appropriate for the use of this method, considering that, according to Fávero et al.(2009), values above 0.5 corroborate the adequacy of the data.
| Checking the correlation matrix | Most correlations above 0.30 | High correlation coefficients are observed for most pairs of variables |
| Kaiser-Mayer-Olkin (KMO) | Acceptable above 0.50 | 0.84 |
| Bartlett's sphericity | The correlation matrix is not an identity matrix | The alternative hypothesis is accepted |
Table 1 shows the three determining factors of rural development after orthogonal rotation, with a characteristic root greater than one, according to the latent root criterion, which summarize the 12 variables analyzed. These factors explain 80.55% of the total variance in the data, with most of the variance (35.58%) being explained by the first factor.
| 1 | 4.27 | 35.56 | 35.56 |
| 2 | 3.56 | 27.99 | 63.55 |
| 3 | 2.04 | 16.97 | 80.55 |
The first factor (FC1), designated as knowledge intensive, is responsible for explaining 35.58% of the total variance of the data. This factor receives this name because it is constituted by the variables concerning the number of agricultural establishments in which the producer has completed high school per capita, number of agricultural establishments with water resources per capita, number of agricultural establishments that use electricity per capita, number of agricultural establishments that use limestone and/or other soil pH correctors per capita, number of agricultural establishments that contracted technical guidance per capita and number of agricultural establishments that contracted financing per capita, which are the most strongly associated with FC1. Whose factor loadings are highlighted in bold (Table 2).
As shown in Table 2, 27.99% of the total variance of the data is attributed to the second factor (FC2), called intensive in labor and capital, since it is positively associated with the variables related to the nominal average salary of formal agricultural links on 12/31/2017 per capita, number of formal employment links on 12/31/2017 per capita, expenditure on animal and vegetable inputs in agricultural establishments per capita and number of machines, tractors and agricultural implements in the establishments per capita agricultural. Finally, regarding the third factor (FC3), the variables related to the number of agricultural establishments that use crop rotation per capita and number of agricultural establishments that use soil preparation per capita stand out. From this perspective, this dimension refers to the intensive use of agricultural sustainability.
| V1 | 0,83 | 0,13 | 0,34 | 0,34 |
| V3 | 0,83 | 0,13 | 0,40 | 0,40 |
| V1 | 0,82 | 0,12 | 0,41 | 0,41 |
| V6 | 0,78 | 0,43 | 0,01 | 0,79 |
| V2 | 0,74 | 0,16 | -0,03 | 0,58 |
| V8 | 0,61 | 0,13 | 0,38 | 0,53 |
| V12 | 0,13 | 0,97 | 0,03 | 0,95 |
| V11 | 0,23 | 0,94 | 0,02 | 0,93 |
| V9 | 0,11 | 0,92 | 0,06 | 0,85 |
| V4 | -0,12 | 0,81 | 0,04 | 0,80 |
| V5 | 0,09 | -0,05 | 0,90 | 0,83 |
| V7 | 0,51 | -0,05 | 0,79 | 0,88 |
With regard to commonalities, it was found that the variables that presented the lowest percentage of explanation for the three factors were: number of agricultural establishments that contracted financing per capita (V8) and number of agricultural establishments that contracted technical guidance per capita (V2), with respectively, 0.53 and 0.58.
Grouping of MATOPIBA municipalities, using factor scores
Considering the grouping of municipalities in MATOPIBA through factor scores, which are linear combinations of the original variables, indicated by the factor analysis, we chose to apply the non-hierarchical k-means method. In this sense, three groups were chosen, as this configuration seemed more adequate to the analyzed data. These clusters with the respective municipalities are described in Table 4.
According to Rosado et al. (2005), although there is some difficulty in establishing a measure that characterizes the magnitude of issues related to regional/rural development, it is possible, based on the factor scores and clusters obtained, to differentiate between the groups formed in terms of intensity of development.
As can be seen in Table 3, the municipalities that make up cluster 1 had the worst results in the variables: number of agricultural establishments that use crop rotation per capita and number of agricultural establishments that use soil preparation per capita. On the other hand, this set of municipalities recorded the highest average in the set of variables that capture the intensive use of knowledge.
In view of these considerations, 78.36% of the municipalities in MATOPIBA are included in the aforementioned cluster, including the large soybean producers located in the west of Bahia, São Desidério, Luís Eduardo Magalhães and Barreiras. Furthermore, data from RAIS (2020) show that the municipalities in cluster 1 were responsible for 67.86% of formal employment relationships in the agricultural sector of MATOPIBA, for the year 2017.
For cluster 2, which contains municipalities mostly allocated in the State of Tocantins, they present a higher average in the dimension related to the intensive use of labor and capital. Nevertheless, these municipalities registered the worst performances, in average terms, regarding the variables that capture agricultural sustainability.
| 1 | 239 | Açailândia, Afonso Cunha, Aldeias Altas, Porto Alegre do Maranhão, Alto Parnaíba, Amarante do Maranhão, Anapurus, Araioses, Arame, Bacabal, Balsas, Barão de Grajaú, Barra do Corda, Barreirinhas, Benedito Leite, Bernardo do Mearim, Bom Lugar, Brejo, Buriti, Buriti Bravo, Buritirana, Campestre do Maranhão, Cantanhede, Capinzal do Norte, Carolina, Caxias, Chapadinha, Cidelândia, Codó, Coelho Neto, Colinas, Coroatá, Davinópolis, Dom Pedro, Esperantinópolis, Estreito, Feira Nova do Maranhão, Fernando Falcão, Fortaleza dos Nogueiras, Fortuna, Gonçalves Dias, Governador Edison Lobão, Governador Eugênio Barros, Governador Luiz Rocha, Graça Aranha, Grajaú, Igarapé Grande, Imperatriz, Itapecuru Mirim, Itinga do Maranhão, Jatobá, Jenipapo dos Vieiras, João Lisboa, Joselândia, Lago do Junco, Lago Verde, Lagoa do Mato, Lago dos Rodrigues, Lajeado Novo, Lima Campos, Loreto, Magalhães de Almeida, Mata Roma, Matões, Matões do Norte, Milagres do Maranhão, Mirador, Miranda do Norte, Montes Altos, Nova Colinas, Nova Iorque, Olho d'Água das Cunhãs, Paraibano, Parnarama, Passagem Franca, Pastos Bons, Pedreiras, Peritoró, Pio XII, Pirapemas, Poção de Pedras, Porto Franco, Presidente Dutra, Riachão, Ribamar Fiquene, Sambaíba, Santa Filomena do Maranhão, Santa Quitéria do Maranhão, Santo Antônio dos Lopes, São Benedito do Rio Preto, São Bernardo, São Domingos do Azeitão, São Domingos do Maranhão, São Félix de Balsas, São Francisco do Brejão, São Francisco do Maranhão, São João do Paraíso, São João do Soter, São João dos Patos, São José dos Basílios, São Luiz Gonzaga do Maranhão, São Mateus do Maranhão, São Pedro da Água Branca, São Pedro dos Crentes, São Raimundo das Mangabeiras, São Roberto, Sabutinha, Senador Alexandre Costa, Senador La Rocque, Sítio Novo, Sucupira do Norte, Sucupira do Riachão, Tasso Fragoso, Timbiras, Timon, Trizidela do Vale, Tuntum, Tutóia, Urbano Santos, Vargem Grande, Vila Nova dos Martírios, Aguiarnópolis, Angico, Aragominas, Araguacema, Araguaína, Araguanã, Araguatins, Arraias, Augustinópolis, Aurora do Tocantins, Axixá do Tocantins, Babaçulândia, Barra do Ouro, Brasilândia do Tocantins, Buriti do Tocantins, Campos Lindos, Carmolândia, Caseara, Centenário, Darcinópolis, Dianópolis, Esperantina, Filadélfia, Fortaleza do Tabocão, Goiatins, Itacajá, Itaguatins, Lagoa da Confusão, Lavandeira, Lizarda, Mateiros, Maurilândia do Tocantins, Monte do Carmo, Monte Santo do Tocantins, Palmeiras do Tocantins, Muricilândia, Natividade, Nova Olinda, Nova Rosalândia, Novo Alegre, Palmeirante, Paranã, Peixe, Piraquê, Ponte Altado Bom Jesus, Ponte Alta do Tocantins, Praia Norte, Recursolândia, Riachinho, Rio da Conceição, Rio Sono, Santa Fé do Araguaia, São Bento do Tocantins, São Miguel do Tocantins, São Salvador do Tocantins, São Sebastião do Tocantins, Sítio Novo do Tocantins, Taguatinga, Taipas do Tocantins, Tocantínia, Tocantinópolis, Wanderlândia, Alvorada do Gurguéia, Antônio Almeida, Avelino Lopes, Baixa Grande do Ribeiro, Bertolínia, Bom Jesus, Colônia do Gurguéia, Corrente, Cristalândia do Piauí, Cristino Castro, Curimatá, Currais, Gilbués, Júlio Borges, Manoel Emídio, Monte Alegre do Piauí, Palmeira do Piauí, Parnaguá, Redenção do Gurguéia, Riacho Frio, Ribeiro Gonçalves, Santa Filomena, Santa Luz, São Gonçalo do Gurguéia, Sebastião Barros, Sebastião Leal, Uruçuí, Angical, Baianópolis, Barreiras, Bom Jesus da Lapa, Brejolândia, Canápolis,Carinhanha, Catolândia, Cocos, Coribe, Correntina, Cotegipe, Cristópolis, Feira da Mata, Formosa do Rio Preto, Jaborandi, Luís Eduardo Magalhães, Mansidão, Paratinga, Riachão das Neves, Santa Maria da Vitória, Santa Rita de Cássia, Santana, São Desidério, Serra do Ramalho, Serra Dourada, Sítio do Mato, Tabocas do Brejo Velho, Wanderley. |
| 2 | 62 | Abreulândia, Aliança do Tocantins, Almas, Alvorada, Aparecida do Rio Negro, Araguaçu, Arapoema, Barrolândia, Bernardo Sayão, Bom Jesus do Tocantins, Brejinho de Nazaré, Cachoeirinha, Cariri do Tocantins, Colinas do Tocantins, Combinado, Couto Magalhães, Cristalândia, Crixás do Tocantins, Divinópolis do Tocantins, Dois Irmãos do Tocantins, Dueré, Fátima, Figueirópolis, Formoso do Araguaia, Goianorte, Guaraí, Gurupi, Ipueiras, Itapiratins, Jaú do Tocantins, Lagoa do Tocantins, Lajeado, Luzinópolis, Marianópolis do Tocantins, Miracema do Tocantins, Miranorte, Novo Acordo, Novo Jardim, Palmeirópolis, Paraíso do Tocantins, Pau D'Arco, Pedro Afonso, Pequizeiro, Pium, Porto Nacional, Pugmil, Rio dos Bois, Sandolândia, Santa Maria do Tocantins, Santa Rita do Tocantins, Santa Rosa do Tocantins, Santa Tereza do Tocantins, São Valério, Silvanópolis, Sucupira, Talismã, Palmas, Tupirama, Tupiratins, Xambioá, Landri Sales, São Félix do Coribe. |
| 3 | 4 | Pindorama do Tocantins, Sampaio, Eliseu Martins, Marcos Parente. |
As shown in Table 3, the territorial division adopted in this work does not refer to political and administrative factors, notably associated with cities with geographic proximity. Due to the above, we sought to contemplate municipalities with similar characteristics concerning the level of knowledge in the agricultural environment, intensive use of labor and capital, in addition to sustainable agricultural practices. An example of this is cluster 1, which contains municipalities spatially dispersed in the cerrados of the North (Tocantins) and Northeast (Maranhão, Piauí and Bahia), but with relatively close rural development characteristics.
Identification of the variables that best discriminate the municipalities of MATOPIBA
In order to carry out a confirmatory study of the determinants of rural development and to identify which factor best differentiates the groups, standardized factor scores were used to apply the discriminant analysis by the simultaneous method, which considers the inclusion of all explanatory variables in the model.
From this perspective, the coefficients of the discriminant functions can be used as indicators of the discriminatory power of each factor, in accordance with Campos (2008). The strata considered were derived from the cluster analysis using the k means method, and for that, the number of pre-defined groups was in accordance with the number of specified clusters.
According to Maroco (2007), for the operationalization of the discriminant analysis, I t is necessary to evaluate the quality of the variables to differentiate the researched strata. Thus, we proceeded to test the equality of means of the variables between the groups, with the aim of rejecting the null hypothesis that the means of the variables in the groups are equal.
The test result was presented in Table 4, where the p-value of the variables was identified, with the first and third factor being statistically significant at 1% and the second factor at a significance level of 5%. This way, the null hypothesis of equality of means of the factors in the strata. Based on this condition, it is assumed that the selected factors differentiate municipalities in terms of rural development levels.
| F1 | 0,362 | 65,380 | 230 | 20 | 0,00 |
| F2 | 0,983 | 3,890 | 230 | 20 | 0,02 |
| F3 | 0,461 | 76,620 | 230 | 20 | 0,00 |
In this perspective, Factor 1, called intensive in knowledge, had the highest discriminatory power, evidenced by the lowest value of Wilk's Lambda, among the factors considered. This result is in line with Vieira and Fishlow (2017), who emphasize the relevance of knowledge in adding value to agriculture and stimulating rural development. This conception was corroborated by Serigati et al. (2017).
This factor receives this name because it is constituted by the variables concerning the number of agricultural establishments in which the producer has completed high school per capita, number of agricultural establishments with water resources per capita, number of agricultural establishments that use electricity per per capita, number of agricultural establishments that use limestone and/or other soil pH correctors, number of agricultural establishments that obtained technical advice per capita and number of agricultural establishments that contracted financing per capita. Furthermore, these variables include a greater portion of the data variance, represented by the first factor (See Table 1).
These variables are associated with the level of human capital. According to Arabsheinbani and Rees (1998), investments of this nature increase individuals' income, since the acquisition of education increases productivity. At the national level, aimed at the rural environment, Silva et al. (2017) confirm this evidence from the international literature.
The strength of this dimension to explain rural development finds a favorable scenario for reproduction in the Catholic Universities, Ulbra, ITPAC, Objective University and in the research institutes: Embrapa, Ibá and the Fapcen Support Foundation, located in the MATOPIBA region (VIEIRA; FISHLOW, 2017).
Regarding the second assumption for this analytical method, the Box M test was performed, which recommends that the variance and covariance matrices of the three strata considered are equal (FÁVERO et al., 2009).
Due to the above, Table 5 presents the results of the Box M test. In the operationalization, it found a violation of the homogeneity of the variance and covariance matrices. In this regard, Stevens (2002) considers that the discriminant analysis is robust in relation to the violation of the multivariate normality and the homogeneity of the covariance matrices. Nóbrega (2010) complements this consideration, stating that this assumption is extremely sensitive to the sample size, and that the rejection of the null hypothesis does not affect the allocation of observations in strata referring to the analyzed technique.
| 155,419 | 9,863 | 12 | 246,68 | 0,00 |
According to Table 6, it is relevant to mention that two discriminant functions were generated, as the dependent variable has three groups (k=3) and the number of estimated functions (k-1), obtaining a total of two groups . The first discriminant function presents a percentage of 61.9% [1.932 / (1.932+1.187)], that is, this function is the one that most contributes to demonstrate the differences between the groups.
Regarding the second function, it presents a discriminant power that explains 38.1% [1.187 / (1.187+1.932)] of the variance between groups. Furthermore, he realizes that the two functions considered gave rise to expressive canonical correlations, 0.81 and 0.74, respectively. In this sense, the square of these correspondents implies the explanatory power of the discriminant functions, constituting the values of 66.0% and 55.0%, in the proper order.
| 1 | 11,93 | 61,96 | 1,90 | 0,81 |
| 2 | 21,19 | 38,11 | 100,00 | 0,74 |
The next hypothesis test is Wilk’s Lambda, which according to Maroco (2007) serves to test the significance of discriminant functions.In this understanding, based on Table 7, the two functions considered are statistically significant at 1%. Thus, It can be concluded that the null hypothesis, that the population mean of the two groups are equal, is rejected.
| 1 to 2 | 0,16 | 559,24 | 6 | 0,00 |
| 2 | 0,46 | 235,48 | 2 | 0,00 |
Table 8 presents the non-standardized coefficients of the discriminant functions for each of the explanatory variables, explaining the relative importance of each factor in explaining the discriminant function.
| X1 | 11,81 | 0,04 |
| X2 | 2,74 | -1,10 |
| X3 | 0,36 | 16,64 |
| (Constant) | -4,67 | -2,38 |
Through Table 8, we can write each function as follows:Z1=− 4,67+ 11,81knowledge+ 2,74labor and capital+ 0,36agricultural sustainability;Z2= −2,38 + 0,04knowledge– 1,10 labor and capital+ 16,64agricultural sustainability.
Table 9 shows the validation of the results of the discriminant analysis, through the classification summary of the discriminant model. This result shows that 99.00% of the strata considered were classified by Fisher's discriminant function. Therefore, only threemunicipalities belonging to Factor 1 were wrongly allocated to Factor 2.
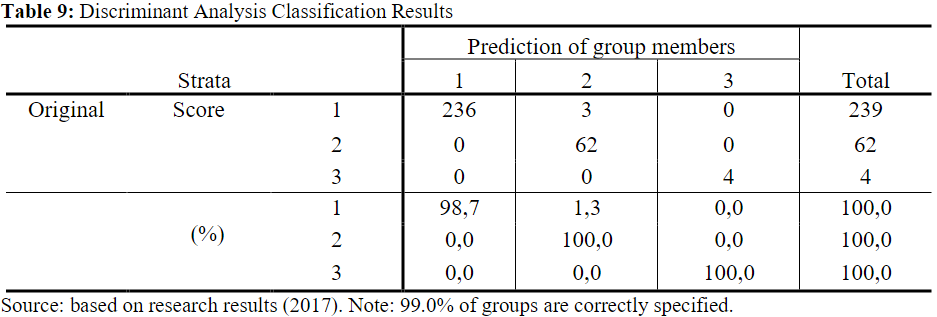
From the perspective of the outputs, It is noted that the suitability of the model regarding classification was satisfactory, as the municipalities of MATOPIBA are properly allocated in their respective strata. Such evidence corroborates the results of Santos and Lima (2010), for deforestation in the Legal Amazon, and also of Souza (2008), who sought to analyze the financial factors that differentiated groups of efficient and inefficient cooperatives. Due to the above, and based on the empirical framework, the cluster analysis is correctly specified.
FINAL CONSIDERATIONS
Based on the twelve explanatory variables considered in the study, it was possible to synthesize three factors, each showing itself more strongly correlated with a certain dimension consistent with the economic literature, which made it possible to name them according to the degree of correlation. Factor FC1 is associated with variables related to the intensive use of knowledge; FC2, in turn, is related to the intensive use of labor and capital; and FC3 is associated with agricultural sustainability.
The FC1 factor, called intensive use of knowledge, has greater discriminatory power among the factors considered. This factor includes the variables: number of agricultural establishments in which the producer has completed high school per capita, number of agricultural establishments with water resources per capita, number of agricultural establishments that use electricity per capita, number of agricultural establishments that use limestone and/or other soil pH correctors per capita, number of agricultural establishments that contracted technical advice per capita and number of agricultural establishments that contracted financing per capita. Furthermore, these variables include a greater portion of the data variance.
In this sense, this work contributes to the literature, referring to a geographical cut that was not analyzed from this multidimensional perspective, in addition to the rural development approach based empirically, mostly, in the 2017 Agricultural Census, the most recent and complete study concerning Brazilian agricultural and rural studies.
Due to the above, public policy measures are suggested to encourage agricultural activities, with an emphasis on variables related to agricultural sustainability: number of agricultural establishments that use crop rotation per capita and number of agricultural establishments that use soil preparation per capita, considering that only 1.31% of the municipalities achieved the highest factor scores in this dimension.
As a possible limitation of the study, it should be noted that this work was designed for the year 2017, limiting the analysis of the situation of rural development in MATOPIBA, without evaluating whether there was an evolution or cooling of the level of rural development in the areas observed in recent years. Thus, It is expected that, based on the data from the next Demographic Census, more precise information can be provided on this topic, including variables that better capture other dimensions, such as demographic, economic, social and health, without necessarily using proxies.
In summary, based on the results of this study, It is recommended for further work to compare MATOPIBA with other Brazilian cerrado areas covered by agricultural modernization. In addition to disaggregating agriculture into employer and family, considering the 2006 and 2017 Agricultural Censuses, in order to compare the level of rural development between agricultural typologies and census periods.
REFERENCES
ARABSHEIBANI, G. R. REES, H. On the weak vs version of the screening hypothesis: a re-examination of the P-test for the U.K. Economics of Education Review, v.17, n.2, p. 189-192,1998.
BEGNINI, S.; ALMEIDA, L. E. D. F. Desenvolvimento Rural no estado de Santa Catarina um estudo multidimensional. Gestão & Regionalidade (Online), v. 32, n. 94, p. 20-35, jan./abr. 2016.
BITTENCOURT, G.M.; LIMA, J. E. Perfil do Desenvolvimento Rural dos Municípios da Mesorregião do Triângulo Mineiro e Alto Paranaíba. Gestão & Regionalidade (Online), v. 30, p. 1-19, mai./ago. 2014.
BRAGANÇA, A. A . The causes and consequences of agricultural expansion in Matopiba. Revista Brasileira de Economia, v. 72, p. 161-185, 2018.
BUAINAIN, A. M; GARCIA, J. R .; VIEIRA FILHO, J. E. R. A economia agropecuária do Matopiba. Estudos Sociedade e Agricultura (UFRRJ), v. 26, p. 376-401, 2018.
CAGED – Cadastro Geral de Empregados e Desempregados. Disponível em: http://bi.mte.gov.br/bgcaged/rais.php. Acesso em: 09/07/2020.
CAMPOS, K. C. Produção localizada e inovação: o arranjo produtivo local de fruticultura irrigada na microrregião do Baixo Jaguaribe no Estado do Ceará. 2008. 167 f. Tese (Doutorado em Economia Aplicada) – Universidade Federal de Viçosa, Viçosa, 2008.
CANO, W. Ensaios sobre a crise urbana no Brasil. Campinas: Editora da UNICAMP, 2011.
CARVALHO, F. R. D. Análise fatorial. 2013. 61 p. Dissertação (Mestrado em Matemática) – Universidade de Coimbra, Coimbra, 2013.
DATASUS - DEPARTAMENTO DE INFORMÁTICA DO SUS. Disponível em: http://www2.datasus.gov.br/DATASUS/index.php?area=01. Acesso em: 06/12/2020.
EMBRAPA – Empresa Brasileira de Pesquisa Agropecuária. MATOPIBA. Disponível em: https://www.embrapa.br/tema-matopiba/sobre-o-tema. Acesso em: 12 /12/2020.
FÁVERO, L. P.; BELFIORE, P.; SILVA, F. L.; CHAN, B. L. Análise de dados: modelagem multivariada para tomada de decisões. Primeira edição. Rio de Janeiro. Elsevier, 2009.
FORTINI, R. M.; SILVEIRA, S. F. R.; MOREIRA, V. S. Construção e análise do Índice de Desenvolvimento Rural para as mesorregiões Norte e Jequitinhonha do Estado de Minas Gerais. Desenvolvimento Regional em Debate, v. 6, n. 1, p. 90-119, jan./jul. 2016.
GRISA, C.; SCHNEIDER, S. (Org.). Políticas públicas de desenvolvimento rural no Brasil. v.1. Porto Alegre: Editora da UFRGS, 2015. 624p. (Série estudos rurais).
HAIR JÚNIOR, J. F.; BLACK, W. C.; BABIN, B. J.; ANDERSON, R. E.; TATHAM, R. L. Análise multivariada de dados. 6.ed. Porto Alegre: Bookman, 2009.
HÄRDLE, W.; SIMAR, L. Applied multivariate statistical analysis. 4 edition. Springer-Verlag, Berlin, Heidelberg, 2015. 458p.
IBGE – INTITUTO BRASILEIRO DE GEOGRAFIA E ESTATÍSTICA. Pesquisa Agrícola Municipal. 2020a. Disponível em: www.ibge.gov.br. Acesso em: 21/12/2020.
IBGE – INTITUTO BRASILEIRO DE GEOGRAFIA E ESTATÍSTICA. Censo Agropecuário 2017. 2020b. Disponível em: www.ibge.gov.br. Acesso em: 02/12/2020.
KAGEYAMA, A. Desenvolvimento Rural: conceitos e aplicações ao caso brasileiro. Porto Alegre: Editora da UFRGS, 2008.
KAGEYAMA, A. Desenvolvimento rural: conceito e medida. Cadernos de Ciência & Tecnologia, v. 21, n. 3, p. 379-408, set./dez. 2004.
LIMA JÚNIOR, F. do O’. Estrutura produtiva e rede urbana no Estado do Ceará durante o período de 1980-2010. Campinas, SP, 264 p. Tese (Doutorado em Desenvolvimento Econômico) - Universidade Estadual de Campinas, 2014.
MAROCO, J. Análise Estatística com a utilização do SPSS. 3ª Ed. Silabo. Lisboa. 822 p, 2007.
MINGOTI, S. A. Análise de dados através de métodos de estatística multivariada: uma abordagem aplicada. Belo Horizonte: Editora da UFMG, 2005.
MOURA, E. J.; SOUSA, E. P. Análise multidimensional do desenvolvimento rural nos municípios cearenses e pernambucanos. Geosul (UFSC), v. 35, n.76, p. 706-730, 2020.
NAVARRO, Z. Desenvolvimento rural no Brasil: os limites do passado e os caminhos do future. Estudos Avançados, São Paulo, v. 15, n. 43, p. 83-100, 2001.
NÓBREGA. D. M. Análise de discriminante utilizando o SPSS. 2010.53f. Monografia (Graduação em Estatística) – Universidade Estadual da Paraíba, Campina Grande, 2010.
OLIVEIRA, T. J. A.; DOERNER, S. H.; SCHNEIDER, M. Desenvolvimento econômico no MATOPIBA: os arranjos produtivos locais da soja. Economia Ensaios, v. 35, p. 68-81, 2020.
PACHECO, C. A. Fragmentação da Nação. UNICAMP: Instituto de Economia. São Paulo. 1998.
PEREIRA, C. N.; CASTRO, C. N.; PORCIONATO, G. L. Expansão da agricultura no MATOPIBA e impactos na infraestrutura regional. Revista de Economia Agrícola, v. 65, p. 15-33, 2018.
PINTO, N. G. M.; CORONEL, D. A. Desenvolvimento rural no Rio Grande do Sul: uma análise das mesorregiões entre o período de 2000 e 2010. Ensaios FEE. Porto Alegre,v. 36, n. 4, p. 893 - 920, mar. 2016.
PNUD – Programa das Nações Unidas para o Desenvolvimento. Disponível em: https://www.br.undp.org/content/brazil/pt/home/idh0/rankings/idhm-municipios-2010.html. Acesso em: 05/01/2021.
POLASTRINI, A. C.; MARTINS, C. L.; TREDEZINI, C. A. D. Indicadores de desenvolvimento rural: análise comparativa entre os territórios CONSADS da região Centro-Oeste e Nordeste. Sociedade e desenvolvimento rural, v. 9, p.73-99, nov. 2015.
RAIS – RELAÇÃO ANUAL DE INFORMAÇÕES SOCIAIS. Disponível em: http://www.mte.gov.br. Acesso em: 28/12/ 2020.
RIBEIRO, L. C. S.; LOBO, A. S.; SILVA, L. D.; SANTOS, N. F. . Padrões de crescimento econômico dos municípios do MATOPIBA. Revista de Economia e Sociologia Rural, v. 58, p. 1-17, 2020.
ROSADO, P. L.; ROSSATO, M. V.; LIMA. J. E. Hierarquização e desenvolvimento socioeconômico das microrregiões de Minas Gerais: uma análise regional. In: XLIII Congresso Brasileiro de Economia e Sociologia Rural – SOBER. Anais...Ribeirão Preto, 2005.
RODRIGUES, A. M. G.; BATISTA, M. A. M.; GALVAO, T. L.; SOUSA, E. P. Desenvolvimento rural paulista e seus fatores determinantes. Revista Eletrônica Documento/Monumento, v. 24, p. 161-181, 2018.
SANTOS, V. F.; LIMA, J. E. . Desflorestamento na Amazônia Legal: uma análise discriminante. Revista de Política Agrícola, v. 19, p. 29-38, 2010.
SANTOS, L. F.; FERREIRA, M. A. M.; SALGADO, R. F. S. F. Desenvolvimento rural nos municípios de Minas Gerais: fatores determinantes e hierarquização. Gestão & Regionalidade (Online), v.33, n. 97, p.88-99, jan./abr. 2017.
SERIGATI, F.; RODRIGUES, R. M.; POSSAMAI, R.; VEIRA FILHO, J. E. R. O mercado de trabalho na fronteira do agronegócio: quanto a dinâmica no Matopiba difere das regiões mais tradicionais? Brasília: Ipea, 2017. (Texto para Discussão, n. 2.277).
SILVA, A. F.; ARAÚJO, J. A.; JUSTO, W. R.; CAMPOS, K. C. Análise da pobreza multidimensional no Brasil no período de 2009 a 2015. Revista Econômica do Nordeste, Fortaleza, v. 48, n. 2, p. 9-24, 2017.
SOUZA, U. R. Eficiência técnica e de escala das cooperativas agropecuárias do estado do Paraná. 2008. 106 f. Tese (Doutorado em Economia Aplicada) – Universidade Federal de Viçosa, Viçosa, 2008.
STEGE, A. L. Desenvolvimento rural nas microrregiões do Brasil: um estudo multidimensional. Maringá, PR, 137 p. Dissertação (Mestrado em Economia) – Universidade Estadual de Maringá, 2011.
STEVENS, J. P. Applied Multivariate Statistics for the Social Sciences, Lawrence Erlbaum Associates, Mahwah, NJ, 2002.
TRIOLA, M. F. Introdução à Estatística. 11 ed. Rio de Janeiro: LTC, 2013.
VEIGA, J.E. Cidades Imaginárias: o Brasil é menos urbano do que se calcula. Campinas, SP: Editora Autores Associados, 2002.
VIEIRA FILHO, J. E. R.; FISHLOW, A. Agricultura e Indústria no Brasil: inovação e competitividade. Brasília: Ipea, 2017.