Artículos
Design and Psychometrics of Measurement Tool of Health Needs in Patients with Chronic Back Ache
Diseño y psicometría de la herramienta de medición de las necesidades de salud en pacientes con dolor de espalda crónico
Design and Psychometrics of Measurement Tool of Health Needs in Patients with Chronic Back Ache
Revista Latinoamericana de Hipertensión, vol. 13, no. 3, pp. 277-284, 2018
Sociedad Latinoamericana de Hipertensión

This work is licensed under Creative Commons Attribution-NonCommercial-NoDerivs 4.0 International.
Abstract:
The necessity of valid, reliable and objective tools is one of the subjects that have always been emphasized in studies related to the health of individuals. However, it is believed that existing tools generally do not have the necessary credibility and validity and cannot correctly assess the health needs of patients with chronic back ache. This study aimed to design a valid and reliable tool for assessing the health needs of patients with chronic back ache. This is an exploratory sequential mixed (qualitative-quantitative) method research conducted in medical sciences clinics of the Ministry of Health and Medical Education in Shiraz in 2017. In the qualitative content analysis phase through interview with patients, their family carers, the treatment team in relation to these patients, the health needs of patients with chronic back ache were defined and then, based on the findings and with extensive review of the texts, the tool’s dimensions and items were designed. Then, in the quantitative phase of the psychometrics of tool, the content (quantitative and qualitative) validity and structural validity (factor analysis) were done by using different methods of formal (quantitative and qualitative) validity. Reliability was also calculated through internal consistency and stability.
Keywords: Health Needs, Patients, Chronic Back Ache, Questionnaire, Health Needs, Patients, Chronic Back Ache, Questionnaire.
Abstract:
The necessity of valid, reliable and objective tools is one of the subjects that have always been emphasized in studies related to the health of individuals. However, it is believed that existing tools generally do not have the necessary credibility and validity and cannot correctly assess the health needs of patients with chronic back ache. This study aimed to design a valid and reliable tool for assessing the health needs of patients with chronic back ache. The necessity of valid, reliable and objective tools is one of the subjects that have always been emphasized in studies related to the health of individuals. However, it is believed that existing tools generally do not have the necessary credibility and validity and cannot correctly assess the health needs of patients with chronic back ache. This study aimed to design a valid and reliable tool for assessing the health needs of patients with chronic back ache. This is an exploratory sequential mixed (qualitative-quantitative) method research conducted in medical sciences clinics of the Ministry of Health and Medical Education in Shiraz in 2017. In the qualitative content analysis phase through interview with patients, their family carers, the treatment team in relation to these patients, the health needs of patients with chronic back ache were defined and then, based on the findings and with extensive review of the texts, the tool’s dimensions and items were designed. Then, in the quantitative phase of the psychometrics of tool, the content (quantitative and qualitative) validity and structural validity (factor analysis) were done by using different methods of formal (quantitative and qualitative) validity. Reliability was also calculated through internal consistency and stability . 29 people are the participants included patients with chronic back ache, family carers and specialists associated with the disease. The health needs of patients with chronic back ache were explained in four dimensions: education and information needs, spiritual / religious needs, socio-economic needs, and physical-psychological needs. Based on these four dimensions, 109 original items were designed. 91 items in the Item Impact section acquired the scores 1/5 and higher. In terms of content validity, 49 items received 0.49 and higher. The content validity index of the individual items was equal to one, and the content validity index of the entire tool, both as S-CVI / Universal and as S-CVI / Average, was 1 at this stage. The kappa coefficient of all the terms was equal to one. In this structure, using exploratory factor analysis, four factors were also explained; they were named based on the items of each group. The internal consistency of the tool by calculating the total Cronbach’s alpha coefficient was 0.75, which was 0.73 in education and 0.72 in social/economic needs, 0.74 in physical needs and 0.72 in psychological needs. The intra-cluster correlation was equal to … The designed tool for the needs of chronic back ache patients has different dimensions and has a good validity and reliability. This tool can provide an appropriate assessment of the health needs of patients with chronic back ache and improve the quality of services provided to patients.
Keywords: Health Needs, Patients, Chronic Back Ache, Questionnaire, Health Needs, Patients, Chronic Back Ache, Questionnaire.
Resumen:
La necesidad de herramientas válidas, confiables y objetivas es uno de los temas que siempre se han enfatizado en estudios relacionados con la salud de las personas. Sin embargo, se cree que las herramientas existentes generalmente no tienen la credibilidad y validez necesarias y no pueden evaluar correctamente las necesidades de salud de los pacientes con dolor de espalda crónico. Este estudio tuvo como objetivo diseñar una herramienta válida y confiable para evaluar las necesidades de salud de los pacientes con dolor de espalda crónico. La necesidad de herramientas válidas, confiables y objetivas es uno de los temas que siempre se han enfatizado en estudios relacionados con la salud de las personas. Sin embargo, se cree que las herramientas existentes generalmente no tienen la credibilidad y validez necesarias y no pueden evaluar correctamente las necesidades de salud de los pacientes con dolor de espalda crónico. Este estudio tuvo como objetivo diseñar una herramienta válida y confiable para evaluar las necesidades de salud de los pacientes con dolor de espalda crónico. Se trata de una investigación exploratoria secuencial mixta (cualitativo-cuantitativa) realizada en las clínicas de ciencias médicas del Ministerio de Salud y Educación Médica en Shiraz en 2017. En la fase de análisis de contenido cualitativo a través de entrevistas con pacientes, sus familiares cuidadores, el equipo de tratamiento en relación con estos pacientes, se definieron las necesidades de salud de los pacientes con dolor de espalda crónico y luego, en base a los hallazgos y con una extensa revisión de los textos, se diseñaron las dimensiones y los ítems de la herramienta. Luego, en la fase cuantitativa de la psicometría de la herramienta, la validez del contenido (cuantitativo y cualitativo) y la validez estructural (análisis factorial) se realizaron utilizando diferentes métodos de validez formal (cuantitativa y cualitativa). La confiabilidad también se calculó mediante consistencia interna y estabilidad. 29 personas son los participantes incluidos los pacientes con dolor de espalda crónico, cuidadores familiares y especialistas asociados con la enfermedad. Las necesidades de salud de los pacientes con dolor de espalda crónico se explicaron en cuatro dimensiones: necesidades de educación e información, necesidades espirituales / religiosas, necesidades socioeconómicas y necesidades físico-psicológicas. En base a estas cuatro dimensiones, se diseñaron 109 artículos originales. 91 artículos en la sección Impacto del artículo adquirieron los puntajes 1/5 y superiores. En términos de validez de contenido, 49 artículos recibieron 0.49 y más. El índice de validez de contenido de los elementos individuales era igual a uno, y el índice de validez de contenido de toda la herramienta, tanto S-CVI / Universal como S-CVI / Promedio, era 1 en esta etapa. El coeficiente kappa de todos los términos fue igual a uno. En esta estructura, utilizando el análisis factorial exploratorio, también se explicaron cuatro factores; fueron nombrados en base a los artículos de cada grupo. La consistencia interna de la herramienta al calcular el coeficiente alfa total de Cronbach fue de 0,75, que fue de 0,73 en educación y 0,72 en necesidades sociales / económicas, 0,74 en necesidades físicas y 0,72 en necesidades psicológicas. La correlación intra-cluster fue igual a ... La herramienta diseñada para las necesidades de pacientes con dolor de espalda crónico tiene diferentes dimensiones y tiene una buena validez y confiabilidad. Esta herramienta puede proporcionar una evaluación adecuada de las necesidades de salud de los pacientes con dolor de espalda crónico y mejorar la calidad de los servicios prestados a los pacientes.
Palabras clave: Necesidades de salud, pacientes, dolor de espalda crónico, cuestionario, Necesidades de salud, pacientes, dolor de espalda crónico, cuestionario.
Resumen:
La necesidad de herramientas válidas, confiables y objetivas es uno de los temas que siempre se han enfatizado en estudios relacionados con la salud de las personas. Sin embargo, se cree que las herramientas existentes generalmente no tienen la credibilidad y validez necesarias y no pueden evaluar correctamente las necesidades de salud de los pacientes con dolor de espalda crónico. Este estudio tuvo como objetivo diseñar una herramienta válida y confiable para evaluar las necesidades de salud de los pacientes con dolor de espalda crónico. Se trata de una investigación exploratoria secuencial mixta (cualitativo-cuantitativa) realizada en las clínicas de ciencias médicas del Ministerio de Salud y Educación Médica en Shiraz en 2017. En la fase de análisis de contenido cualitativo a través de entrevistas con pacientes, sus familiares cuidadores, el equipo de tratamiento en relación con estos pacientes, se definieron las necesidades de salud de los pacientes con dolor de espalda crónico y luego, en base a los hallazgos y con una extensa revisión de los textos, se diseñaron las dimensiones y los ítems de la herramienta. Luego, en la fase cuantitativa de la psicometría de la herramienta, la validez del contenido (cuantitativo y cualitativo) y la validez estructural (análisis factorial) se realizaron utilizando diferentes métodos de validez formal (cuantitativa y cualitativa). La confiabilidad también se calculó mediante consistencia interna y estabilidad. 29 personas son los participantes incluidos los pacientes con dolor de espalda crónico, cuidadores familiares y especialistas asociados con la enfermedad. Las necesidades de salud de los pacientes con dolor de espalda crónico se explicaron en cuatro dimensiones: necesidades de educación e información, necesidades espirituales / religiosas, necesidades socioeconómicas y necesidades físico-psicológicas. En base a estas cuatro dimensiones, se diseñaron 109 artículos originales. 91 artículos en la sección Impacto del artículo adquirieron los puntajes 1/5 y superiores. En términos de validez de contenido, 49 artículos recibieron 0.49 y más. El índice de validez de contenido de los elementos individuales era igual a uno, y el índice de validez de contenido de toda la herramienta, tanto S-CVI / Universal como S-CVI / Promedio, era 1 en esta etapa. El coeficiente kappa de todos los términos fue igual a uno. En esta estructura, utilizando el análisis factorial exploratorio, también se explicaron cuatro factores; fueron nombrados en base a los artículos de cada grupo. La consistencia interna de la herramienta al calcular el coeficiente alfa total de Cronbach fue de 0,75, que fue de 0,73 en educación y 0,72 en necesidades sociales / económicas, 0,74 en necesidades físicas y 0,72 en necesidades psicológicas. La correlación intra-cluster fue igual a ... La herramienta diseñada para las necesidades de pacientes con dolor de espalda crónico tiene diferentes dimensiones y tiene una buena validez y confiabilidad. Esta herramienta puede proporcionar una evaluación adecuada de las necesidades de salud de los pacientes con dolor de espalda crónico y mejorar la calidad de los servicios prestados a los pacientes.
Palabras clave: Necesidades de salud, pacientes, dolor de espalda crónico, cuestionario, Necesidades de salud, pacientes, dolor de espalda crónico, cuestionario.
Introduction
Chronic pain is one of the most common problems affecting the lives of individuals and societies1. Chronic back ache is one of the most common types of chronic pains and musculoskeletal disorders, and 70-80% of people experience it at least one time during their life. Most patients with acute back ache recover within 6 weeks, and only 10-25% of the remaining patients are at risk for chronic back ache2,3.
Several studies have shown evidence of an increase in the incidence of chronic back ache and resulting disabilities worldwide4-7. The incidence of back ache has increased in Americans so that it causes significant financial, personal and social losses, and in addition to disability it leads to high cost of treatment8-10. In Iran is also back ache with a prevalence of 27.18% and working people with back ache have more anxiety, depression and psychological disorders11. Patients with chronic back ache have their own specific needs. Fast tiredness in the muscles of the spinal column and the abdominal muscles during daily activities has caused the problems of this group of patients to be distinguished from other people with musculoskeletal system problems12. In most cases, back pain is removed after a few weeks, but in some cases it remains for a long time and causes many problems and needs for those who suffer from it. Therefore, due to the inevitability of these needs and given the affectability of the needs from the cultural context of a society and the need for a deep look at this category, it seems necessary to determine the dimensions of the health needs of patients with chronic back ache and make a tool that meets the needs of these patients, appropriate to Iranian texture and culture. Also a reliable and valid tool for assessing the health needs of patients with chronic back ache allows specialized groups to easily use their specialized tools. Therefore, the present study was conducted with the aim of designing and psychometric evaluation of the health needs of patients with chronic back ache in Iran.
Procedure: The present research is an exploratory sequential (quantitative-qualitative) combination study. Data is collected, analyzed, and integrated with two qualitative and quantitative approaches. This study has been designed in two stages: 1. Qualitative content analysis to determine the classes and themes. 2. Design and psychometric evaluation of the health needs of patients with chronic back ache. In this method, first, the concept is explained, then the items of the tool are formed and finally the validity and reliability of the tool are examined13. This study was conducted in 2012 in health clinics affiliated with the Ministry of Health and Medical Education of Shiraz.
The present research was conducted to design a tool for evaluating the health needs of patients with chronic back ache. As a first step in this process, semi-structured interviews were conducted in the form of content analysis approach with patients with chronic back ache and their family carers as well as various specialists in relation to these patients. In this process, according to the purpose of the research, data collection was done to define the health needs of patients with chronic back ache and to determine the dimensions and its items. Then, by reviewing the studies, the articles related to instrumentation and also the need-assessment tools of the patients were examined. The stages are as follows:
First stage: First, the health needs of patients with chronic back ache were explained based on the views of patients with chronic back ache and their family carers and specialists. Dimensions of tool and items related to each dimension were determined based on the views of patients with chronic back ache and their family carers, different specialists and review of the texts. Determining the domain and scope of the concept is one of the first steps in designing the tool. This can be achieved through a review of studies and interviews with experts, as the appropriate methods for determining the scope and concept14.
After defining the health needs of patients with chronic back ache and determination of dimensions and items of desired tool, information gathered was examined by the research team during meetings. Some items have been integrated or deleted, and some have changed. In this way, the primary tool for evaluating the health needs of patients with chronic back ache was designed with a 5-part Likert spectrum (I fully agree, I agree, I neither agree nor disagree, I disagree, and I completely disagree). Second stage: After the design of the primary tool, its psychometric steps began. In the present research, face validity, content validity, and structure validity were used to validation of the tool. The internal consistency and stability method was used to determine the reliability. The validity of a tool determines how much a tool measures what it should be measured. In face validity, the purpose is to determine whether the tool has a suitable form for measuring the structure15. For qualitative and quantitative methods were used for determination of face validity. In the qualitative method of face validity, 12 people of the nursing experts examined the tool in terms of appropriateness and appropriate relation of the items with the dimensions of the tool and the existence of the word reflecting the concept. To determine the face validity quantitatively, the importance of each item was investigated with Item Impact Method. In this way, for each tool item, the 5-part Likert scale of it is quite important (5 points), it is partly important (4 points), it is on average important (3 points), It is a little important (2 points), and it does not matter at all (1 point) was considered. Then, 18 patients with chronic back ache identified the importance of each item. The score of the effect of each item was calculated according to formula 1. In the item impact method if the score of the effect is equal to or greater than 1.5, then that item will be retained16.
Formula 1: The impact score of the item: Importance × Frequency (by percent) = Impact score
- Content validity is how much a tool contains appropriate items for a measured structure and properly covers the area of the structure. Content validity is based on experts’ judgment. Qualitative and quantitative methods were used to determine the content validity. In qualitative investigation of content validity, 15 individuals were asked to express their views on grammar, the use of proper words and the placement of items in their place13. To verify the validity of the content Quantitatively, two methods of Content Validity Ratio (CVR) and Content Validity Index (CVI) were used. First, to determine the content validity ratio, the experts were asked to examine each item based on the 3-part Likert scale (it is necessary, it is useful but not necessary, it is not necessary). Then, responses were calculated according to formula 2 (17 and 18) based on the Lawshe table and the number of experts of the items whose content validity ratio was higher than 0.49 was retained19.
Formula 2:
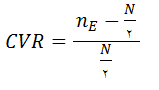 [Formula 2]
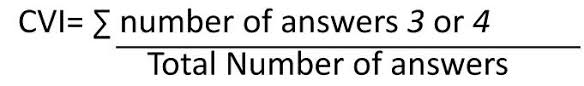
In order to evaluate the content validity index, Waltz & Bausell’s method was used. To this end, the tool was provided to 15 experts and they were asked to determine the relevance, clarity and simplicity of each item in the tool from a score of 1 to 4 based on the content validity index of Waltz and Bausell13. The score of content validity index of each item was calculated by the percentage of scores of I agree for each item that received scores 3 and 4 in the area of "relevance" based on formula 3.
Formula 3:
 [Formula 3]
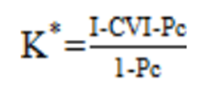
Due to the possibility of a chance agreement in the Content Validity Index, Cohen's modified Kappa coefficient was also calculated for the items. The Kappa coefficient represents an index of the agreement among the evaluators on the relevance of the item. The Kappa coefficient was calculated based on formula 4. Kapa coefficient above 0.75 is considered excellent, between 0.6-0.74 good and less than 0.59 weak20.
Formula 4:
 [Formula 4]
Then, based on the mean scores of the content validity index of all tool items, the mean content validity index of the tool was calculated. In this method, items with a score higher than 0.79 are appropriate, those between 0.79 to 0.7 need to be corrected and those less than 0.7 are unacceptable20.
Several methods are available to achieve structure validity. In this study, exploratory factor analysis has been used as a common method for determining the validity of the health needs questionnaire for patients with chronic back ache. Factor analysis is used to construct a test to help determine the homogeneity of selected questions, namely, the existence of a key factor and the choice of homogeneous questions. By choosing questions with a certain factor weight, a complex form of content validity can be obtained22.
Methods & Reliability
The reliability of the research tool shows that the use of this tool in repeated measurements in the same conditions gives the same results in the same way13. The reliability is related to the correctness of one tool. The tool is reliable when it reflects the correct and error-free scores22. To calculate the reliability, the number of samples between 30-50 is appropriate21. The reliability coefficient of 0.7 or higher indicates an acceptable level of reliability (14 and 20). In order to measure the reliability of the tool, internal consistency and reliability were used in this study. In this research, internal consistency was assessed by calculating the Cronbach's alpha coefficient14. For this purpose, 400 patients were evaluated by the researcher and the tool for measuring the health needs of patients with chronic back ache was completed for them. Then Cronbach's alpha was calculated for the tool in general and each dimension separately. In order to determine the stability of the questionnaire, the test method of retest was used with a 2-week interval. The questionnaire was completed in 2-week interval by 50 patients with chronic back ache. Then, using the obtained scores in these two stages, the inter-cluster correlation coefficient was calculated. The most acceptable statistical test for evaluating the reliability (stability) is the intra-cluster correlation index. If the index is between 0 and 0.2, it is considered to be of low stability, if it is between 0.21 and 0.4, it is weak, if it is between 0.41 and 0.6 is moderate, between 0.61 and 0.8 it is good and if it is higher than 0.8, the degree of stability is considered to be excellent23.
Results
The purpose of this research was to design and psychometric assessment of a valid and reliable tool for evaluating the health needs of patients with chronic back ache. The results of this research are presented in two quantitative and qualitative parts.
Qualitative Part
The qualitative part included the explanation of the health needs of patients with chronic back ache and the dimensions and items of the tool based on the opinion of patients and specialists on chronic back ache and review of the texts. The definition of the health needs of patients with chronic back ache from the viewpoint of patients, their family carers and specialists in the field of back pain was stated as follows: The health needs of patients with chronic back ache include needs in four areas: the need for education and information, spiritual / religious needs, Socio-economic needs and physical-psychological needs.
Determining the dimensions and items of the tool and designing it: the initial tool consists of 4 dimensions and 109 items with 5-option Likert spectrum (I fully agree: 5, I agree: 4, I neither agree nor disagree: 3, I disagree: 2, I totally disagree: 1).
Quantitative Part: validation of questionnaire
Face validity: Face validity was evaluated qualitatively and quantitatively. In the qualitative study of face value, the items were examined in terms of "difficulty of the expressions", "degree of fit and relevance of the expressions with the main purpose" and "existence of ambiguity and insufficiency in the meaning of words". The necessary corrections were made based on the comments of 12 experts. A total of 18 items have been modified and 18 items were removed due to their alignment with other items. At this stage, the number of questions fell to 91.
In the quantitative study of face validity, the score of Item Impact was estimated by 18 patients with chronic back ache in which 25 items scored less than 1.5. Thus, the items were reduced to 66 ones. Content validity: it was also evaluated qualitatively and quantitatively.
Content validity was evaluated in qualitative terms based on the views of 15 people who knew about grammar, the use of proper words and the positioning of items in their place, 19 of which had editorial changes.
In studying the validity, quantitatively, 15 experts in the field of back pain, nursing and instrumentation were asked to comment on the necessity of each item in a three-part spectrum, useful, but not necessary, and not necessity. The content validity ratio was calculated based on the Lawshe table. At this stage, based on the Lawshe table and the minimum score of 0.49, 17 items were eliminated and the items dropped from 66 to 49.
Content validity index was also calculated. In order to calculate the CVI, the three criteria of "relevance", "simplicity" and "clarity" of the questionnaire were separately examined by 15 experts and scholars in a four-part Likert spectrum for each item. In this stage, 9 items have changed in terms of "simplicity" and "clarity" and one question has also been divided into two parts. So the number of questions ranged from 49 to 50. In terms of "relevance" all items have a content validity index of 1 that is acceptable. In the next step, the Kappa coefficient was calculated. In this stage, the Kappa coefficient for each single item is equal to 1, which is classified as excellent. So none of the items were removed. S-CVI / AVE and S-CVI / UA were calculated, which were both equal to one. In the next stage, structure validity was investigated through exploratory factor analysis. The factor analysis is combined of a number of statistical techniques and aims to simplify complex data sets. In the present study, the ratio of 8 to 1 of subjects to variables was used. Therefore, being questionnaire composed of 50 items, the sample size was determined as to be 400 people.
Prior to factor analysis, items that had a correlation of less than 0.5 were eliminated based on the Anti-image table. In this study, 19 items were removed before the start of the next stage due to a correlation of less than 0.5. There are powerful data in factor analysis when items are loaded uniformly and over 0.5 in the factors. In other words, if the Extraction column shows a numeric value of less than 0.5, then the component should be removed from the analysis24. At this point, 2 items were dropped out due to the item being less than 0.5. So the number of items reached 29. Sampling Adequacy was then studied by measuring the Kaiser-Meyer-Olkin (KMO) sampling adequacy scale. According to Cereny & Kaiser, the Kieser-Mayer-Oleckin value should be greater than 0.6 to be able to do a factor analysis26. At this stage, the sampling adequacy obtained from the Kaiser-Mayer-Olekin statistic was equal to 0.807 which was accepted and confirmed. In the next stage, to ensure that the matrix of data correlation in population is not zero and there is enough correlation between the items of the questionnaire, the Bartlett's test was used25. The results of this test were significant at the level of 0.001, which indicates the acceptable performance of factor analysis with respect to the correlation matrix obtained in the sample. In the next stage, in order to extract the factors from the main component analysis method and to determine whether the sum of questions was saturated with several factors, three important indices of eigenvalues (Kaiser standard), the ratio of variance explained by Each factor and diagram of Eigenvalues or Scree plot were used. In diagram 1, Scree plot was observed; four factors were sufficient to explain the number of factors in the health needs of patients with chronic back ache.
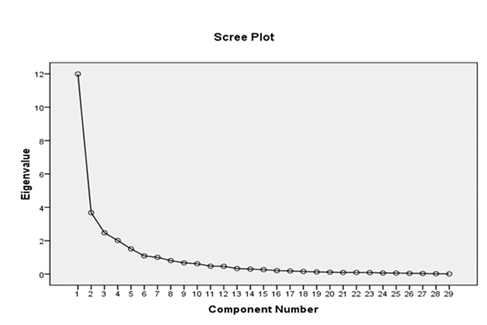
Figure 1
Scree plot to determine the number of factors in the questionnaire
The four main factors of the questionnaire of health needs of patients with chronic back ache explain 64.41% of the total variance. In other words, the factor analysis revealed 4 Eigenvalues over one, which, in total, explained 64.41 % of variance, as shown in [Table 1].
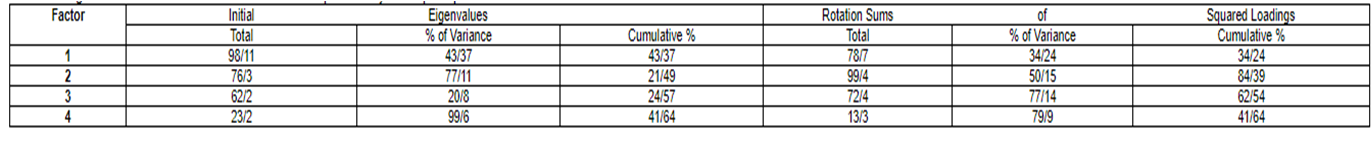
Subsequently, the extraction of the factors was done by main component analysis method using varimax rotation. In this study, for the analysis of the main components, factor coefficients (or factor load) of 0.4 were considered as the minimum factor load needed to maintain each expression in the extracted factors. The preliminary results of principal component analysis showed that none of the items had a factor loading of less than 0.4, and therefore they were not removed. After analyzing the main components with Varimax rotation, four main factors were extracted based on the eigenvalues. In this stage, four factors of education and information, socioeconomic needs, physical well-being and mental health needs were recorded.
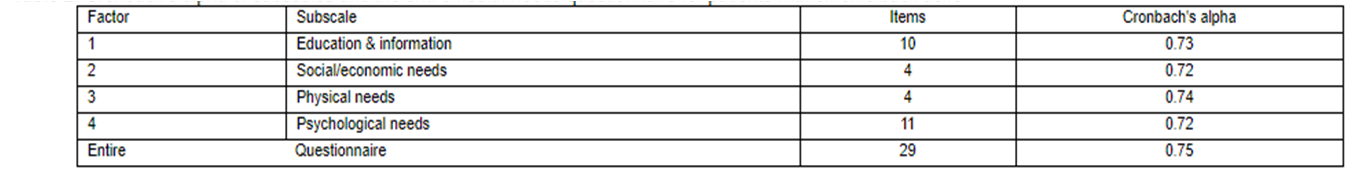
Reliability of the tool: Internal consistency and stability were used to examine the reliability. In the study of internal consistency, Cronbach's alpha coefficients were calculated first. The Cronbach's alpha coefficient of the questionnaire was 0.75 which has good reliability. The number of items in each dimension and the alpha coefficient of each dimension have been shown in [Table 2].
Also, in order to calculate the internal consistency, in addition to calculating the Cronbach's alpha coefficient, a split-half technique was used. To calculate the internal consistency by this method, the questions of a test were divided into two even and odd halves, and then the correlation between the scores of the two halves was examined. The correlation results between the even and odd questions have been presented in [Table 3].

As shown in this table, the correlation coefficient of even questions and odd questions is +0.83, which indicates a good and positive relationship between questions, and the good internal consistency of the tool.
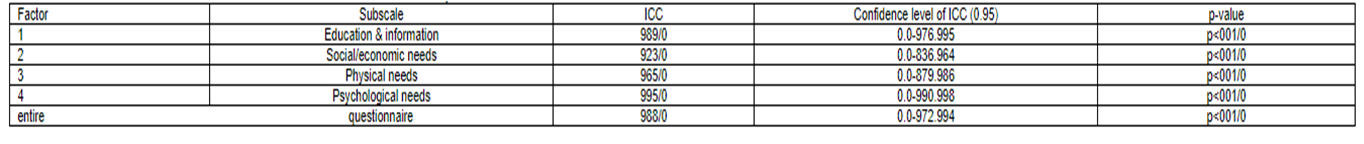
In the stability study, the total intraclass correlation coefficient between these two tests is at significant level of p <0.001 equal to 0.988, and the correlation coefficient of all subscales is above 0.8, which is significant and excellent. As a result, the stability of this questionnaire has been proven. [Table4] shows the intra-cluster correlation of the sub-scales and the total tool between the two tests.
Scoring: In order to have a better understanding of the scoring and comparability of the subscales of the questionnaire, a linear transformation formula was used. (Formula No. 5) First, in order to calculate the scores of each class, the maximum and minimum difference of scores was divided by 3 to be specified the size of the classes, which was equal to 38.6. Then to the minimum score (score 29) this value was added to be formed classes. Therefore, the raw score represents 29-67.69 as the low need class, 67.70-106.39 as the moderate need class and 106.40-145 as high need class. The total score of the questionnaire is interpreted in a three-part Likert of low need, moderate need, and intense need.
Formula 5: 100 × (earned raw score-total minimum score) / (total minimum score-total maximum score)
Discussion
In this study, a valid and reliable tool for assessing the health needs of patients with chronic back ache was designed with necessary and objective details and in complete sentences, for behavioral purposes. This tool is a tool that can assess the different needs of patients with chronic back ache in various clinics. For this purpose, an exploratory sequential mixed method research tool was developed consisting of 4 domains and 29 items. For the designed tool, a 5-part Likert spectrum was considered. This was done in order to more objectively assess how to score and assign scores in a more accurate way. The designed tool includes education and information dimensions, socio-economic needs, physical needs and psychological needs, which are important aspects of the health needs of patients with chronic back ache.
Lowliss (1989) designed the Dallas Pain Questionnaire to investigate the effect of spinal pain on patient behavior. He used factor analysis to verify the structure validity and finally the two factors were finally stabilized. Also, convergent validity was evaluated through correlation analysis with McGill's Pain Questionnaire. The results showed that these two questionnaires had a positive correlation with each other. Validity was also evaluated through a review of known groups of people with spinal pain and healthy subjects. The results show a significant difference in the scores of these two groups. In evaluating this questionnaire, only the validity of the structure has been investigated and other validities whose check is the requirements of a standard tool have not been evaluated. The reliability of the questionnaire was also examined through a re-test. The correlation score between these two tests is 0.97, which indicates the good reliability of this tool. Here, other methods of reliability such as Cronbach's alpha have not been used26.
Anagnostis (2004) evaluated the psychometrics of Pain Inability Inventory. In this questionnaire, the reliability of the questionnaire was investigated using retest method. The correlation was equal to 0.97. Also, internal reliability was investigated with Cronbach's alpha, being equal to 0.96. Validity of this questionnaire was evaluated through structure validity. Convergent validity was assessed through studying its correlation with Oswestry questionnaire of the visual analogue Scale, which had a significant relationship with each other. Factor analysis was used in studying structure validity. Two main factors covered the whole questions. After determining the specific value factors, factors above 1 were reported. Factor 1 has a specific value of 7.46 and accounts for 49.7% of the variance. Factor 2 also has a special value of 1.3 and explains 8.6% of the variance. In this study, other methods of determining the validity of content such as content validity, which is one of the important components of validity, has not been investigated27.
Kim (2005) developed the Oswestry Initial Questionnaire in Korean language. This questionnaire provides information on the inability created by spine diseases for patients. Structure validity was used to determine the validity of this questionnaire. To evaluate this validity, convergent validity was used. The correlation of this questionnaire with the questionnaire of visual analogue scale questionnaire (r = 0.425) and with the World Health Organization Quality of Life Questionnaire (r = 0.480), was reported to be of appropriate. Also, to investigate the reliability, the retest was carried out with a two-day interval. Its intra-cluster correlation coefficient was equal to 0.916, but a retest with a low distance can falsely increase this coefficient and due to the memory effect, this correlation coefficient has increased. Also, to assess the reliability, it evaluates the internal stability. Cronbach's Alpha has been reported by 0.84 after two days. The results indicate good stability of the questionnaire28. In the study, only one of the methods of determining the validity has been investigated. While evaluating other validities, such as face and content validity, is a prerequisite for psychometric requirements.
The other tool available in the field of pain that is translated and adapted to Iranian patients culturally is Iranian McGill's Pain Inventory. The purpose of this study is to evaluate the reliability and sensitivity of this tool. Guillemin's guidelines were used in this study, including forward-backward translation, Expert committee meetings, and validation testing in a pilot group. The questionnaire was provided to 100 patients referring to rehabilitation clinics with chronic pains. 98 questionnaires were returned. To assess the reliability, the questionnaire was completed on the first day of the visiting the physician in the morning and evening of the same day and three weeks later by the patients. Cronbach’s alpha for sense dimension is 0.951, for movement dimension is 0.832, and for the whole questionnaire is 0.840. Then the Intraclass correlation coefficient (ICC) was examined. The intraclass correlation for sense dimension is 0.906, for movement dimension is 0.712 and for the whole questionnaire is 0.912. The existence of a correlation between the subscales provides a convergent validity for each item. The spectrum and suffering of the correlations observed in the subscales are r. = 0202 to r. = 0.739. Also, to study the structure validity, the main components analysis was used. After the oblimin rotation, the two main components appeared, with the questions that had the greatest correlation with each other. The sensitivity of this tool was evaluated by pair t-test. There was a significant difference in the results before and after the treatment (p <0.001).
In this study, in order to examine reliability, the internal consistency and stability have been used. In order to verify the stability, the questionnaire was completed twice on the first day of the visit, and once three weeks after the first visit, which would be better completed between 10 days and 2 weeks. Studying content validity was also found to be culturally necessary to ensure content coverage29.
Conclusion
The designed tool is a tool for evaluating the health needs of patients with chronic back ache, which is finally prepared in 4 dimensions and 29 items. All the scores calculated on the validity and reliability of the tool were appropriate. The items of this tool have been provided even in detail, in objective and complete sentences with behavioral goals, and their scoring based on the Likert spectrum is convenient. As a result, the tool developed in this research, with its proper characteristics, can be used to assess the health needs of patients with chronic back ache.
Appreciation
This article is based on the student's thesis of Mrs. Khatereh Rostami, under project number 13821, which was sponsored by the Vice-Chancellor of Research and Technology of Shiraz University of Medical Sciences to whom we express our gratitude. Also, all patients, professors and respected specialists who have been very patient in designing and determining the reliability and validity of the tool, are sincerely appreciated.
References
1. van Hecke O, Torrance N, Smith BH (2013) . Chronic pain epidemiology–where do lifestyle factors fit in? British journal of pain. 7(4), pp. 209-17.
2. Meucci RD, Fassa AG, Faria NMX (2015). Prevalence of chronic low back pain: systematic review. Revista de saude publica. 49.
3. Carnes D, Parsons S, Ashby D, Breen A, Foster N, Pincus T, et al (2007). Chronic musculoskeletal pain rarely presents in a single body site: results from a UK population study. Rheumatology. 46(7), pp. 1168-70.
4. Jamieson-Lega K, Berry R, Brown CA (2013). Pacing: A concept analysis of a chronic pain intervention. Pain Research and Management. 18(4), pp. 207-13.
5. Sadeghian F, Hoseinzadeh S, Lashkari M, Delvarian Zm (2012). Role of health beliefs, somatization tendency and mental health on low back pain among nurses.
6. Ghaseminejad M, Tavafian S, Heidarnia a (2015). Surveying impact of physical health educational program on quality life of nurses with chronic low back pain.
7. Jamshidi A (2014). Low back pain educational programs and quality of life in women living with chronic low back pain: a semi experimental study. Iranian Journal of Health Education and Health Promotion. 2(1), pp. 49-56.
8. Shmagel A, Foley R, Ibrahim H (2016). Epidemiology of Chronic Low Back Pain in US Adults: Data From the 2009–2010 National Health and Nutrition Examination Survey. Arthritis care & research. 68(11), pp. 1688-94.
9. Barry DT, Irwin KS, Jones ES, Becker WC, Tetrault JM, Sullivan LE, et al (2009). Integrating buprenorphine treatment into office-based practice: a qualitative study. Journal of general internal medicine. 24(2), pp. 218-25.
10. Tang NK, Wright KJ, Salkovskis PM (2007). Prevalence and correlates of clinical insomnia co‐occurring with chronic back pain. Journal of sleep research. 16(1), pp. 85-95.
11. Noormohammadpour P, Mansournia MA, Koohpayehzadeh J, Asgari F, Rostami M, Rafei A, et al (2017). Prevalence of Chronic Neck Pain, Low Back Pain, and Knee Pain and Their Related Factors in Community-Dwelling Adults in Iran: A Population-based National Study. The Clinical journal of pain33(2):181-7.
12. Marin R, Cyhan T, Miklos W (2006). Sleep disturbance in patients with chronic low back pain. American Journal of Physical Medicine & Rehabilitation. 85(5), pp. 430-5.
13. Polit DF (2016). Measurement and the Measurement of Change: Wolters Kluwer.
14. Yaghmaie F (2009). [Andazegirye rafter dar pajoohesh abzarhaye motabar va paya]. Second Edition. Tehran:Golban; [Persian]
15. Polit DF, Tatano Beck Ch (2009). Essentials of Nursing Research: Appraising Evidence for Nursing Practice. 7th Edition. Philadelphia: Lippincott Williams &Wilkins.
16. Juniper EF, Guyott GH, Streiner DL, King DR (1997). Clinical impact versus factor analysis for quality of life questionnaire construction. J Clin Epidemiol. 50(3), pp. 233-8.
17. Leung SF, Arthur D (2000). The alcohol use disorders identification test (AUDIT): Validation of an instrument for enhancing nursing practice in Hong Kong. Int J Nurs Stud. 37(1), pp. 57-64. DeVon HA, Block ME, Moyle-Wright P, Ernst DM, Hayden SJ, Lazzara DJ, et al (2007). A Psychometric Toolbox for Testing Validity and Reliability. J Nurs Scholarsh. 39(2), pp. 155-64.
18. Lawshe CH (1975). A quantitative approach to content validity. Personnel Psychology. 28(4), pp. 563-575.
19. Polit DF, Beck CT, Owen SV (2007). Is the CVI an acceptable indicator of content validity? Appraisal and recommendations. Res Nurs Health. 30(4), pp. 459-67.
20. Fleiss JL (1986). The Design and Analysis of Clinical Experiments. New York: Wiley & Sons.
21. Kimberlin CL, Winterstein AG (2008). Validity and reliability of measurement instruments used in research. American Journal of Health-System Pharmacy. 65(23), pp. 2276-84.
22. de Boer MR, Moll AC, de Vet HC, Terwee CB, Volker-Dieben HJ, van Rens GH (2004). Psychometric properties of vision-related quality of life questionnaires: a systematic review. Ophthalmic & physiological optics: the journal of the British College of Ophthalmic Opticians (Optometrists). 24(4), pp. 257-73.
23. Ebadi A, Zarshenas L, Rakhshan M, Zareiyan A (2017). Principles of scale development in health science. Tehran: jamee negar.
24. Cerny BA, Kaiser HF (1977). A Study Of A Measure Of Sampling Adequacy For Factor-Analytic Correlation Matrices. Multivariate behavioral research. 12(1), pp. 43-7.
25. Lawlis GF, Cuencas R, Selby D, McCoy CE (1989). The development of the Dallas Pain Questionnaire. An assessment of the impact of spinal pain on behavior. Spine (Phila Pa 1976). 14(5), pp. 511-6.
26. Anagnostis C, Gatchel RJ, Mayer TG (2004). The pain disability questionnaire: a new psychometrically sound measure for chronic musculoskeletal disorders. Spine (Phila Pa 1976). 29(20), pp. 2290-302; discussion 303.
27. Kim DY, Lee SH, Lee HY, Lee HJ, Chang SB, Chung SK, et al. Validation of the Korean version of the oswestry disability index. Spine (Phila Pa 1976). 2005;30(5):E123-7.
28. Adelmanesh F, Arvantaj A, Rashki H, Ketabchi S, Montazeri A, Raissi G (2011). Results from the translation and adaptation of the Iranian Short-Form McGill Pain Questionnaire (I-SF-MPQ): preliminary evidence of its reliability, construct validity and sensitivity in an Iranian pain population. Sports medicine, arthroscopy, rehabilitation, therapy & technology: SMARTT. 3(1), p. 27.
Author notes
zarshenas@sums.ac.ir