Artículos
Volumetry of epidural hematomas in computed tomography images: Comparative study between linear and volumetric methods
Estimación del tamaño de hematomas epidurales en imágenes de tomografía computarizada: estudio comparativo entre métodos lineales y volumétricos
 Miguel Vera m.avera@unisimonbolivar.edu.co
Yoleidy Huérfano
Carlos Hernández
Oscar Valbuena
Williams Salazar
María Isabel Vera
Doris Barrera
Maryury Borrero
Ángel Valentín Molina
Luis Javier Martínez
Juan Salazar
Elkin Gelvez
Yudith Contreras
Frank Saenz
Miguel Vera m.avera@unisimonbolivar.edu.co
Yoleidy Huérfano
Carlos Hernández
Oscar Valbuena
Williams Salazar
María Isabel Vera
Doris Barrera
Maryury Borrero
Ángel Valentín Molina
Luis Javier Martínez
Juan Salazar
Elkin Gelvez
Yudith Contreras
Frank Saenz
Volumetry of epidural hematomas in computed tomography images: Comparative study between linear and volumetric methods
Revista Latinoamericana de Hipertensión, vol. 13, no. 4, pp. 339-343, 2018
Sociedad Latinoamericana de Hipertensión
Abstract: This work evaluates the performance of some methods employed for assessing the volume of seven subdural hematomas (EDH), present in multi-layer computed tomography images. Firstly, a reference volume is considered to be that obtained by a neurosurgeon using the manual planimetric method (MPM). Secondly, the volume of the 7 EDHs is obtained considering both the original version of the ABC/2 method and two of its variants, identified in this paper as ABC/3 method and 2ABC/3 method. The ABC methods allow for calculation of the volume of the hematoma under the assumption that the EDH has an ellipsoidal shape. In third place, an intelligent automatic technique (SAT) is implemented that generates the three-dimensional segmentation of each EDH and from it the volume of the hematoma is calculated. The SAT consists of the pre-processing, segmentation and post-processing stages. In order to make judgments about the performance of the SAT, the Dice coefficient (Dc) is used to compare the dilated segmentations of the EDH with the EDH segmentations generated manually. Finally, the percentage relative error is calculated as a metric to evaluate the methodologies considered. The results show that the SAT method exhibits the best performance generating an average percentage error of less than 2%.
Keywords: ABC Methods, Automatic Intelligent Technique, Segmentation, Volumetry of epidural hematomas.
INTRODUCTION
In the clinical context, the use of digital brain neuroimaging allows the diagnosis, approach and monitoring of diseases that affect the anatomy and/or physiology of the human brain. Of special interest for the present work is the pathology called epidural hematoma (EDH). Normally, EDH are caused by physical trauma that causes the laceration of the middle meningeal artery or one of its branches and can be defined as an intracranial hemorrhage or accumulated blood that forms above the dura mater membrane that surrounds the brain1. Depending on several factors, EDH can both increase intracranial pressure and produce a deviation of the midline of the brain2.
Additionally, it is important to note that digital brain neuroimages are accompanied by imperfections such as noise3,4 and artifacts5. When computational segmentation strategies are oriented towards the generation of the morphology (normal or abnormal), and implemented for both the cerebral anatomical structures and space-occupying lesions, such as epidural hematomas6, these imperfections become real challenges.
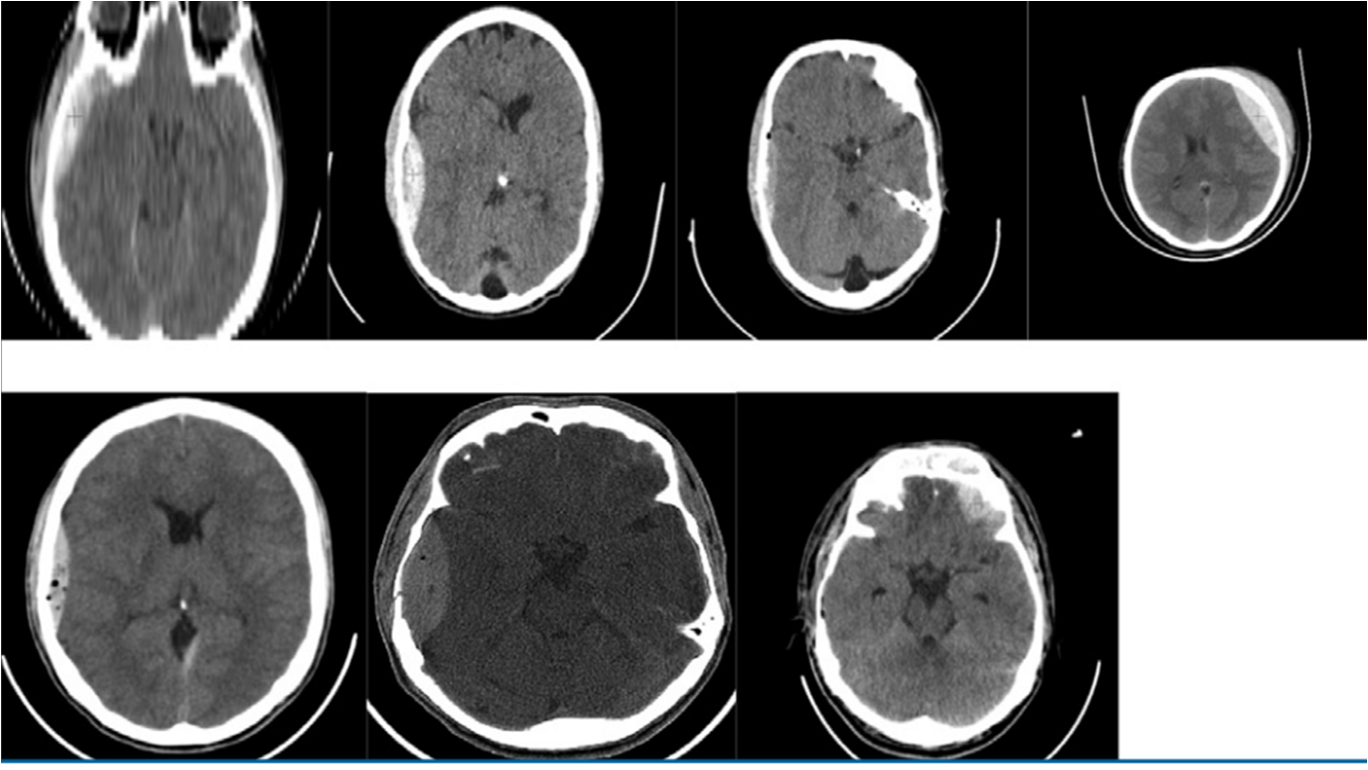
Figure 1.
A red cross pinpoints the EDH in each of the databases considered, Imperfections (noise + artifact) are also seen in cerebral MSCT images
As a matter of fact, the most relevant attribute or predictor of an EDH is its volume. The reason for this attribute to be so important is that its numerical value defines, in large measure, both the prognosis for the patient and the behavior to follow in addressing their condition7. Due to this, some methodologies oriented towards the estimation of the said predictor have been reported in literature. Some of those methodologies are described below. Hu et al.7, compare the planimetric method, assisted by computer, with the ABC / 2 method when generating the volume of 35 EDH, present in images of MSCT. They claim that the ABC / 2 method overestimates the value of the volume in question. Yan et al.8, compare the planimetric method, assisted by computer, with four variants of the ABC method when generating the volume of 53 EDH, present in images of MSCT. They assert that the variant of the ABC method based on a linear regression is the one that exhibits the best correlation with the planimetric method, which is considered as reference.
This article constitutes an extension of the work presented in6. The main contributions of the present work are: a) The use of an intelligent automatic technique (SAT) to calculate the volume of the ICH, present in 7 databases formed by three-dimensional brain images of MSCT. This technique considers the stages of pre-processing, segmentation and post-processing. These stages are subject to a validation process that uses the Dice coefficient for comparison of EDH segmentations obtained automatically and manually6. b) To consider the percentage relative error (PrE) to perform a comparative study between the ABC methods and the SAT method, in such a way that their performance can be established when they yield the volume of the EDH (Av).
In such comparison, the one obtained by the manual planimetric method (MPM), applied by a neurosurgeon, is taken as the reference volume (Rv). The percentage relative error is calculated using the mathematical model given by equation 1
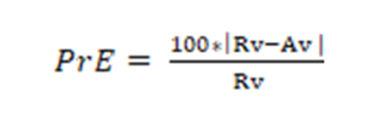 [Equation 1]
MATERIALS AND METHODS
Description of the Data Bases used
The databases (DB) used were supplied by the Central Hospital of San Cristóbal-Táchira-Venezuela. They were acquired through the MSCT modality and consist of three-dimensional images (3D), corresponding to the anatomical structures present in the head of 7 male patients. Their numerical characteristics are presented in table 1.
| DB Label | Number of voxels | Voxel Dimensions (mm3) | Type of Tomograph | Age (years) |
| DB1 | 512x512x40 | 0.4883 x 0.4883 x 3.7200 | *GE Light Speed VCT IRIS | 21 |
| DB2 | 512x512x40 | 0.4375 x 0.4375 x 3.1123 | Siemens Spirit CT84299 | 28 |
| DB3 | 512x512x29 | 0.4668 x 0.4668 x 5.3571 | *GE Light Speed VCT IRIS | 26 |
| DB4 | 512x512x40 | 0.5098 x 0.5098 x 3.5282 | *GE Light Speed VCT IRIS | 21 |
| DB5 | 512x512x25 | 0.3906 x 0.3906 x 4.8380 | Siemens Spirit CT84299 | 22 |
| DB6 | 512x512x40 | 0.6191 x 0.6191 x 3.2456 | *GE Hi Speed DUAL CT | 19 |
| DB7 | 512x512x18 | 0.2148 x 0.2148 x 5.0000 | *GE Light Speed VCT IRIS | 13 |
As Table 1 shows, high variability in the size of the voxel is observed and we are in the presence of a group of 7 patients whose age ranges between 13 and 28 years. In addition, the identification of the scanners allows the inference about the robustness of the proposed technique in the face of inter-scanner variability. In order to complement and validate the study, manual segmentations are available, generated by a neurosurgeon, corresponding to the hematomas present in the seven DBs. These segmentations represent the ground truth that will serve as a reference to validate the results linked to the segmentation.
Smart Automatic Technique (SAT) for the segmentation of EDHs.
By means of figure 2, a schematic diagram is presented that synthesizes the computational algorithms that make up the SAT. For a detailed description of the SAT, reference (6) should be reviewed, since as indicated above, this article is an extension of that work.
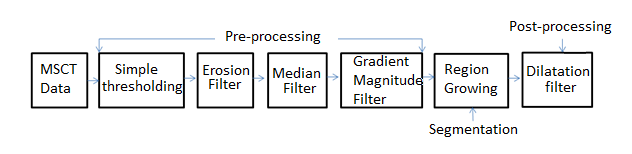
Figure 2.
Block diagram of the intelligent automatic technique proposed in 6.
It is also necessary to point out that the Dice coefficient (Dc) 3 is a metric used to compare segmentations of the same 2D or 3D image, obtained by different methodologies. Usually, in the medical context, the Dc is considered in order to establish how similar in spatial terms, manual segmentation (RD) and automatic segmentation (RP) are, and that generates the morphology of any anatomical structure. Additionally, the Dc is at a maximum when a perfect overlap between RD and RP is reached but it is minimal when RD and RP do not overlap at all. Besides, the values expected for the Dc are real numbers between 0 (minimum) and 1 (maximum). The closer to 1 the value of the Dc is, the better the performance of the procedure that is not manual. The mathematical model that defines the Dc, is given by Equation 2.
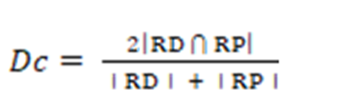 [Equation 2]
Clinical usefulness of the volumes occupied by the hematomas
The main clinical use of the characterization of hematomas by obtaining their volume, lies in the decision to be taken establishing the conduct to address the presence of bruising in a patient. In this sense, patients whose lesions meet any of the following criteria must be taken to surgery9:
1- Lesion located in the anterior or middle cranial fossa with volume greater than 30 cm3.
2- Displacement of the midline (imaginary line between occipital eminence and crista gally) greater than one cm, from its original position.
3- Compression, displacement or occupation of specific areas of the brain (mass effect).
4- Location of the hematoma in the cortical zone.
5- Lesion located in the posterior fossa (cerebellum, stem) with a volume between 10 cm3 and 15 cm3 depending on the clinical presentation of the patient.
Quantification of the hematomas considering the determination of the respective volume
Measuring the volume of bruises is important to define the final conduct facing the process which the patient undergoes. The volume and behavior of the lesion define parameters called ‘surgical criteria’ which are fundamental at the time of treatment.
Obtaining the volumes related to the automatic segmentations
The proposed technique generates the automatic segmentation of the EDH present in each of the 7 databases described. From such segmentations, the volume of the hematoma to be characterized is calculated by multiplying the voxel dimensions by the number of voxels that make up the automatically segmented EDH.
RESULTS
Quantitative results. During the segmentation process, the criterion applied was that the optimal parameters of the algorithms that make up the SAT are those that produce the highest Dc. At the end of the tuning process, a maximum Dc of 0.923 was obtained, which indicates a good correlation between the manual segmentations and those obtained by the SAT. Additionally, table 2 shows that the average value of the Dc obtained for EDH segmentation, using the SAT method, is comparable to that reported in references10,11.
| Authors | Technique | Modality | Average Dc |
| Liao et al. (2010)10 | (MaxF + PF + MRGP + MRLS) | MSCT | 0.9140 |
| Kamnitsas et al(2017)11 | Neural network Convolutions | MSCT | 0.9037 |
| Vera et al. (Technique proposed in the current work) | SAT | MSCT | 0.9023 |
Qualitative results
Figure 3 shows a 2-D view of both the original EDH and the processed versions after applying the SAT technique to one of the DB considered.
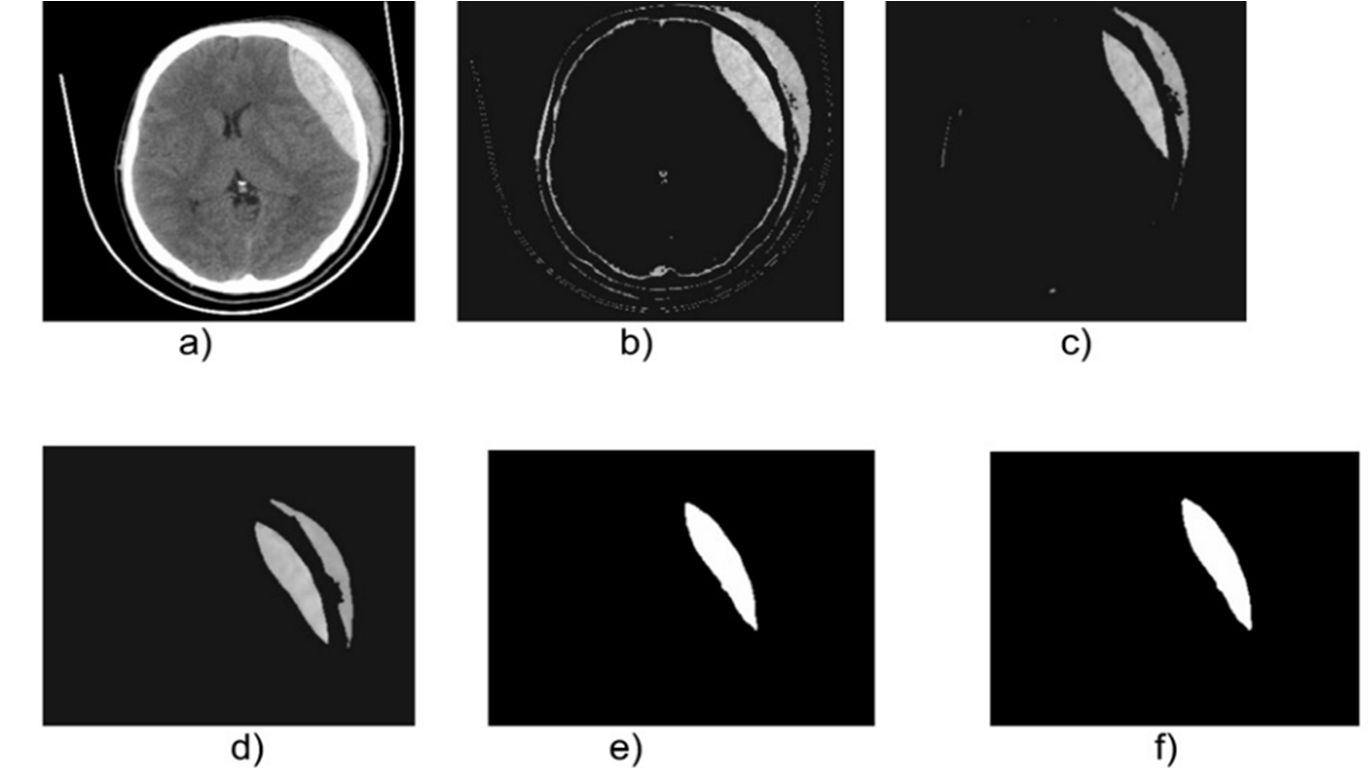
Figure 3.
Cross-sectional view of images belonging to the database identified as DB1: a) Original, b) Thresholdized, c) Eroded, d) Median, e) Segmented, f) Postprocessed with the binary morphological dilation filter.
On the other hand, table 3 shows the values for the volumes calculated for the EDHs i.e. using both the SAT method and the ABC methods considered.
| Volume (cm3) | |||||
| Database | MPM | SAT | ABC/2 | ABC/3 | 2ABC/3 |
| DB1 | 9.17 | 9.546 | 9.98 | 6.65 | 13.30 |
| DB2 | 55.89 | 56.220 | 56.67 | 37.78 | 75.65 |
| DB3 | 56.03 | 56.893 | 57.24 | 38.16 | 76.32 |
| DB4 | 29.84 | 30.689 | 31.40 | 20.90 | 41.87 |
| DB5 | 46.23 | 47.022 | 47.71 | 31.80 | 63.61 |
| DB6 | 64.87 | 65.041 | 65.39 | 43.59 | 87.19 |
| DB7 | 22.91 | 23.485 | 23.93 | 15.95 | 31.90 |
It can be inferred from the information presented in table 3 that SAT, ABC/2 and 2ABC/3 methods yield a good estimate the value of the volume; while the ABC/3 method underestimates it. According to Huttner et al.12, the ABC/3 method has not been validated clinically and, indeed, can exhibit excellent results in cases in which the patient is under anticoagulation, radio and/or chemotherapy.
In addition, table 4 presents the values corresponding to the relative percentage errors related to each of the methods considered.
| Percentage relative error(%) | ||||
| SAT | ABC/2 | ABC/3 | 2ABC/3 | |
| DB1 | 4.10 | 8.83 | 27.48 | 45.04 |
| DB2 | 0.59 | 1.40 | 32.40 | 35.36 |
| DB3 | 1.54 | 2.16 | 31.89 | 36.21 |
| DB4 | 2.85 | 5.23 | 29.96 | 40.32 |
| DB5 | 1.71 | 3.20 | 31.21 | 37.59 |
| DB6 | 0.26 | 0.80 | 32.80 | 34.41 |
| DB7 | 2.51 | 4.45 | 30.38 | 39.24 |
| Average PercentageRelative error (%) | 1.94 | 3.72 | 30.88 | 38.31 |
According to table 4, it can be attested that the SAT method generates the best average percentage relative error (PrE). In addition, the ABC methods exhibit the best performance in ABC/2, although in small volume hematomas they tend to produce higher errors. This may be due to the fact that this method is based on the hypothesis that the EDH has an ellipsoidal shape and according to12, this is not always the case (see, additionally, figure 4).
At this point it is important to remember that the main surgical utility of the determination of EDH volumes is that they define, in a high percentage, the conduct to be followed regarding the patient. In this sense, if only volume is considered, hematomas that exceed the threshold of 30 cm. are susceptible to surgery. Following this criterion, and considering the volume figures arrived at by the MPM and those derived from the SAT method, which yielded the lowest Erp, no patient is a candidate for surgery.
CONCLUSIONS
Regardless of the type of scanner with which the images of cerebral tomography were acquired, in the present work, the technique developed allowed the successful segmentation of all the hematomas present in the 7 databases considered. This is an indication that the aforementioned computational technique, based on intelligent operators, is robust support for assessing inter-subject and inter-scanner variability.
In general, it can be said that the main characteristic of ABC methods is their simplicity and efficiency, although their performance, in many concrete situations, is not always the best option. In this sense, the fulfillment of the geometric hypothesis that an EDH has an ellipsoidal shape represents the main limitation of these methods, especially when it comes to patients who have EDH with no definite shape, relatively small and/or large volume. However, when the EDH complies with the aforementioned hypothesis, these methods have an acceptable performance and, in particular, the ABC/2 method has a good standing, since it has been clinically validated, while its variants do not yet fulfill that condition.
Additionally, a number o works have verified that these methods have an additional disadvantage in the feature of of being operator-dependent. In the context of the present work, we have used an intelligent automatic technique (SAT) whose tuning allows the precise segmentation of the EDH, present in computed tomography images. This statement is based on the fact that the Dc obtained is comparable with that reported in the literature. The segmentations generated, automatically, by the SAT allows for the calculation of the volume of each EDH in a precise and efficient manner. This volume is vital to address the treatment of a hematoma that affects the health status of a patient and helps in the decision whether or not it should be surgically treated.
Because the SAT method generated the lowest average percentage error, which did not exceed 2%, it can be said that the performance of the SAT method surpasses the value of the ABC methods considered. In part, this is due to the fact that the SAT does not assume any geometric consideration when it generates the volume of an intracerebral hematoma.
ACKNOWLEDGEMENTS
The authors are grateful for the financial support given by the Universidad Simón Bolívar-Colombia through the 2016-16 code project.
REFERENCES
1. Stippler M. Craniocerebral trauma. In: Daroff RB, Jankovic J, Mazziotta JC, Pomeroy SL, eds. Bradley's Neurology in Clinical Practice. 7th ed. Philadelphia, PA: Elsevier; 2016:chap 62.
2. Mezzadri J., Goland J., y Sokolvsky M. Introducción a la Neurocirugía. Capítulo: Patología vascular II. Ediciones Journal. Segunda edición. 2011.
3. Vera M. Segmentación de estructuras cardiacas en imágenes de tomografía computarizada multi-corte. Ph.D. dissertation, Universidad de los Andes, Mérida-Venezuela, 2014.
4. Maiera A, Wigstrm L, Hofmann H, Hornegger J, Zhu L, Strobel N, Fahrig R. Three-dimensional anisotropic adaptive filtering of projection data for noise reduction in cone beam CT. Medical Physics. 2011;38(11):5896–909.
5. Kroft L, De Roos A, Geleijns J. Artifacts in ECG–synchronized MDCT coronary angiography. American Journal of Roentgenology.2007;189(3):581–91.
6. Vera M., Huérfano Y., Contreras J., Vera M. I., Salazar W., Vargas S., Chacón J. y Rodríguez J. (2017). Segmentación de hematomas epidurales, usando una técnica computacional no lineal en imágenes de tomografía computarizada cerebral. Archivos Venezolanos de Farmacología y Terapéutica Volumen 36(6), 162-167.
7. Hu T., Yan L., Yan Peng., Wang X., Yue G. Assessment of the ABC/2 Method of Epidural Hematoma Volume Measurement as Compared to Computer-Assisted Planimetric Analysis. Biological Research for Nursing. 2016, 18(1) 5-11.
8. Yan P, Yan L, Hu T, Zhang Z, Feng J, Zhao H. (2016) Assessment of the accuracy of ABC/2 variations in traumatic epidural hematoma volume estimation: a retrospective study. PeerJ 4:e1921https://doi.org/10.7717/peerj.1921
9. Freeman, W., Barrett, K., Bestic, J.,Meschia, J., Broderick, D., Brott, T. Computer-assisted volumetric analysis comparedwith ABC/2 method for assessing warfarinrelated intracranial hemorrhage volumes. 2008, Neurocritical Care, 9, 307–312.
10. Liao C., Xiao F., Wong J., Chiang I. Computer-aided diagnosis of intracranial hematoma with brain deformation on computed tomography. Computerized Medical Imaging and Graphics 34 (2010) 563–571.
11. Kamnitsas K., Lediga C., Newcombeb V., Simpsonb J., Kaneb A., Menonb D., Rueckerta D., Glockera B. Efficient Multi-Scale 3D CNN with fully connected CRF for Accurate Brain Lesion Segmentation. Medical Image Analysis, Vol 23, pp.1603- 1659, 2017.
12. Huttner H., Steiner T., Hartmann M., Köhrmann M., Juettler E., Mueller S, Wikner J., Meyding U., Schramm P., Schwab S. y Schellinger P. (2006). Comparison of ABC/2 Estimation Technique to Computer-Assisted Planimetric Analysis in Warfarin-Related Intracerebral Parenchymal Hemorrhage. Stroke. 2006;37:404-408.