Abstract: The quality of life (QOL) is constituted as one of the key concepts to define the supports directed to the population with intellectual disabilities (ID). In addition to understanding the significant perceptions that people have about the QoL of the population with ID, it is currently necessary to complement this vision and involve people with ID themselves in the measurements of their QoL.. This study seeks to know the QOL index of 95 Chilean adults with ID from their perceptions and those of other informants; and identify some of the variables that may be conditioning their QOL. To collect the information the INICO-FEAPS scale has been used. This scale is based on the QOL model of Schalock and Verdugo (2002/2003). The results show a considerable disagreement between the QOL reported by people with ID and that reported by other significant informants. When comparing the average QOL index according to the different variables using ANOVA, significant differences were found for both versions only attending to the degree of ID of the participants and the index associated with their needs for support. The results show that both the degree of ID and the level of needs supportive are good predictors of the QOL index. This research showed some suggestions that may be of interest to advance in the evaluation of the QOL of these population. For example, by identifying that the support needs index is a good predictor of QOL as well as the degree of ID, it is suggested to apply both instruments simultaneously, which will allow a better precision for the analysis of this construct.
Keywords: adults, assessment, intellectual disabilities, self-perceptions, quality of life.
Resumen: La calidad de vida (CV) se constituye como uno de los conceptos clave para definir los apoyos dirigidos a la población con discapacidad intelectual (DI). A pesar de los avances en la medición de la CV en personas con DI, aún existe una fuerte tendencia a evaluar el bienestar personal de esta población únicamente desde la perspectiva de las personas de su entorno (familiares, profesionales, etcétera). Esto constituye una desigualdad epistemológica entre personas con y sin DI, por considerar únicamente a las personas sin DI como sujetos idóneos para aportar evidencias e información objetiva sobre su CV. Además de conocer las percepciones que tienen otras personas sobre la CV de la población con DI, actualmente es necesario complementar esa visión e involucrar a las propias personas con DI en las mediciones de su CV. Este es un requisito previo para identificar apoyos y reconocer lo que es importante en sus vidas y entornos. A pesar de la importancia de este constructo para el desarrollo de planes de intervención basados en resultados personales, en el contexto latinoamericano aún existe mucho desconocimiento sobre cómo es la CV de estas personas. Este estudio busca conocer el índice de CV de 95 adultos chilenos con DI a partir de sus percepciones y las de otros informantes; e identificar algunas de las variables que pueden estar condicionando su CV. Para la recogida de la información se ha utilizado la escala INICO-FEAPS, basada en el modelo de CV de Schalock y Verdugo (2002/2003). Esta escala evalúa el nivel de CV de personas con DI a partir de los 18 años. Consta de 72 ítems distribuidos entre las ocho dimensiones del Modelo de CV. La escala tiene dos versiones y permite la recogida de datos de dos fuentes diferentes. Para analizar la normalidad de los datos, se han utilizado las pruebas de Shapiro-Wilk y Shapiro-France. Los resultados muestran una discrepancia considerable entre la CV reportada por las personas con DI y la reportada por otros informantes significativos. A pesar de las diferencias, existe una alta correlación entre los resultados de ambos informes (r = .75). Esto sugiere que tanto los autoinformes como los heteroinformes obtienen mediciones consistentes. Asimismo, el análisis correlacional para las subescalas del cuestionario indica cómo la dimensión de autodeterminación (r = .85) presenta la mejor correlación, mientras que la de bienestar físico (r = .26) obtiene el índice de correlación más bajo. Al comparar el índice de CV promedio, según las diferentes variables mediante ANOVA, se encuentran diferencias significativas para ambas versiones (autoinforme y heteroinforme) solo al atender el grado de DI (p-valor < .00) de los participantes y el índice asociado con sus necesidades de apoyo (p-valor < .00). Para saber en qué medida el grado de DI y el nivel de necesidades de apoyo predicen el índice de CV de los participantes, se ha realizado un análisis de regresión lineal. Para ambas versiones, los resultados muestran que tanto el grado de DI como el nivel de necesidades de apoyo son buenos predictores del índice de CV. Los resultados de esta investigación arrojan algunas sugerencias que pueden ser de interés para avanzar en la evaluación de la CV de la población con DI. Por ejemplo, al identificar que el índice de necesidades de apoyo es un buen predictor de la CV al igual que el grado de DI, se sugiere aplicar ambos instrumentos simultáneamente, lo que permitirá una mayor precisión para el análisis de este constructo.
Palabras clave: adultos, autopercepciones, calidad de vida, discapacidad intelectual, evaluación.
Artículos
Quality of life levels in adults with intellectual disabilities from their perceptions and those of other informants
Calidad de vida en adultos con discapacidad intelectual desde sus percepciones y las de otros informantes
Centro Interamericano de Investigaciones Psicológicas y Ciencias Afines

Esta obra está bajo una Licencia Creative Commons Atribución-NoComercial-CompartirIgual 4.0 Internacional.
Recepción: 24 Mayo 2022
Aprobación: 19 Septiembre 2022
In recent years, the concept of quality of life (QOL) has acquired notable relevance in the field of intellectual disability (ID) (Verdugo et al., 2021). This construct has not only become one of the key concepts for planning support for people with ID and evaluating personal results (Gómez et al., 2013;Simoes et al., 2015). It is also considered one of the main outcomes for the creation and evaluation of public policies in this field (McCarron et al., 2019).
Despite the usefulness of the construct, the multidimensionality that characterizes it has made its operationalization difficult (Sexton et al., 2016). However, some proposals such as the Quality-of-Life Model by Schalock and Verdugo (2002/2003) are widely accepted due to the large empirical evidence that supports their application in the field of ID (Badía, Carrasco et al., 2016; Castro et al., 2017; Simoes et al., 2015). According to this Model, QOL is understood as a desired state of personal well-being that: a) is multidimensional; b) it has universal properties and properties linked to culture; c) has both objective and subjective components, and d) is influenced by personal characteristics and environmental factors (Schalock et al., 2011). In this Model, the QOL construct is made up of eight domains: self-determination; rights; social inclusion; personal development; interpersonal relationships; material well-being; emotional well-being and physical well-being (Schalock & Verdugo, 2002/2003). The relevance of these QOL domains for the life of people with ID has also been empirically and cross-culturally validated (Gómez et al., 2011; Jenaro et al., 2005; Wang et al., 2010).
Despite advances in the measurement of QOL in people with ID, there is still a strong tendency to evaluate the personal well-being of this population only from the perspective or report of the people around them (family members, professionals, etc.) (Chowdhury & Benson, 2011; Vega et al., 2020). This constitutes an epistemological inequality between people with and without ID, considering only people without ID as suitable subjects to provide evidence and objective information on their QOL (Knüppel et al., 2018a).
In addition to knowing the perceptions that significant people have about the QOL of the ID population, it is currently necessary to complement that vision and involve people with ID themselves in measurements of their QOL (Álvarez-Aguado et al., 2021). This is a prerequisite for identifying supports and recognizing what is important in their lives and environments (Claes et al., 2012). In fact, the results of some studies on the differences in the perception of QOL between the own person with ID and that reported by others have been contradictory. On the one hand, several investigations have shown that people with ID estimate their QOL higher than when they assess their parents or professionals (Claes et al., 2012; White-Koning et al., 2007). On the contrary, other studies (McVilly et al., 2000;Schmidt et al., 2010) provide evidence of a moderate to strong association between a self-report and information provided by others. This disparity between the perspectives of people with ID and those of other informants regarding their QOL is appreciated above all in dimensions such as social inclusion, interpersonal relationships, and self-determination. In all of them, the reports of the people with ID themselves show lower levels than the reports of other informants.
However, these discrepancies should not be understood as an inappropriate result, but its study should provide valuable information for the improvement of the planning and organization of services for people with ID (Balboni et al., 2013;Ikeda Hinckson & Krägeloh, 2014; Knüppel et al., 2018b). However, these reports are not interchangeable and must be analyzed separately (Verdugo et al., 2005).
Precisely, based on the QOL Model (Schalock & Verdugo, 2002/2003), different instruments have been created to evaluate QOL in people with ID from the perspective of the people themselves and from the perspectives of other significant informants. Among the most relevant instruments in the literature are: (a) Integral QOL Scale (Verdugo et al., 2009) and INICO-FEAPS Scale (Verdugo et al., 2013), both aimed at evaluating QOL in adults with ID; (b) San Martín Scale (Verdugo et al., 2013) aimed at assessing the QOL level of people with ID and great support needs, and (c) FUMAT Scale (Verdugo, Gómez & Arias, 2009), aimed at assessing QOL in aging people with ID.
In addition to estimating the levels of QOL in the population with ID, the progressive application of these scales shows how some variables influence the QOL of these people. For example, when comparing the QOL according to the level of disability, people with mild or moderate ID have a better QOL (Gómez et al., 2015). Likewise, people who have a job or work occupation, regardless of the modality, experience higher average levels in QOL than those who do not work (De Jesús et al., 2014). Similarly, people with ID who live in neighborhoods or small neighborhoods present greater satisfaction with their QOL than those who reside in cities or environments with more inhabitants (Emerson et al., 2013). Other studies identify differences in the QOL of this population according to their health status, their financial situation, and their participation in community activities (Lucas-Carrasco & Salvador-Carrulla, 2012; McFerran & Shoemark, 2013).
Although the use of these scales at the international level, particularly in some European countries, has been notorious in the last decade, in the Latin American context there are still very few publications that account for the results of the evaluation of QOL levels in people with ID, and the factors that can condition these levels (Córdoba et al., 2016;Henao et al., 2015). Starting from this premise, the purpose of this research focuses precisely on (a) analyzing the QOL levels of a group of adults with ID in the Chilean context, from their perceptions and those of other significant informants; and (b) identify some of the variables that may be conditioning the QOL of these people. This will allow planning and providing the necessary support to guarantee the well-being of the population with ID and the development of good lives. Based on these objectives, this work assumes the following hypotheses: a) there are significant differences in the QOL levels of people with ID according to the perceptions between the people themselves and those of other informants, and (b) both from the perspective of people with ID themselves as well as other informants, the development of quality of life in this population is hindered by contextual and personal factors.
It was an invited sample of 95 people with ID between the ages of 18 and 39 (M = 28.46; SD = 5.59) (table 1). The majority were men (n = 71) with severe ID (n = 44).The majority had a lower-middle socioeconomic level (n = 82). All the participants were users of three disability care associations located in the Metropolitan Region and in the Valparaíso Region (Chile). Four inclusion criteria were used to select the sample: 1) having a diagnosis of ID according to the DSM-4 standards; 2) being 18 or older; 3) have reading comprehension skills to be able to autonomously complete the questionnaire or, 4) in case of not having reading skills, show oral comprehension skills to understand the content of the different items on the scale, applied through a semi-structured interview.
Table 1.
Sociodemographic data of the participants
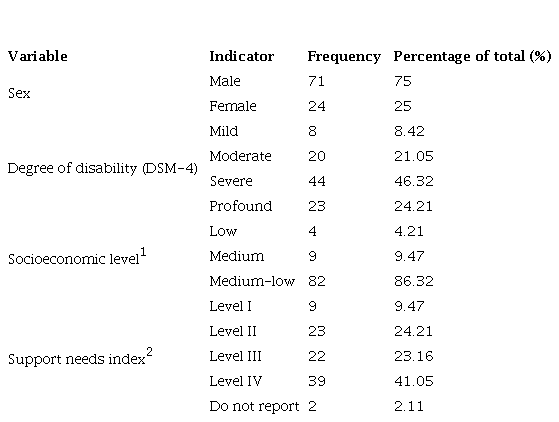
Socioeconomic level is understood as the set of economic, sociological, educational and labor variables by which an individual or a group is qualified within a social hierarchy. In Chile, the Ministry of Social Development and Family establishes four categories (from highest to lowest level) to classify socioeconomic status: high, medium, medium-low, and low. The information of the participants on the socioeconomic level has been provided by the institutions participating in this research.
2The information on the participants' Support Needs Index has been compiled by applying the Support Intensity Scale (SIS). The information of the participants on the index of support needs has been provided by the institutions participating in this research.
The INICO-FEAPS Quality of Life (QOL) scale was used (Verdugo et al., 2013). This scale assesses the QOL level of people with ID from the age of 18. It consists of 72 items distributed around the eight dimensions of the QOL Model (Schalock & Verdugo, 2002/2003). The scale has two versions and allows the collection of data from two different sources: 1) “self-report” version, which is completed by the person with ID when they have the comprehension or expression skills necessary to answer the questions; 2) “other-report” version, which is completed by a professional or other informant who has known the person with a disability well for at least 3 months. In this study, the application of “self-reports” was carried out in a semi-structured interview format using easy language and visual aids. This in order to guarantee the understanding of the elements and facilitate the expression of the answers. In the case of people with more severe ID, in the process of applying the instrument significant informants were present for them (especially family members) who support the research team in interpreting their answers.
The response options for all items are structured on a 4-point Likert-type scale (from “never” to “always”). The QOL index is obtained by calculating the standard scores for each of the eight subscales of the instrument according to the scales included in the scale. Thus, higher scores indicate better QOL and personal well-being. The instrument has shown to have good psychometric properties in its various cross-cultural validations (Gómez et al., 2015; Knüppel et al., 2018b). In this study, the internal consistency of the scale was satisfactory in both the other-report version (α = .955) and the self-report version (α = .971).
On the other hand, the index of support needs of each of the participants has been obtained through the application of the Support Intensity Scale (SIS) (Verdugo et al., 2007). This index classifies support needs in four consecutive levels that go from least to greatest dependency. On this scale, from three dimensions, the supports that a person needs in 57 activities of their life are measured, referring to the areas of: home life; community life; lifelong learning; employment; health and safety; social interaction; and protection and defense. Each activity is evaluated according to parameters of frequency, daily support time and type of support. It is applied in a semi-structured interview format, preferably to one or more people who know the adult with an intellectual disability well. In this study, the information related to the index of support needs of the participants was provided by the institutions that provided the sample, who for internal interests outside the context of this research, previously applied the SIS (one month before) to their users. The application of this scale has also given high rates of reliability and validity (α = .906).
After the approval of the bioethics committee of the university (BIOEPUCV-H 361-2020), the review of the II National Study on Disability (ENDISC, 2015) made it possible to collect the characteristics of the Chilean entities dedicated to providing support to people adults with ID. To update the data, the 2020 Disability Advisory Council Act, published monthly by the National Disability Service, was consulted. Finally, three institutions accepted the invitation to participate in this research. These entities had some specific characteristics: a) they developed specific programs to support independent living; b) they carried out actions aimed at promoting the autonomy of users, and c) they based their interventions on a rights-based approach. The types of institutions that contributed the sample were: a residence in which the participants lived permanently (n = 81), a day center where they went to carry out leisure activities (n = 7), and occupational centers in which they develop personal and professional training programs (n = 7). The scale implementation process was developed according to the availability of the centers that agreed to join the study. A member of the research team handling the instrument supervised the process of applying the self-report version (n = 34) and the other-report version of the scale (n = 95). Finally, the researchers refrained from using neuropsychological tests to assess the decision-making capacity of people with ID and chose to adapt the informed consent process to their characteristics and needs. This process was structured in three stages: presentation of the research objectives, impact of the research on their lives, and implications derived from the participation in the research. These three stages were carried out through informational workshops in each of the institutions that accepted the invitation. The information obtained after the application of the instrument was codified in an anonymous and encrypted database protected by the responsible investigator.
A non-experimental quantitative study of descriptive and cross-sectional scope is presented. The original scales of the information collection instruments were used to carry out the analytical process. To analyze the normality of the data, the Shapiro-Wilk and Shapiro-France tests were used. When there was no normality in the data, transformations with natural logarithm and ln-K were tested. To compare the QOL index of the self-report and the other-report with the standard values of the questionnaire, variance comparison tests were used following a chi-square distribution with l-n degrees of freedom for the numerator. Variance comparison tests were also used to compare the variances between the self-report and other-report versions but following an F distribution with nx - 1 y ny - 1 degrees of freedom. To contrast the means with the standard values, the Student's T test was used for one sample, and the same test for independent samples when the comparison was made between the questionnaires. The differences have been considered significant with p-value < .050. Finally, correlation analysis was used to contrast the results of both questionnaires and simple linear regression models were proposed independently considering the influence of the variables "support needs index" and "degree of ID".
Quality of Life Index
The average calculation of the QOL index is higher in the self-reports (M = 98.53; Percentile = 45) than in the other-reports (M = 83.63; Percentile = 13). Similarly, the results of the normality tests show a non-normal distribution among the dimensions of the construct. This shows the existence of underlying factors that are intervening in the QOL index.
To delve into the results, the descriptive statistics have been analyzed in each of the dimensions that make up the scale. In the self-reports, the highest averages are associated with the dimensions of self-determination (M = 10.92) and social inclusion (M = 10.82). On the contrary, the dimensions with the lowest scores are rights (M = 8.88) and physical well-being (M = 8.94). In the self-reports, among the items with the lowest average score are those that refer to the difficulty of maintaining sex-affective relationships (M = 2.59), the use of public transport autonomously (M = 2.24), the desire to constant crying by the participants (M = 2.68) and the lack of explanation about what their rights are (M = 2.21).
In the case of the other-reports, the highest means are obtained by the dimensions of physical well-being (M = 8.89) and interpersonal relationships (M = 8.31). However, the lowest averages are associated with the dimensions of material well-being (M = 6.51) and personal development (M = 6.98). The items with the lowest average scores among the other-reports have to do with the handling of one's own money (M = 1.45), the assessment of the possible consequences before making a decision (M = 1.60), the contact with the people who appreciate (M = 1.78) or satisfaction with what he can do in the future (M = 1.83). Table 2.
Table 2.
Main statistics and normality analysis
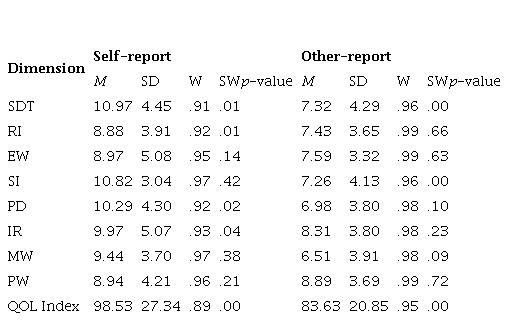
Note:
SDT: self-determination; RI: rights; EW: emotional well-being; SI: social inclusion; PD: personal development; IR: interpersonal relationships; MW: material well-being; PW: physical well-being; QOL Index: quality of life index
When comparing the means associated with the QOL index between self-reports and hetero-reports, statistically significant differences were found in their means (p-value < .01) and variances (p-value < .04). Despite the differences, there is a high correlation between the results of both reports (r = .75). This suggests that both self-report and other-reports obtained consistent measures, achieving similar results with a constant difference for each informant profile. Likewise, the correlational analysis for the subscales of the questionnaire indicates how the self-determination dimension (r = .85) presents the best correlation, while that of physical well-being (r = .26) obtains the lowest correlational index.
Likewise, the comparative analysis of means between self-reports and other-reports for each of the subscales applying Student's t test shows significant differences in the dimensions of self-determination (p-value < .00), social inclusion (p-value < .00), personal development (p-value < .00), interpersonal relationships (p-value < .04) and material well-being (p-value < .00).
To continue delving into the results, the averages associated with the QOL index for self-reports and other-reports have been analyzed according to sociodemographic variables such as sex, degree of ID, the index of support needs or socioeconomic level (Table 3). In both versions (self-report and other-report), participants with a mild degree of disability, a medium socioeconomic level, and an index of support needs of Level I presented higher averages with respect to their QOL.
Table 3.
Means associated with the QOL index according to some sociodemographic variables
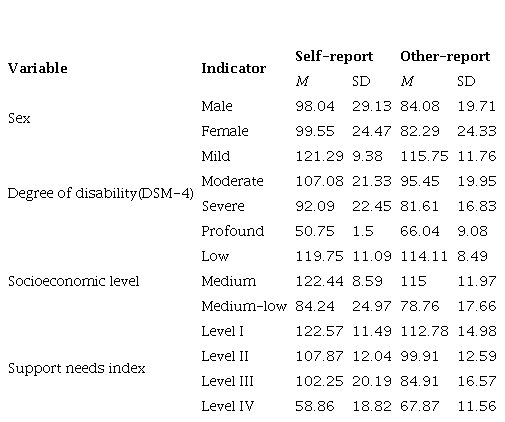
When comparing the average QOL index according to the different variables using ANOVA, significant differences were found for both versions (self-report and other-report) only attending to the degree of ID (self-report: p-value < .00; η² 0.57119; IC 0.27-0.69 and other report: p-value < .00; η² 0.44887; IC 0.28-0.55) of the participants and the index associated with their needs for support (self-report: p-value < .00; η² 0.72621; IC 0.49-0.80 and other-report: p-value < .00; η² 0.59241; IC 0.45-0.67). The post hoc contrast calculation indicates how, for self-reports, the differences in the QOL index according to the degree of ID occur between the groups: mild-severe, mild-profound, moderate-severe, and severe-profound. For other-reports, the differences in the QOL index and the different degrees of ID occur between all groups (Table 4). A high and inverse correlation is observed between both variables both in the analysis of the self-reports (r = -.714) and the other-reports (r = -.667). That is, the lower the degree of ID, the higher the QOL index. Table 4
Table 4.
Post hoc contrasts for the QOL index according to the degree of ID (DSM-4)
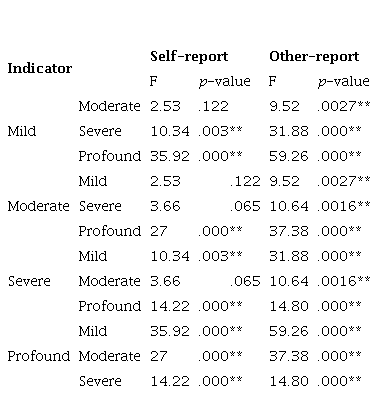
* p-value .05; **p-value .00
*p-value < .05; **p-value < .00
Regarding the support needs index, the post hoc contrasts for the self-report show significant differences in QOL levels between all groups except for the combinatorial Level II and Level III. In the case of the hetero report, differences were found between all groups (Table 5). In both self-reports (r = -.811) and other-reports (r = -.768), the correlational analysis between the QOL index and the level of need for support shows a high and inverse relationship: the higher the level of need for support, the lower the QOL index.
Table 5.
Post hoc tests for the QOL level according to the support needs index
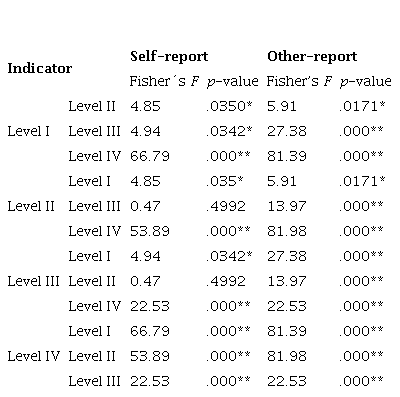
* p-value .05; **p-value .00
*p-value < .05; **p-value < .00
To know to what extent the degree of ID and the level of support needs predict the index of QOL of the participants, a linear regression analysis has been carried out. For both versions, the results show that both the degree of ID (self-report: p-value < .00; adjusted R2 = .495; other-report: p-value < .00; adjusted R2 = .4398) and the level of needs supportive (self-report: p-value < .00; adjusted R2 = .647; other-report: p-value < .00; adjusted R2 = .5859) are good predictors of the QOL index.
On the other hand, no significant differences were found when comparing the QOL index according to the sex of the participants. However, differences have been found in both versions (self-report and other-report) based on sex in some of the items of the instrument. For example, in the self-reports, the average related to the person's own participation in the design of their life plan (item 10; p-value: .006) is higher in men (M = 3.74) than in women (M = 2.55). In the case of the other-reports, statistically significant differences are found between the means of various items: "receives the support they need to do their homework well" (item 33; p-value = .009); “Their abilities and skills are recognized” (item 35; p-value = .037); “They have an individual program adapted to their preferences” (item 38; p-value = .0054); “They are provided with training activities that promote their autonomy” (item 39; p-value = .0047); and "performs sports or leisure activities" (item 67: p-value = .0189). In all cases, men have higher scores than women.
Unlike other studies (Córdoba et al., 2016; Schmidt et al., 2010) this research has verified the existence of significant disagreement between the perceptions of those of people with disabilities themselves about your QOL and those of other informants. The high degree of disagreement between the assessments of the people with ID themselves and those of other informants can make it difficult to provide the support necessary to guarantee good lives among this population (Badía et al., 2016). In this regard, the profile of the person responding as “other informant” may need to be defined more precisely.
Regarding the general QOL index reported both by the participants with ID and by the other informants, the results show low levels of QOL in relation to the reference population. This study finding does not support previous research results that have shown that the QOL of adults with ID is good (Badía et al., 2013; Gómez-Vela et al., 2002).
As in other studies (Balboni et al., 2013; Crocker et al., 2015; Vega et al., 2013), in this research people with ID have been shown to have better perceptions of their QOL than other informants significant to them. Specifically, the differences between both informants are found mainly in the dimensions of self-determination, social inclusion, personal development, interpersonal relationships, and material well-being. All of them have been better valued by the people with ID themselves than by other informants. It seems possible that these results may be due to the healthcare service model where people with ID in this study are treated, a model that does not promote or facilitate the application of the current multidimensional QOL paradigm.
These findings partially coincide with the results of other studies. As in this research, a study dedicated to analyzing QOL in aging people with cerebral palsy (Badía et al., 2013) has shown that evaluations on levels of self-determination and personal development receive the worst scores from external informants. Similarly, in line with the present study, investigations such as those of Claes et al. (2012) and Balboni et al. (2013) have also found higher scores in self-reports in the dimensions of personal development, social inclusion, interpersonal relationships, emotional well-being, and physical well-being.
One of the main contributions of this study is that it suggests a relevant relationship between QOL and degree of ID. In this research, participants with more severe disabilities have lower QOL than their peers with milder disabilities. These results agree with other investigations (Aja et al., 2014; Knüppel et al., 2018a). However, although research shows an important association between QOL and degree of disability, this relationship is complex and may not be significant when other factors are considered (Verdugo et al., 2021). For example, some studies identify that the development of skills intrinsically related to personal well-being, such as the recognition of one's own strengths or the ability to solve common problems, are more frequent among people with severe ID (Álvarez-Aguado et al., 2021). It is necessary to continue deepening the link between the degree of ID and the QOL of this population to be able to anticipate the appropriate supports that make it possible to compensate for personal limitations and enhance existing capacities.
Some studies show how QOL for people with milder disabilities is associated with promoting independent living or increasing community participation (Wehmeyer et al., 2013). However, a quality life for people with severe disabilities is related to the management of disruptive behaviors (Ali et al., 2012). It is necessary to pay attention to this trend because it could condition the way of planning support for this population.
Another of the great contributions of this research is that it shows how the index of support needs of people with ID is related to their QOL. In this study, people with a higher index of support needs, that is, with a higher degree of dependency, presented worse results in the evaluation of their QOL levels. Generally, differences between QOL levels have been identified based on the type of support that people with ID receive (Ahlström et al., 2020; Jones et al., 2018). To date, no studies have been found that corroborate or refute the incidence of intensity or frequency of support received with QOL levels. However, a new paradigm has recently been defined in the field of disability that suggests the integration between the QOL Model (Schalock & Verdugo, 2002/2003) and the Support Needs Model (Thompson et al., 2010). By integrating both approaches into one, it is understood that organizations and professionals, together with managers in administrations, now have an even more powerful catalyst to achieve positive changes in policies and practices that improve the QOL of people with ID and their families (Verdugo et al., 2021).
The results of this research showed some suggestions that may be of interest to advance in the evaluation of the QOL of the population with ID. For example, by identifying that the support needs index is a good predictor of QOL as well as the degree of ID, it is suggested to apply both instruments simultaneously, which will allow a better precision for the analysis of this construct. One of the elements that can favor this type of implementation is aimed at a possible reduction of elements that facilitates the application of both instruments in less time, without losing statistical reliability; and as it is evident that groups according to degree of ID behave differently, it is relevant to develop strategies and support for an improvement in the QOL of this more sectorized type of population, and with this a particular review of the indicators that may contribute to this type of analysis.
Despite its contributions, this study also has some limitations. First, the results are not generalizable because the participants were recruited using intentional sampling. Secondly, during the process of applying the INICO-FEAPS scale, in the case of people with more severe ID, significant informants were present for them who supported the research team in the interpretation of their answers. However, this mediation in some cases could be considered a bias. This study should also consider the use of qualitative evidence gathering techniques as a complement to the quantitative assessment. Third, the scales used to assess the levels of QOL and the support index of the participants were those of the original application of the instruments (with Spanish population). At present there are no scales on both instruments in the Chilean population, which invites us to be cautious with the interpretation of the results. Fourth, the index of support needs was provided by the institutions participating in this research as one more sociodemographic data. Although the researchers had access to the results and the bioethical safeguard report, they were not present in the process of applying the instrument. Finally, in this study the DSM-4 criteria were taken into account to classify levels of disability. Although in Chile adaptive behavior is recognized as a key element to diagnose ID (as the DSM-5 makes explicit), there are currently no standardized scales to evaluate adaptive behavior as part of the diagnostic process.
There is a considerable degree of disagreement between the QOL reported by and by people with ID themselves and that reported by other significant informants. The self-reports show higher scores in all the dimensions of the construct than the other-reports. The differences between the perceptions of people with ID themselves and those of other informants are especially significant in the dimensions of self-determination, social inclusion, personal development, interpersonal relationships, and material well-being. Likewise, only the degree of disability and the level of support needs of the participants are predictive variables of QOL, both from the perspective of the people themselves and from that of other informants. This study has shown that the more severe the disability and the greater the intensity of support the person needs, the lower their QOL index.
redalyc-journal-id: 180
* p-value .05; **p-value .00
* p-value .05; **p-value .00
