Scientific article
Comparing land use mix measures for different urban areas: an application in a Brazilian city
Comparando métricas de uso misto do solo para diferentes áreas urbanas: aplicação em uma cidade brasileira
 Larissa Casaril da Fontoura larissa.fontoura@uel.br
Milena Kanashiro mrurbano@uel.br
Mariana Ragassi Urbano milena@uel.br
Larissa Casaril da Fontoura larissa.fontoura@uel.br
Milena Kanashiro mrurbano@uel.br
Mariana Ragassi Urbano milena@uel.br
Comparing land use mix measures for different urban areas: an application in a Brazilian city
urbe. Revista Brasileira de Gestão Urbana, vol. 17, e20230301, 2025
Pontifícia Universidade Católica do Paraná
Received: 18 August 2023
Accepted: 15 January 2025
Abstract: Land use mix (LUM) is considered a potential for walking, as it reduces the time and distance between origin and destination. However, the strategy to measure the land use mix is still uncertain in urban studies. Thus, this study aims to compare strategies for measuring land use mix in Brazilian cities. For this purpose, three conceptually distinct measures were applied: Entropy Index, Mixed-Use Index, and Destination Count (DC). The overlapping of land use and walking trips maps defined the segments for delimiting the analysis areas. The data aggregation units were 400, 600 and 800m street network buffers. The results reveal significant variation in LUM measurement strategies across different urban areas, with the highest Entropy Index found in the historic central area and significant DC values in the most recent neighborhoods. The MXI had satisfactory results in showing the balance between uses and offers relevant information about the characteristics of the mix. The study also demonstrates that in Cambé the mix covers smaller areas and is more intense within a 400 m radius. These findings may help future research define an appropriate LUM measure based on the type of mix identified in the study context.
Keywords: Built Environment, Active Transportation, Diversity.
Resumo: O uso misto do solo (UMS) é considerado um potencial incentivador da caminhada por encurtar tempo e distâncias entre origem e destino. No entanto, ainda há divergências sobre a maneira de medir a mistura dos usos nos estudos urbanos. Assim, esta pesquisa tem como objetivo comparar estratégias de mensuração do uso misto em cidades brasileiras. Para isso, foram aplicadas três métricas conceitualmente distintas: Índice de Entropia, Índice de Uso Misto e Contagem de Destinos (CD). A sobreposição de mapas de uso do solo e de viagens a pé definiram os segmentos para delimitação das áreas de análise. Buffers de rede de 400, 600 e 800m foram as unidades de agregação de dados. Os resultados revelam que as estratégias de medição de UMS variam significativamente entre diferentes áreas urbanas, com o Índice de Entropia mais alto encontrado no centro histórico e valores significativos da CD nos bairros mais recentes. O MXI teve resultados satisfatórios em demonstrar o equilíbrio entre usos e oferece informações relevantes sobre as características da mistura. O estudo também demonstra que em Cambé a mistura abrange áreas menores e é mais intensa em um raio de 400m. Esses resultados podem auxiliar na definição da medida de uso misto em pesquisas futuras, a partir do tipo de mistura identificado no contexto estudado.
Palavras-chave: Ambiente Construído, Transporte Ativo, Diversidade.
Introduction
In recent decades, land use mix (LUM) has been studied with different research approaches in various areas of knowledge, including Urban Planning, Public Health, and Transport Engineering. In urban studies, land use diversity stimulates people's use of space and, therefore, appears in discussions on urban vitality and urbanities (Jacobs, 2011; Chen et al., 2023). It is seen as a prerequisite for urban proximity dynamics, healthier lifestyles, and the vitality of public space (Carpio-Pinedo et al., 2021).
From a Public Health perspective, LUM is considered a positive influence on active behavior (Frank et al., 2010). The more compact and mixed the urban environment, the smaller the distances between destinations, thus increasing the probability of opting for non-motorized transportation-the basis of the “15-Minute City” concept (Gehrke & Wang, 2020). Therefore, cities must support more active lifestyles. As expressed by Manaugh & Kreider (2013), the idea of maximizing-and measuring-the extent to which built form can stimulate active transportation has become a key issue for planners.
However, despite the recognized importance of LUM, the “mix” remains an elusive, intangible concept (Manaugh & Kreider, 2013), and basic questions about how to define the ingredients of this mix and its measurement methods remain unresolved (Dovey & Pafka, 2017). These questions lead to a wide variation of conceptual definitions, which usually vary according to the focus and area of the research and directly reflect the methodological strategy used. So, this study sheds new light on the definition of the urban mixture and its measurement.
How LUM has been measured
Many approaches for measuring LUM have emerged in recent decades. In walkability studies, a variation of Shannon's entropy formula (Shannon, 1948) is the most used index for quantifying LUM (Bordoloi et al., 2013). The formula, first introduced in urban studies by Cervero & Kockelman (1997), considers the total number of land uses in the study area and their relative proportion, found in the analyzed tract. The value ranges between 0 and 1, where 1 indicates a fully heterogeneous area, which can only be achieved with a perfect land use balance.
In other words, the Entropy Index, as a measurement of diversity, relies on the assumption that LUM is most balanced when all land uses occur in equal percentages, which lacks a theoretical basis (Song et al., 2013). Adapting the ecological concepts of Magurran (1988), diversity is expressed by two complementary characteristics: richness, meaning the number of different land uses; and evenness, representing how equally dispersed the land uses are (Fontoura et al., 2021). However, Manaugh & Kreider (2013) question the idea that an even land use distribution is superior to an uneven one in walkability analysis, a valid argument that elucidates the difficulties of using entropy to measure urban phenomena.
So, despite (or perhaps because of) its widespread use, there are many questions regarding the use of Entropy as a spatial measurement, and extensive literature highlights its limitations for measuring LUM (Brown et al., 2009; Hess et al., 2001; Song et al., 2013). While the Entropy Index captures richness and, especially, evenness, it does not look at spatial distribution, and recent research has proposed alternative approaches that also consider the integration of land uses. The distribution, i.e., the spatial texture characteristics of LUM, are discussed by some authors in terms of its granularity (refers to the mixing pattern of different uses), density, and permeability (Zhuo et al., 2022). Some authors also suggest that, in addition to the types of use, LUM measures should express the spatial and functional complementarity of land uses (Hess et al., 2001).
An example of this approach is the Mixed-Use Index (MXI), proposed as the floor-space proportion of three elementary uses: housing, working, and amenities (Hoek, 2009). This method innovates by positioning, in a ternary diagram based on the proportion of elementary uses, which allows the exposure of different types and levels of mix in a non-linear manner (Dovey & Pafka, 2017).
However, many LUM measures require fine-scaled land use data that are not always available, especially when analyzing across larger geographic extents (Mavoa et al., 2018). Thus, some authors apply destination-based measurements, which aim to simplify the quantification of LUM and correct one of the Entropy Index's limitations by considering that land uses are not equal.
In this approach, “mix” is conceived as a set of destinations within an accessible distance, but with different levels of attraction (Dovey & Pafka, 2017). Based on this, Mavoa et al. (2018) developed two new exploratory "intensity" measures of land use: Daily Living, a count of the different types of neighborhood destinations that a person might walk to daily; and Local Living, a count of the destinations that people might frequent regularly.
In summary, the choice of LUM measure is based on what the research aims to capture (land use presence, distribution, or balance), the practical considerations about data collection and computational operation, and the purpose of the study (Song et al., 2013). Despite the growing interest in research developing objective methods to measure LUM, there are still questions about how the operationalization of this variable affects its assessment.
Given this urban phenomenon, this paper aims to compare strategies for measuring LUM. More specifically, our goal is to verify the applicability of conceptually distinct LUM measures in analyzing different types of urban mixtures in the Brazilian context. This approach may help future research define an appropriate land use mix measure and contribute to the debate of urban ordinances for categorizing land use as function and daily activities.
Methodology
Case study was the chosen methodological strategy, which is appropriate when the phenomenon under study is contemporary, dynamic, and complex and therefore inseparable from the real context (Yin, 2001). The study framework shown in Figure 1 was structured to aggregate information about the LUM measures in street network buffers created from the land use and walking data.
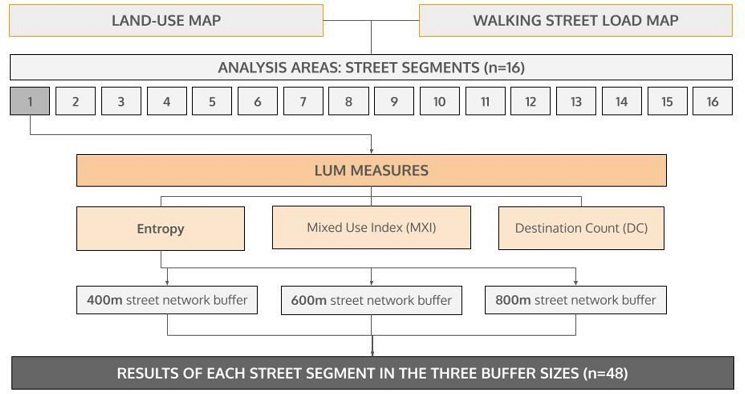
Figure 1
Research framework. Organized by the authors (2024).
Case study: Cambé
The case study was conducted in the city of Cambé, located in the north of Paraná State, in southern Brazil (Figure 2). It has an area of 495.375 km2 and a population of 107,208 inhabitants (IBGE, 2022), considered a mid-sized city. The city is located in the metropolitan region of Londrina and is in an agglomeration process with the core city as a populational arrangement (IBGE, 2018). Cambé was chosen due to data availability.
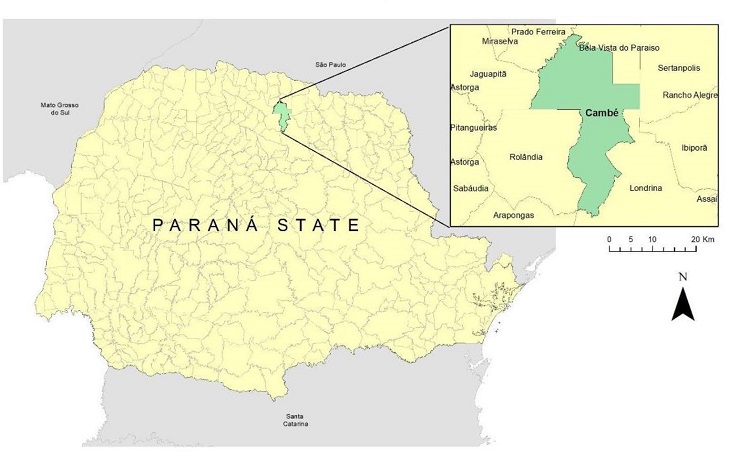
Figure 2
Location of Cambé, Paraná, Brazil. Source: IBGE (2022). Organized by the authors (2024).
The research data used in this study came from two main sources: the Origin-Destination (OD) survey, which serves as the basis for the Cambé Urban Mobility Plan, developed by the Institute of Technology, Economic, and Social Development (ITEDES) (2017); and land use data collected by the "Cidade: Movimento e Atividades" Research Group (RG) of the State University of Londrina.
Walking data
This study concentrates on utilitarian, non-recreational walking. The walking information was based on secondary data from the OD survey conducted in Cambé between November 2015 and April 2016. In this survey, 1,302 questionnaires were completed, representing 4.7% of the 27,667 permanent private households in the area (ITEDES, 2017).
The OD survey collected detailed information on travel behavior, including the origin and destination addresses of each trip, the purpose, mode of transport, time of day, and duration. A total of 4,699 trips were recorded, of which 1,125 were made on foot. Some trips were excluded due to misspellings of street names and missing information, resulting in a final sample of n=1,075.
The trips were spatialized in ArcGIS 10.6 Online using the “Spatial Analyst Toolbox” and the “Connect Origins to Destinations” tool, which links geocoded origins and destinations through georeferenced routes. The SIRGAS 2000 geodesic method and the UTM Zone 22S projection were set to consider the actual shape of the Earth. Through the geocoded routes, the street load for all routes traveled on foot was modeled (Figure 3). According to the OD survey, the more frequent the walking trips on that street, the darker the street segment.
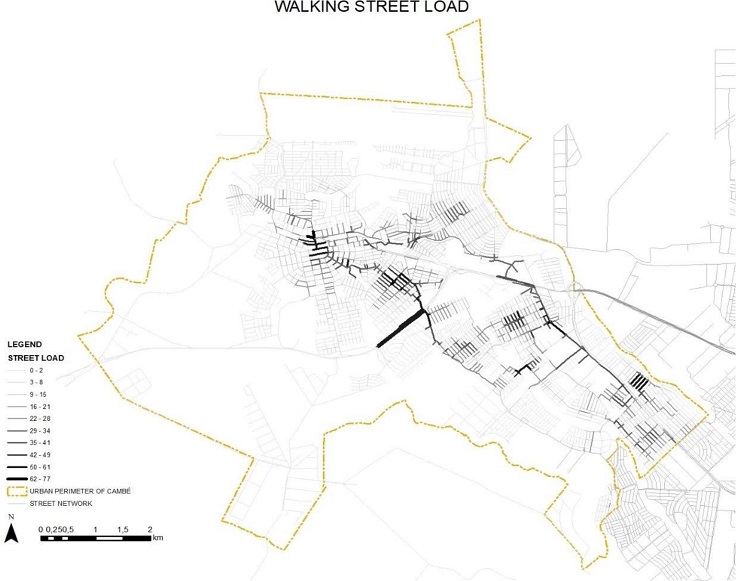
Figure 3
Walking Street Load map of Cambé. Source: ITEDES (2017). Organized by the authors (2024).
Land use data
For fine-grained land use data, the RG collected data on the 37,843 urban parcels arranged in the geocoded base map of Cambé. The survey, conducted from August 2018 to August 2020, collected the land use data remotely using Google Street View, followed by on-site verification during office hours. This work was performed using Esri ArcGIS 10.4.1, and information about each urban parcel was added to the shapefile attribute table according to a predetermined protocol.
The protocol included detailed information on land use, the number of land uses per parcel, floors, and an indication of activity for non-residential uses. Land uses were numbered from 0 to 5 according to the classification used by Frank et al. (2010): vacant (0); residential (1); retail (2); office (3); institutional (4), and entertainment (5). Buildings under construction, abandoned, or for sale were considered vacant. For parcels that had more than one use, the number of units in each category was also provided. The data were then spatialized into a land use map (Figure 4), which shows all six categories and their combinations-e.g., “123” is the combination of residential (1), retail (2), and office (3) uses in the same parcel.
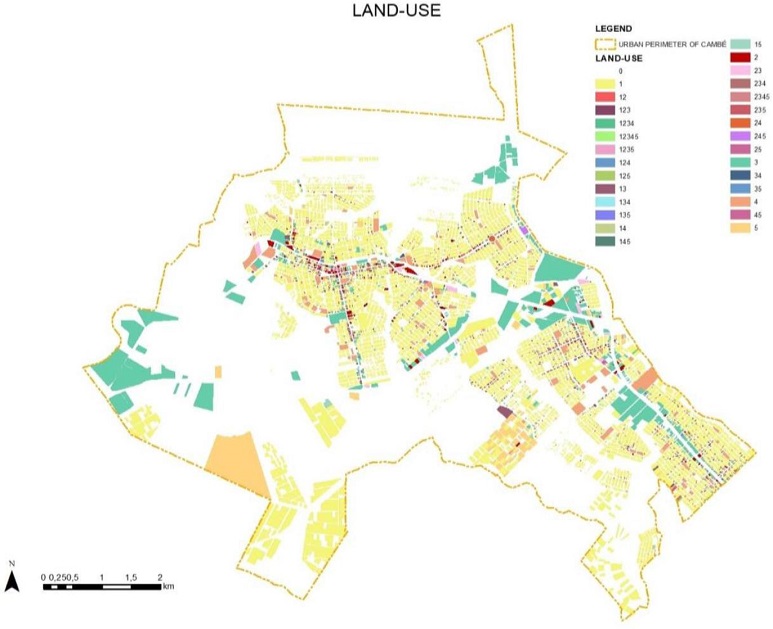
Figure 4
Land use map of Cambé. Source: RG (2020). Organized by the authors (2024).
Units of analysis
Considering that Cambé is crossed by physical barriers (roads, railroads, and rivers), the street network buffer was defined as the unit of analysis in this study. This type of buffer uses the street network as the organizational geography, considering the distance a pedestrian can travel along the streets (Forsyth et al., 2012). The buffer distance (or radius) was defined based both on evidence stating that more than half of all walking trips recorded in Cambé were up to 800 meters long (Costa et al., 2022) and on those applied in previous research (King et al., 2015; Gunn et al., 2017). Therefore, the distances of 400, 600, and 800 meters were defined to evaluate the scaling effect and to indicate which buffer size is the most suitable in this urban context.
Street segments serve as the basis for the buffers. Instead of measuring LUM all over the urban fringe, we focused on mixed urban areas to avoid predominantly residential areas, necessary to align with the research purposes. Using parcel-level land use data along with the street network allows us to consider land use mix at an unseen level of spatial granularity-the street segment- avoiding boundary biases (Carpio-Pinedo et al., 2021). Thus, the segments were defined based on the overlap of: 1. the streets with a concentration of non-residential uses shown in the land use map (Figure 4) and 2. those with more walking trips recorded on the street load map (Figure 3).
To determine the street segments, we considered the extent of the area where land uses are mixed. So, the length of the street segments varies according to the presence of non-residential uses. A case on the highway was discarded because it is considered a hostile environment and physical barrier to walking (Frank et al., 2017). The overlap resulted in 16 street segments (Figure 5), each generating a buffer at the three sizes (n=48).
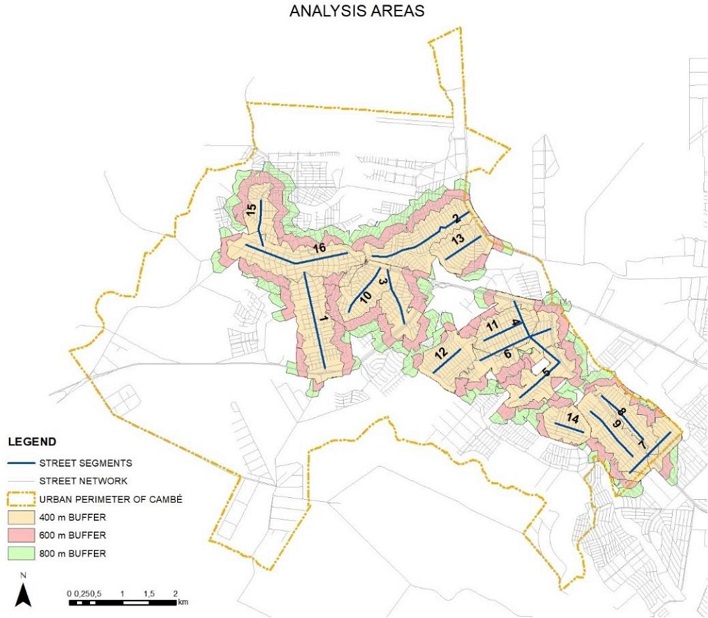
Figure 5
Analysis areas from the street segments. Source: Authors (2024).
The street network buffers were created from the street segments using the “Service Area Solver” from the “Network Analyst” tool of ArcGIS Desktop 10.4.1. Then, the attribute tables of each buffer were exported to Microsoft Excel, where the calculations were performed, and the LUM measures were systematized. Finally, the results were reattached to the buffer’s attribute table in ArcGIS to create thematic maps, and the results were classified into quintiles.
LUM measures
Three conceptually different LUM measures were used in this study: the Shannon Entropy Index (Shannon, 1948) as a measurement of evenness; the MXI (Hoek, 2009) to capture the proportion of elementary uses; and the Destination Count (DC) (Mavoa et al., 2018), a simple count of the presence or absence of walkable destinations (Table 1). As floor-space information was unavailable, the MXI was calculated using the number of land-use units (considering all floors).
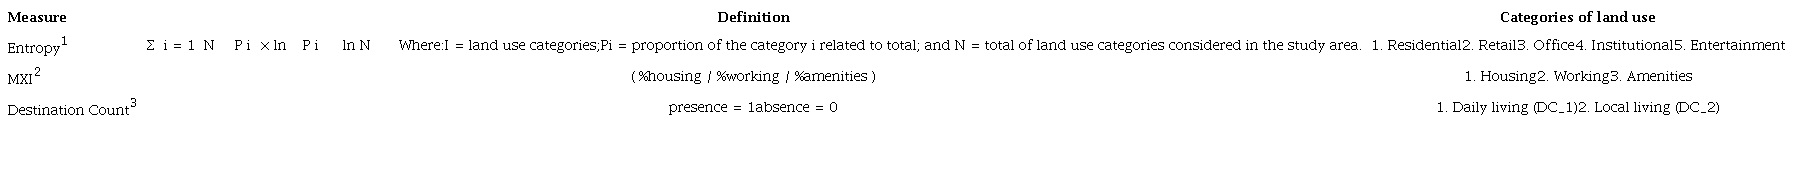
1 Shannon (1948);2 Hoek (2009);3 Mavoa et al. (2018). Organized by the authors (2024).
The land use categories were arranged according to a specific standpoint for each measure, thus data filtering was required. To calculate the Entropy Index, we retained the original classification of the dataset into five categories (Table 1), as used in previous applications of the walkability index (Frank et al., 2010; Motomura et al., 2018).
When applying the MXI, the data were reorganized into three functional categories, according to the pedestrian’s action: whether they walk to live, to work, or to visit (Hoek, 2009). According to Hoek (2009), the main difference between “working” and “amenities” is that “working” includes office and industrial functions, as these are mainly frequented by employees, while “amenities” receive many visitors throughout the day and include commercial, entertainment, and institutional facilities. Residential (“housing”) was left as a separate category, while “vacant” was excluded.
Finally, a classification was created based on how often pedestrians reach their destination in daily or local living (Mavoa et al., 2018). Educational activities were combined with the previous “working” classification, comprising the “daily living” category, as both functions require a regular daily and weekly travel pattern. The “local living” category includes all “amenities” except educational facilities. Non-walkable destinations, i.e., those to which residents are unlikely to walk to (such as car dealerships, parking lots, and hospitals), were excluded. Open spaces (such as parks and lakes) were removed from the dataset since this study focuses on utilitarian walking, and previous evidence indicates that a land use class that includes public open space is not relevant for transport walking (Christian et al., 2011).
Statistical approach
The research dataset was created with the land use data for the three LUM measures aggregated in the 400-, 600-, and 800-meter street network buffers. The DC measure is a simple count (the larger the area, the greater the number of walkable destinations). Thus, it was normalized by the buffer area in meters to allow comparisons.
Regarding the MXI calculation, the variables MXI_1, MXI_2, and MXI_3 represent the percentage of each category (Housing, Working, and Amenities, respectively) and are all correlated with each other. So, principal component analysis was performed to synthesize these three variables into a single MXI variable, in which:
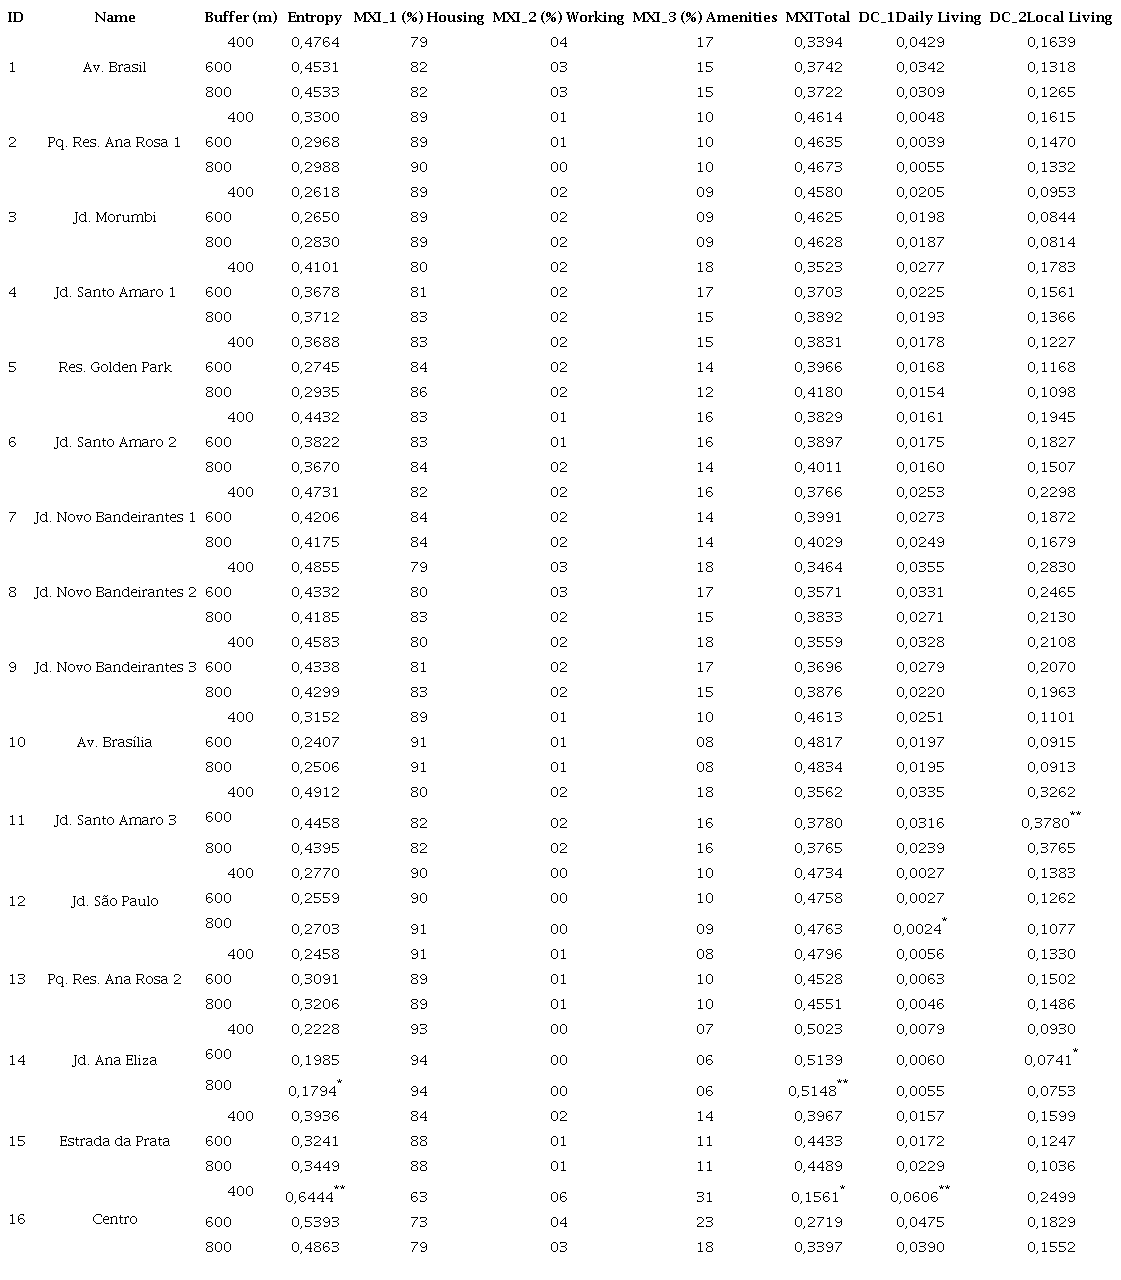
For this new variable (MXI Total), high values indicate high MXI_1 values and low MXI_2 and MXI_3 values, while low values indicate low MXI_1 values and high MXI_2 and MXI_3 values. The results are shown in Table 2 and in Figures 6 to 8.
* lower value/column;** highest value/column.
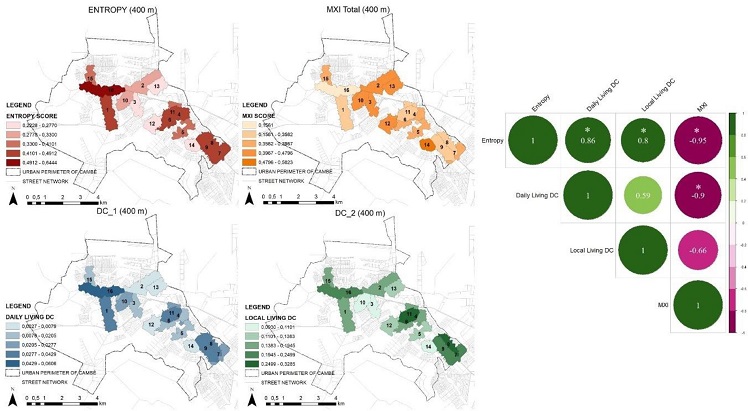
Figure 6
Maps of the results of LUM measures in 400 m buffers (left) and the correlations (right). Source: Authors (2024).
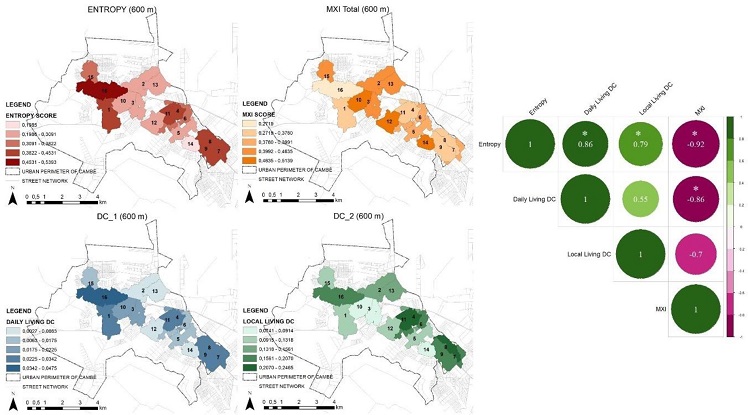
Figure 7
Maps of the results of LUM measures in 600 m buffers (left) and the correlations (right). Source: Authors (2024).
The Pearson correlation coefficients among the variables in the buffers 400m, 600m and 800m were calculated. Coefficients near -1 indicate negative correlations (with the increase of one variable, the other tends to decrease), and near +1 indicates positive correlations (with the increase of one variable, the other also tends to increase). To identify the significant correlations, the p-values were calculated, and the correlations with “ * ” presented a p-value < 0.05, while correlations without “ * ” presented a p-value ≥ 0.05. Figures 6, 7, and 8 present the correlations among the variables in the 400m, 600m and 800m buffers. All analyses were performed using R Core Team (2024) software.
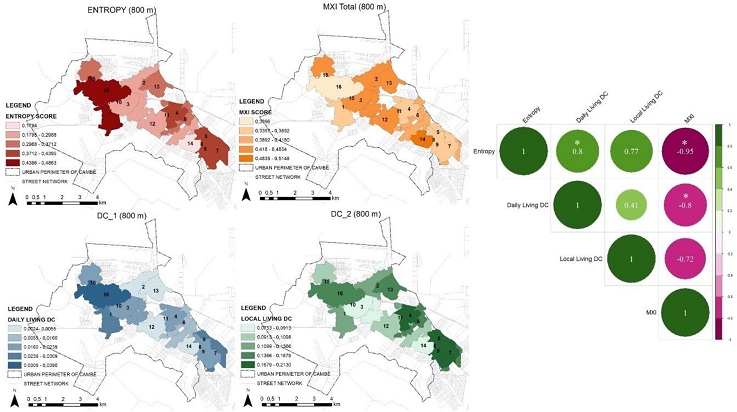
Figure 8
Maps of the results of LUM measures in 800 m buffers (left) and the correlations (right). Source: Authors (2024).
To identify groups with similar characteristics, cluster analysis was performed using the “cluster” package (Maechler et al., 2019) of the R Core Team (2024) software. The variables used in the analysis were the LUM measures (Entropy, MXI, Daily Living DC, and Local Living DC). The number of clusters was defined according to the “silhouette coefficient” (Rousseeuw, 1987). This coefficient ranges from -1 to 1, and values greater than 0.5 indicate high-quality clusters. Four clusters were formed with a silhouette coefficient value of 0.55. Then, the importance of each variable in the formation was verified, varying from 0 to 1. The closer the value is to 1, the greater the importance of the variable in forming the identified clusters. The Analysis of Variance (ANOVA) was performed to compare the variables between clusters, followed by Tukey’s test. The significance level used was 0.05. When the p-value < 0.05, the means are followed by letters. Equal letters indicate no difference in a given variable between clusters; if followed by different letters, there are differences. Table 3 shows the comparisons of the variables between clusters and their importance.
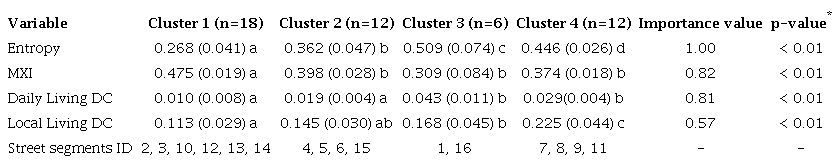
* p-value was obtained in the Analysis of Variance (ANOVA) test, followed by Tukey’s test.
Results
Table 2 shows the results of applying the three LUM measures-Entropy, MXI, and DC-for three buffer distances in each street segment (ID).
In general, the results indicate a different behavior of the LUM measure strategies in different urban areas. A higher Entropy score was found for the central area of the city (#16) in the smaller buffer (400 m), as expected due to its high concentration of amenities (31%) and work (06%). Centro also had a higher value for Daily Living (DC_1). In contrast, both Entropy and DC_1 decreased as the buffer size increased. This segment has the lowest MXI value, which increases proportionally as the buffer radius increases.
The lowest Entropy value was found in the larger buffer (800 m) in Jardim Ana Eliza (#14), a neighborhood composed mainly of residential uses (94% of housing lots). Like Centro, the result is reversed for the MXI measure, with the highest value in the 800 m buffer. This neighborhood still has the lowest value for Local Living (DC_2) in the 600 m buffer.
The lowest value for Daily Living DC was found in Jardim São Paulo (#12) in the 800 m buffer, while the highest value for Local Living DC was found in Jardim Santo Amaro 3 (#11) in the 600 m buffer. In the general overview, the most significant values are shown in the lower half of the table.
The behavior of the LUM measures in different areas of the city can be better observed by mapping the results from Table 2 (Figures 6 to 8). The maps show that the higher Entropy Index and Destination Count values have similar locations in all three buffer sizes: Centro (#16), Jardim Santo Amaro (#11) and Jardim Novo Bandeirantes (#7, #8 and #9). In addition to the maps, the correlation of the three measures by buffer size was tested to provide complementary information on the measurement strategy. The most significant correlations are between Entropy and the other measures (* indicates p-value < 0.05). Entropy and DC are positively correlated within the same buffer size, while MXI presented a negative correlation. A lower positive correlation is found between Daily Living DC and Local Living DC. It is also shown that the correlation between Entropy and DC weakens as the buffer size increases.
Finally, to identify differences and similarities among the LUM measures, a cluster analysis was conducted using four LUM measure variables (“MXI”, “Entropy”, “Local Living DC” and “Daily Living DC”) - ordered by degree of importance for clustering (n=48) (Table 3). So, the Entropy measure was the most important variable in forming the clusters, but the means are followed by different letters, indicating differences between clusters. On the other hand, similarities are found in the other measures.
As a result, the variables were grouped into four clusters: Cluster 1 (n=18), Cluster 2 (n=12), Cluster 3 (n=6), and Cluster 4 (n=12). Cluster 1 consists of segments #2, #3, #10, #12, #13, and #14. Cluster 2 contains segments #4, #5, #6, and #15. Cluster 3 is composed of both #1 and #16 segments, while the #7, #8, #9, and #11 segments are found in Cluster 4. Clear groups can be identified when the results are mapped in 800 m buffers (Figure 9).
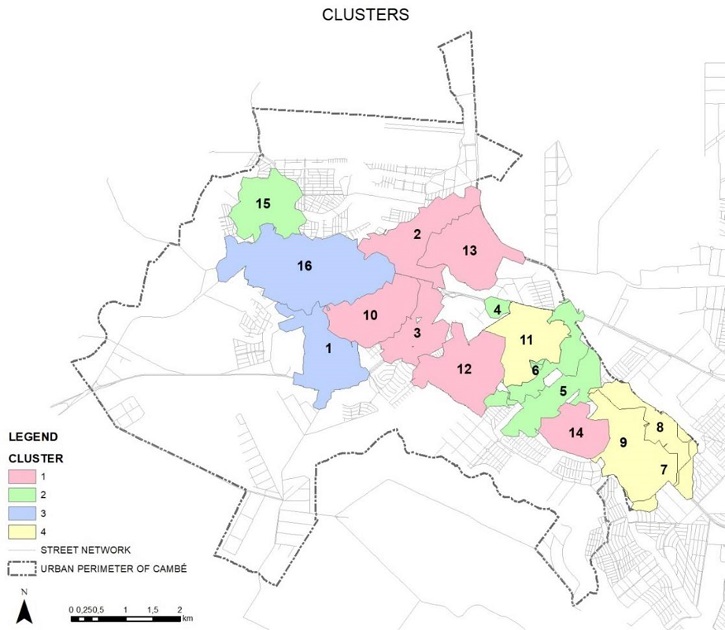
Figure 9
Location of the clusters. Source: Authors (2024).
Discussions
Comparing LUM measures in different urban areas
Firstly, some insights can be made concerning the location of the highest LUM values. Centro (#16), the area with the highest values for Entropy and Daily Living DC, is one of the city's oldest and most balanced areas although the land use distribution is not entirely balanced. The neighborhood also shows an initial verticalization process, but it does not explain the lowest percentage of housing. Sugiyama et al. (2019) highlighted the importance of commercial areas for active transportation since replacing residential areas with commercial uses can increase walkability.
Jardim Santo Amaro (#11) had the second-highest value of Entropy and the highest walkable Destination Count (considering both Daily and Local Living). It is an old, well-consolidated neighborhood characterized by an orthogonal urban grid. Its location in the industrial core, next to the highways PR-445 and BR-369, may have contributed to the emergence of an autonomous centrality over the original core due to the spatial isolation of the neighborhood.
The MXI has a reversed behavior, with higher values in Jardim Ana Eliza (#14). This neighborhood was created in the 1970s along with Jardim Bandeirantes, but it is spatially segregated by the Esperança stream. It was initially designated as a social housing enterprise, and is still mostly residential (94%).
A possible explanation for the reverse results between MXI and Entropy could lie in the statistical strategy used to convert the MXI values into a single variable. Thus, the two measures theoretically behave similarly. Based on that, the highest MXI values in the original city core (Original, Industrial, and Bandeirantes core, as shown in Figure 10) may indicate that older and more consolidated neighborhoods have a greater diversity of uses. This suggests the importance of temporality for the spontaneous emergence of non-conflicting uses, which can help promoting diversity. This thought aligns with Jacobs's (2011) point about the four conditions for good diversity: the need for 1- primary mixed uses, 2- small blocks, 3- aged buildings, and 4- people concentration. It also points out that the search for non-residential uses depends on more consolidated residential areas.
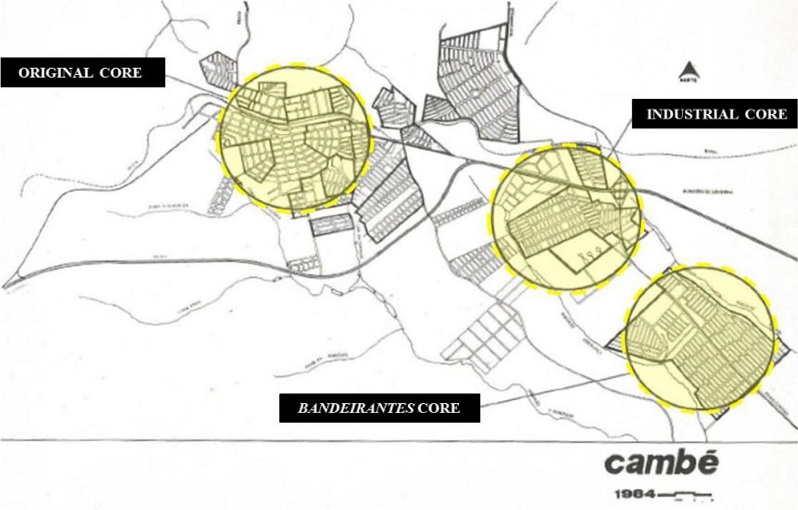
Figure 10
Cambé in 1984. SILVEIRA (1989) apud MOTOMURA et al. (2018).
These discussions were meant to understand the main characteristics of land use diversity in different areas, and cluster analysis grouped the results by similarities. Cluster 1 comprised buffers with a typical neighbourhood character: residential communities supported by local centralities, with small-scale retail activity along the busiest street. According to Table 3, this cluster differs from the others concerning the MXI measure.
Cluster 2 grouped buffers in two separate areas, similar to having an access road to the city. Segments #4, #5, and #6 have access roads from Londrina (east-west), while #15 has access to the highway to São Paulo State (north-south). So, the urban fabric of this cluster can be characterized mainly by larger-scale, non-residential activities and service warehouses.
The central area was grouped by segments #16 and #1 in Cluster 3. It corresponds to the historic city core and its primary connection (Av. Brasil), with a greater concentration of heterogeneous non-residential uses, and an initial verticalization process.
The fourth Cluster grouped neighborhoods with a strong urban connection to the metropolitan city, Jd. Novo Bandeirantes (#7, #8, #9) and Jd. Santo Amaro (#11), where non-residential uses are distributed throughout the area and along the roadside. Figure 11 shows the main urban landscapes that characterize each cluster.
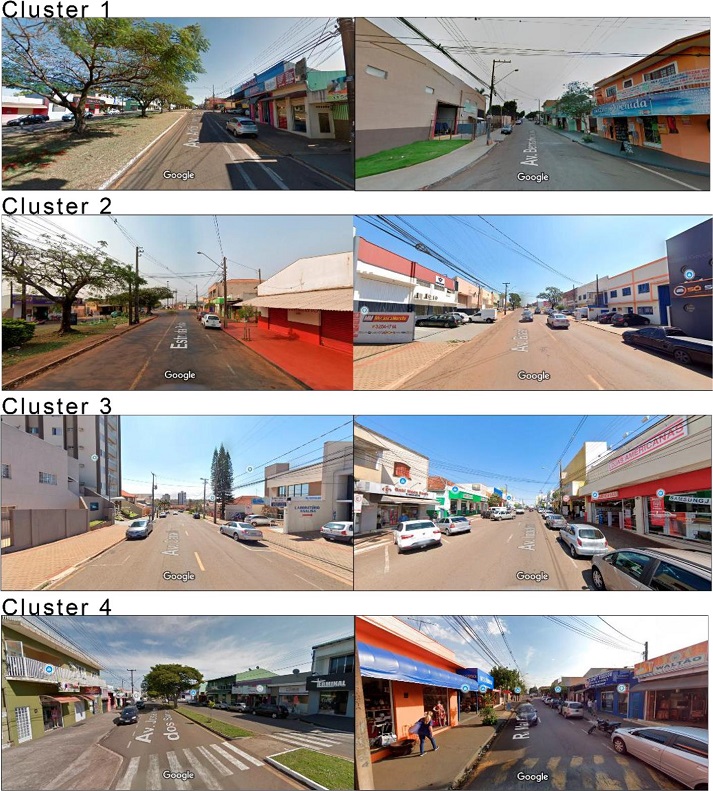
Figure 11
Urban landscape of Cambé. Source: Google Street View (2021). Organized by the authors (2024).
Operationalizing LUM measures
The choice of street network buffers proved favorable for studying LUM in mid-sized Brazilian cities with physical barriers, such as Cambé. As Noordzij et al. (2021, p. 8) note, street network buffers “offer numerous improvements over more traditional Euclidean buffers that do not consider if the street network allows or prevents access to specific locations”.
Three buffer distances were applied to examine the scaling effect. In general, almost no differences were found in the results of the LUM measures among these three sizes (Table 2). However, measurement scores decreased when the buffer distance increased in some segments such as Centro (#16). Also, it can be noted in Figures 6-8 that segment #1 (Av. Brasil) had medium values for Entropy in 400 and 600 m buffers but high in 800 m because it then covered the central area, which can lead to a misleading of the urban area analysis.
These results indicate that the mix (or concentration of non-residential uses) covers smaller areas and is more intense within a 400 m radius in Cambé. This finding is consistent with that of the ones by Gehrke & Wang (2020), who demonstrated that LUM has a stronger association with walking at a smaller spatial extent. Thus, smaller radii are recommended for studies focused on active transportation that measure LUM in medium-sized cities. In contrast, Liu et al. (2024) found that the 1800 m grid is the optimal scale for discussing LUM in a district of Shanghai with over a million residents. This way, the scale definition should consider the size of the city.
Regarding the LUM measures, the Entropy Index reflects the land use balance and thus proved to be efficient for application in the most balanced areas of this case study, such as the central area. The results of this study complement those of previous studies (Motomura et al., 2018). However, it is important to note that this study measured LUM specifically in areas with land use diversity. So the predominantly residential areas, critical for the Entropy Index, were not measured. The results could be different if applied to the whole city.
Saboya et al. (2021) note that this index neglects the total number of different land uses, known as richness which form the basis of Jacobs' (2011) concept of diversity: neighborhoods should serve more than one primary function. Moreover, questions remain about its applicability in the context of Brazilian cities with predominantly residential development, given that the land use types are not distinguished, and their compatibility and spatial configuration are not considered. Despite these concerns, the Entropy Index has proven to be a robust tool for analyzing “chaos” and consistently shows positive results in urban studies (Brigatti et al., 2021).
Similarly, this case study demonstrated that the MXI is inversely proportional to the Entropy Index and suitable to assess land use balance. The MXI is an interesting tool for comparing and analyzing different neighborhoods in a city or even in different cities. In this study, for example, two areas displayed a different distribution of housing/working/amenities: Centro (#16) had an MXI=63/06/31, while Jardim Santo Amaro (#11) had an MXI=84/02/14. In many ways, this perspective can help characterize these neighborhoods and establish desirable LUM parameters.
However, it is not evident the assumption that a full balance between the three urban functions (33/33/33) is better for active transportation than an uneven one. In Cambé, it was found that the average percentage of housing among all segments is 84%, even after intentionally including only mixed urban areas.
These results enable to characterize the Brazilian urban landscape with a predominant residential use which is a crucial consideration when choosing the LUM measure. Thus, contextual information is critical for selecting the appropriate type of LUM measure related to the research aim, as previously noted by Song et al. (2013).
On the other hand, the DC has been shown to capture the presence of origins and destinations likely to be connected by active travel (Hess et al., 2001) more straightforwardly than the Entropy Index. It is the only metric used in this study that accounts for the functional compatibility of land uses. The measurement’s merits include its ease of calculation compared to Entropy and MXI. A disadvantage is that it requires a fine-grained database.
It is important to highlight that a destination-based framework is most valuable when “recognizing that functions do not have equal levels of attraction, yet reducing this to a metric is problematic” (Dovey & Pafka, 2017, p. 252). The authors also note that these approaches, while attractive, are deeply complex, and when reduced to studies of attraction, they cease to be metrics of mix/diversity.
Hence, the Entropy Index successfully measured the most balanced areas of the urban fabric, but without considering the types of use -whether they are compatible or attractive to pedestrians. On the other hand, the Destination Count had higher values in the neighborhoods because, unlike the Entropy Index and the MXI, DC measures considered only non-residential and walkable uses.
Research limitations
The scope of this study was limited by practical conditions, especially regarding the database. The first hurdle to overcome was the small sample size of self-reported walking data from the OD survey. In addition, the walking routes were automatically generated by ArcGIS based on the origin and destination addresses rather than the actual route the respondent walked. With this limited dataset, the correlation between walking and LUM measures was not verified. Also, land use data were collected by RG members between 2018 and 2020 to provide a fine-grained database. This required extra time and, as business activities change frequently, could have some outdated information.
It is important to point out that this study intentionally applied the LUM measures only in mixed urban areas rather than all the urban fringe to stay coherent with the objectives. So, this research did not quantify which areas of the city are more or less mixed. Instead, it compared the applicability of the LUM measures in this context.
It was also necessary to adjust the scores with different calculation strategies to apply conceptually distinct LUM measures. The final MXI index, for example, showed a reverse behavior compared to the Entropy Index, probably due to the statistical strategy used to convert the MXI values into a single variable. This could have affected the study findings.
It is important to stress that temporal availability was not considered in any of the approaches used in this study due to a lack of specific data, although its importance has been recognized (Chen et al., 2023; Kretzer et al., 2023). Researchers have analysed weekday and weekend pedestrian flows and found evidence that pedestrians have different purposes for different elements of land use at different times (Duan et al., 2021). Therefore, it is suggested that future research consider temporal availability when studying LUM.
Finally, this study conducted an overall macro-scale analysis. This perspective is relevant, but also more difficult to express into practical actions that require long-term change. Micro-scale approaches using information about the walking route could promote more efficient short-term practices. Despite its limitations, this study contributes to the understanding of the applicability of conceptually different LUM measures in this urban context.
Conclusions
Since the way LUM is measured can influence the interpretation of the phenomenon and traditionally applied measurement methods have proven to be fragile, this study compared conceptually different strategies for measuring LUM in a Brazilian city.
Our findings indicate that in Cambé, LUM presents significant differences between historical and more recent areas. So, the Entropy Index proved useful for measuring the balance of uses in more consolidated areas, while the Destination Count highlights the functional compatibility of the newest neighborhoods. Similar to the Entropy Index, the MXI had satisfactory results in showing the balance between uses, with the bonus of offering relevant information about the characteristics of the mixture. The study also demonstrates that the mix covers smaller areas and is more intense within a 400 m radius in Cambé. Thus, smaller radii are recommended for studies focused on active transportation that measure LUM in medium-sized cities. Future research should consider these aspects when choosing the most appropriate LUM measure.
Thus, the choice of the LUM measure must consider the specific urban context and the purpose of the research, in addition to practical considerations about data collection and computational operation. The findings of this study were affected by the data availability and operational adjustments made to compare different measures, but this may not impact a study that applies the same measure to the entire area.
The approach of this study allows the incorporation of spatial context into the discussion of LUM measurement-an urban phenomenon-following previous research conducted mainly by authors in the fields of Public Health and Transportation Planning. This study acknowledges the complexity of LUM, which is influenced by many factors and is challenging to quantify through indices. We hope this work will contribute to understanding LUM's influence on active transportation, thus narrowing the gap between theory and practice. Ultimately, consistent and reliable LUM measures will benefit urban planning practice by clarifying policies and decision-making and guiding investments towards more sustainable cities.
Acknowledgments
This research was funded by the CAPES Foundation (Coordination for the Improvement of Higher Education Personnel) and Fundação Araucária (State of Parana Research Foundation) during the Master’s Degree of the first author. The authors also thank the Academic Writing Center of the State University of Londrina for assistance with English language developmental editing.
References
Bordoloi, R., Mote, A., Sarkar, P. P., & Mallikarjuna, C. (2013). Quantification of Land Use Diversity in The Context of Mixed Land Use. Procedia - Social and Behavioral Sciences, 104, 563-572. https://doi.org/10.1016/j.sbspro.2013.11.150
Brigatti, E., Netto, V. M., Filho, F. N. M. de S., & Cacholas, C. (2021). Entropy and hierarchical clustering: characterising the morphology of the urban fabric in different spatial cultures. (August). Retrieved from http://arxiv.org/abs/2108.05550
Brown, B. B., Yamada, I., Smith, K. R., Zick, C. D., Kowaleski-Jones, L., & Fan, J. X. (2009). Mixed land use and walkability: Variations in land use measures and relationships with BMI, overweight, and obesity. Health and Place, 15(4), 1130-1141. https://doi.org/10.1016/j.healthplace.2009.06.008
Carpio-Pinedo, J., Benito-Moreno, M., & Lamíquiz-Daudén, P. J. (2021). Beyond land use mix, walkable trips. An approach based on parcel-level land use data and network analysis. Journal of Maps, 17(1), 23-30. https://doi.org/10.1080/17445647.2021.1875063
Cervero, R., & Kockelman, K. (1997). Travel demand and the 3Ds: Density, diversity, and design. Transportation Research Part D: Transport and Environment, 2(3), 199-219. https://doi.org/10.1016/S1361-9209(97)00009-6
Chen, Y., Yu, B., Shu, B., Yang, L., & Wang, R. (2023). Exploring the spatiotemporal patterns and correlates of urban vitality: Temporal and spatial heterogeneity. Sustainable Cities and Society, 91(January), 104440. https://doi.org/10.1016/j.scs.2023.104440
Christian, H. E., Bull, F. C., Middleton, N. J., Knuiman, M. W., Divitini, M. L., Hooper, P., … Giles-Corti, B. (2011). How important is the land use mix measure in understanding walking behaviour? Results from the RESIDE study. International Journal of Behavioral Nutrition and Physical Activity, 8(55), 1-12. https://doi.org/10.1186/1479-5868-8-55
Costa, M. L. G. da, Fontoura, L. C. da, Leão, A. L. F., & Kanashiro, M. (2022). A caminhada por diferentes propósitos : um estudo na cidade de Cambé-PR. Revista de Morfologia Urbana, 10(1), 20. https://doi.org/https://doi.org/10.47235/rmu.v10i1.193
Dovey, K., & Pafka, E. (2017). What is functional mix? An assemblage approach. Planning Theory and Practice, 18(2), 249-267. https://doi.org/10.1080/14649357.2017.1281996
Duan, Y., Lei, K., Tong, H., Li, B., Wang, W., & Hou, Q. (2021). Land use characteristics of Xi’an residential blocks based on pedestrian traffic system. Alexandria Engineering Journal, 60(1), 15-24. https://doi.org/10.1016/j.aej.2020.04.032
Fontoura, L. C. da, Kanashiro, M., & Saboya, R. T. de. (2021). Como operacionalizar o uso misto do solo nos estudos de caminhabilidade? Reflexões teórico-metodológicas. Encontro Da Associação Nacional de Pesquisa e Pós-Graduação Em Arquitetura e Urbanismo (ENANPARQ), 330-344. Brasília, DF: FAU-UnB.
Forsyth, A., Lead, E. M., Koepp, J., Larson, N., Lytle, L., Mishra, N., … Living, A. (2012). NEAT-GIS Protocols. (January).
Frank, L. D., Fox, E. H., Ulmer, J. M., Chapman, J. E., Kershaw, S. E., Sallis, J. F., … Schipperijn, J. (2017). International comparison of observation-specific spatial buffers: Maximizing the ability to estimate physical activity. International Journal of Health Geographics, 16(1), 1-13. https://doi.org/10.1186/s12942-017-0077-9
Frank, L D, Sallis, J. F., Saelens, B. E., Leary, L., Cain, K., Conway, T. L., & Hess, P. M. (2010). The development of a walkability index: application to the Neighborhood Quality of Life Study. British Journal of Sports Medicine, 44(13), 924-933. https://doi.org/10.1136/bjsm.2009.058701
Frank, L. D., Appleyard, B. S., Ulmer, J. M., Chapman, J. E., & Fox, E. H. (2021). Comparing walkability methods: Creation of street smart walk score and efficacy of a code-based 3D walkability index. Journal of Transport and Health, 21, 101005. https://doi.org/10.1016/j.jth.2020.101005
Gehrke, S. R., & Wang, L. (2020). Operationalizing the neighborhood effects of the built environment on travel behavior. Journal of Transport Geography, 82(October 2019). https://doi.org/10.1016/j.jtrangeo.2019.102561
Gunn, L. D., King, T. L., Mavoa, S., Lamb, K. E., Giles-Corti, B., & Kavanagh, A. (2017). Identifying destination distances that support walking trips in local neighborhoods. Journal of Transport and Health, 5, 133-141. https://doi.org/10.1016/j.jth.2016.08.009
Hess, P. M., Moudon, A. V., & Logsdon, M. G. (2001). Measuring land use patterns for transportation research. Transportation Research Record, (1780), 17-24. https://doi.org/10.3141/1780-03
Hoek, J. V. D. (2009). The Mixed Use Index (Mixed-use Index) as Planning Tool for (New) Towns in the 21st Century. New Towns for the 21st Century: The Planned vs the Unplanned City, 98-207.
Instituto Brasileiro de Geografia e Estatística - IBGE. (2022). Censo Demográfico de 2022. Cambé: IBGE. Retrieved on 28 June 2023 at https://censo2022.ibge.gov.br/panorama/
Instituto Brasileiro de Geografia e Estatística - IBGE. (2018). REGIC - Regiões de influência das cidades. Rio de Janeiro: IBGE. Retrieved on 02 September 2024 at https://www.ibge.gov.br/geociencias/organizacao-do-territorio/redes-e-fluxos-geograficos/15798-regioes-de-influencia-das-cidades.html?=&t=sobre
Instituto de Tecnologia e Desenvolvimento Econômico e Social - ITEDES. (2017). PlanMob: Plano Municipal de Mobilidade Urbana de Cambé-PR.
Jacobs, J. (2011). Morte e Vida de Grandes Cidades (2a Ed.).
King, T. L., Bentley, R. J., Thornton, L. E., & Kavanagh, A. M. (2015). Does the presence and mix of destinations influence walking and physical activity? International Journal of Behavioral Nutrition and Physical Activity, 12(1), 1-12. https://doi.org/10.1186/s12966-015-0279-0
Kretzer, G., Kanashiro, M., & Saboya, R. T. (2023). Complementarity between urban land uses: a temporal analysis. Journal of Urban Design, 00(00), 1-18. https://doi.org/10.1080/13574809.2023.2280272
Liu, L., Huang, H., & Qi, J. (2024). Towards a Multi-Scale Effect of Land Mixed Use on Resident Population-A Novel Explanatory Framework of Interactive Spatial Factors. Land, 13(3). https://doi.org/10.3390/land13030331
Maechler, M., Rousseeuw, P., Struyf. A., Hubert, M., Hornik, K. (2019). Cluster: Cluster Analysis Basics and Extensions. R package version 2.1.0
Magurran, A. E. (1988). Ecological Diversity and Its Measurement. Princeton, N.J: Croom Helm Ltd.
Manaugh, K., & Kreider, T. (2013). What is mixed use? Presenting an interaction method for measuring land use mix. Journal of Transport and Land Use, 6(1), 63. https://doi.org/10.5198/jtlu.v6i1.291
Mavoa, S., Boulange, C., Eagleson, S., Stewart, J., Badland, H. M., Giles-Corti, B., & Gunn, L. (2018). Identifying appropriate land-use mix measures for use in a national walkability index. JOURNAL OF TRANSPORT AND LAND USE, 11(1), 681-700. https://doi.org/10.5198/jtlu.2018.1132
Motomura, M. C. N., Fontoura, L. C. da, & Kanashiro, M. (2018). Understanding walkable areas: applicability and analysis of a walkability index in a Brazilian city. Ambiente Construído, 18(4), 413-425. https://doi.org/10.1590/s1678-86212018000400313
Noordzij, J. M., Beenackers, M. A., Groeniger, J. O., Timmermans, E. J., Motoc, I., Huisman, M., & van Lenthe, F. J. (2021). Land use mix and physical activity in middle-aged and older adults: a longitudinal study examining changes in land use mix in two Dutch cohorts. International Journal of Behavioral Nutrition and Physical Activity, 18(1), 1-10. https://doi.org/10.1186/s12966-021-01083-1
R Core Team. (2024). R: A language and environment for statistical computing. R Foundation for Statistical Computing. Vienna, Austria. Retrieved on 16 December 2020 at www.R-project.org/
Rousseeuw, P. (1987). Silhouettes: A graphical aid to the interpretation and validation of cluster analysis. Journal of Computational and Applied Mathematics, v. 20 (p. 53-65). https://doi.org/10.1016/0377-0427(87)90125-7.
Saboya, R. T., Souza, G., Kronenberger, B., & Barause, L. (2021). As condições para a diversidade de Jacobs: um teste em três cidades brasileiras. Eure, v. 47(n. 140), 243-267. https://doi.org/10.7764/eure.47.140.12
Shannon, C.E. (1948). A mathematical theory of communication. Bell Syst. Tech. J. 27, 379-423.
Song, Y., Merlin, L., & Rodriguez, D. (2013). Comparing measures of urban land use mix. Computers, Environment and Urban Systems, 42, 1-13. https://doi.org/10.1016/j.compenvurbsys.2013.08.001
Sugiyama, T., Cole, R., Koohsari, M. J., Kynn, M., Sallis, J. F., & Owen, N. (2019). Associations of local-area walkability with disparities in residents’ walking and car use. Preventive Medicine, 120(December 2018), 126-130. https://doi.org/10.1016/j.ypmed.2019.01.017
Yin, R. K. (2001). Estudo de Caso: planejamento e métodos.
Zhuo, Y., Jing, X., Wang, X., Li, G., Xu, Z., Chen, Y., & Wang, X. (2022). The Rise and Fall of Land Use Mix: Review and Prospects. Land, 11(12). https://doi.org/10.3390/land11122198.
Notes
Author notes