Articulos
EATING HABITS AND FOOD KNOWLEDGE IN A SAMPLE OF PORTUGUESE UNIVERSITY STUDENTS
Hábitos alimentarios y conocimiento sobre alimentos en una muestra de universitarios portugueses
Habitudes alimentaires et connaissance des aliments chez un échantillon d'étudiants universitaires portugais
Hábitos alimentares e conhecimento sobre alimentos numa amostra de estudantes universitários portugueses
EATING HABITS AND FOOD KNOWLEDGE IN A SAMPLE OF PORTUGUESE UNIVERSITY STUDENTS
Agroalimentaria, vol. 25, no. 49, pp. 137-155, 2019
Universidad de los Andes

This work is licensed under Creative Commons Attribution-NonCommercial-ShareAlike 3.0 International.
Received: 14 May 2019
Revised: 23 January 2020
Accepted: 15 February 2020
Resumen: Adoptar una dieta saludable es una decisión compleja, ya que está supeditada a factores de índole diversa (biológicos, sociales, ambientales, demográficos y psicológicos). La transición de la escuela secundaria a la universidad es un período crítico que acarrea muchos cambios ambientales sociales y físicos, que pueden llevar a un estilo de vida poco saludable. Este estudio investigó los hábitos alimentarios, el conocimiento de los alimentos y el nivel de información sobre una dieta saludable en una muestra de 670 estudiantes universitarios en Portugal. Los principales hallazgos revelaron que, en general, los participantes tenían un buen conocimiento de la comida y hábitos alimenticios satisfactorios, así como un nivel satisfactorio de información sobre una dieta saludable. Se encontraron diferencias significativas en el conocimiento alimentario de los participantes entre los grupos de edad y según el área de estudios. La mayoría de los estudiantes reveló hábitos alimenticios satisfactorios, con diferencias significativas entre los grupos de edad, el área de estudios y la práctica de deportes de alta competición. Los resultados apuntaron a la necesidad de mejorar los programas educativos, que pueden contribuir a aumentar el conocimiento sobre los alimentos de los estudiantes universitarios y, en consecuencia, mejorar sus hábitos alimenticios.
Palabras clave: estudiantes universitarios, hábitos alimentarios, conocimiento alimentario, alimentación sana, encuesta, Portugal.
Abstract: The choice to adopt a healthy diet is complex, since food choices and eating behaviours are influenced by various factors, such as biological, social, environmental, demographic and psychological aspects. The transition from secondary school to university is a critical period that involves many social and physical environmental changes, which may lead to an unhealthy lifestyle. This study investigated the eating habits, food knowledge and the level of information about a healthy diet in a sample of 670 university students in Portugal. In general, the participants had a good food knowledge and satisfactory eating habits, as well as a satisfactory level of information about a healthy diet. There were found significant differences in the participants’ food knowledge among age groups and according to the area of studies. Most of the students revealed satisfactory eating habits, with significant differences between age groups, the area of studies and the practice of high competition sport. The results pointed to the necessity of improving educational programs which can contribute to increase university students’ food knowledge and consequently improve their eating habits.
Keywords: eating habits, food knowledge, healthy diet, survey, Portugal, university students.
Résumé: Le choix d'adopter un régime alimentaire sain est complexe, car les choix alimentaires et les comportements alimentaires sont influencés par divers facteurs, tels que les aspects biologiques, sociaux, environnementaux, démographiques et psychologiques. La transition des études secondaires aux études universitaires est une période critique qui implique de nombreux changements environnementaux sociaux et physiques, ce qui peut conduire à un mode de vie malsain. Cette étude a examiné les habitudes alimentaires, les connaissances des aliments et le niveau d'informations sur un régime alimentaire sain sur un échantillon de 670 étudiants universitaires au Portugal. En général, les participants avaient de bonnes connaissances alimentaires et des habitudes alimentaires satisfaisantes, ainsi qu'un niveau d'information satisfaisant sur un régime alimentaire sain. On a constaté des différences significatives dans les connaissances des participants en matière de nourriture entre les groupes d’âge et selon le domaine d’étude. La plupart des élèves ont révélé des habitudes alimentaires satisfaisantes, avec des différences significatives entre les groupes d'âge, le domaine d'études et la pratique du sport de haut niveau. Les résultats ont mis en évidence la nécessité d’améliorer les programmes éducatifs, qui peuvent contribuer à accroître les connaissances des étudiants universitaires en matière d’alimentation et, partant, à améliorer leurs habitudes alimentaires.
Mots clés: habitudes alimentaires, connaissance des aliments, alimentation saine, enquête, étudiants universitaires.
Resumo: A opção pela adoção de uma dieta saudável é complexa, uma vez que escolhas alimentares e comportamentos alimentares são influenciados por diversos fatores, como aspetos biológicos, sociais, ambientais, demográficos e psicológicos. A transição da escola secundária para a universidade é um período crítico que envolve muitas mudanças ambientais sociais e físicas, o que pode levar a um estilo de vida pouco saudável. Este estudo investigou os hábitos alimentares, o conhecimento alimentar e o nível de informação sobre uma dieta saudável numa amostra de 670 estudantes universitários em Portugal. Em geral, os participantes tinham um bom conhecimento alimentar e hábitos alimentares satisfatórios, além de um nível satisfatório de informações sobre uma dieta saudável. Foram encontradas diferenças significativas no conhecimento alimentar dos participantes entre as faixas etárias e de acordo com a área de estudos. A maioria dos estudantes revelou hábitos alimentares satisfatórios, com diferenças significativas entre as faixas etárias, a área de estudos e a prática de desportos de alta competição. Os resultados apontaram para a necessidade de melhoria dos programas educacionais, que podem contribuir para o aumento do conhecimento alimentar dos universitários e, consequentemente, melhorar seus hábitos alimentares.
Palavras-chave: conhecimento sobre alimentos, dieta saudável, estudantes universitários, hábitos alimentares, Portugal, sondagem.
1. Introduction
According to the World Health Organization WHO, 2018a) health is not only the absence of illness but a state of complete physical, mental and social well-being. There are many factors that affect human health, namely the social and economic status, the physical environment, as well as the person’s individual characteristics and behaviours (WHO, 2018c). Noncommunicable diseases (NCDs) are the major causes of morbidity and mortality in all industrialized countries, killing 41 million people each year, which is equivalent to 71% of all deaths worldwide. The four major risk factors for the appearance of NCDs are tobacco use, physical inactivity, the harmful use of alcohol and unhealthy diets (WHO, 2018b). It is widely recognised the vital role of healthy eating habits coupled with an adequate physical activity for the prevention of NCDs (Lupi et al., 2015). In addition, a good night sleep is also indispensable for health and optimal bodily function (Kabrita, Hajjar-Muça & Duffy, 2014). However, the choice to adopt a healthy diet is not always simple, because food choices and eating behaviours are influenced by many factors, such as biological, social, environmental, demographic and psychological aspects (Janssen, Davies, Richardson, & Stevenson, 2018).
The transition from secondary school to university is a critical period that involves many social and physical environmental changes, which may lead to an unhealthy lifestyle (Alsunni & Badar, 2015; Li et al., 2012). The years spent at the university are frequently associated with poor eating habits, such as high levels of fast-food consumption, low intake of fruits and vegetables, and breakfast skipping (Hilger, Loerbroks & Diehl, 2017; Larson, Laska, Story & Neumark-Sztainer, 2012; Niemeier, Raynor, Lloyd-Richardson, Rogers & Wing, 2006). These inadequate eating behaviours may be due to low levels of nutritional and food knowledge (Gan, Mohd, Zalilah & Hazizi, 2011), financial aspects (El Ansari, Suominen & Samara, 2016; Jessop, Herberts & Solomon, 2005) and academic responsibilities that may generate stress and lead to changes in eating habits (Fabián et al., 2013). Furthermore, for many students the entrance to the university coincides with the transition from their parental house to an independent adult life, which implies that they have to make their own food choices for the first time (Theodoridis et al., 2018). In fact, family support is usually associated with better eating habits (Schnettler et al., 2013, 2015).
Taking in consideration this background, it is essential to understand university students’ food knowledge and eating habits in order to promote strategies that improve eating habits among this age group. Therefore, the main goal of this study was to investigate the eating habits, food knowledge and the level of information about a healthy diet in a sample of university students in Portugal. It was also evaluated which sociodemographic variables interfered in the eating habits, food knowledge and level of information about a healthy diet of the participants; how the habits of resting interfered in the eating habits and also if there was a relation between food knowledge and eating habits.
2. Materials and methods
2.1. Instrument
To undertake this study was purposely created a questionnaire composed of different parts intended to access different information about the sample at study: Part I, Sociodemographic data; Part II, Food knowledge; Part III, Eating habits; and, Part IV, Information about a healthy diet. In order to measure the participants’ food knowledge in Part II were included questions intended to evaluate the students’ degree of knowledge about a healthy diet, as well as other statements about which the students were asked to state their accordance measured on a 5-point Likert scale varying from 1 (strongly disagree) to 5 (strongly agree) (Likert, 1932). In Part III of the questionnaire were included different questions about the participants’ eating patterns and also about their resting habits. To evaluate the level of information about a healthy diet in Part IV were included different statements intended to characterize where the participants obtained the information about this subject, measured on a 5-point Likert scale.
2.2. Data collection
It was undertaken a descriptive cross-sectional study on a non-probabilistic sample of 670 Portuguese university students belonging to one of the 5 schools of the Polytechnic Institute of Viseu (IPV) and the Catholic University of Viseu. The questionnaires were applied only to adults (aged 18 or over) and after verbal informed consent. All ethical issues were followed when designing and applying the questionnaire, which was approved by the Ethical Committee with reference nº 13/2017.
2.3. Anthropometric evaluation
Height and weight were obtained by self-response and used to calculate the Body Mass Index (BMI), dividing weight (kg) by height squared (m.). Then, the BMI scores were classified into classes according to the standards of the International Classification: underweight (BMI < 18.50 kg/m.), normal weight (18.50 ≤ BMI ≤ 24.99 kg/m.), overweight (25.00 ≤ BMI ≤ 29.99 kg/m.) and obese (BMI ≥ 30.00 kg/m.) (WHO, 2006).
2.4. Statistical Analysis
Basic descriptive statistics tools were used for the exploratory analysis of the data and in all tests the level of significance considered was 5%. All data analysis was made using the software IBM SPSS (version 25). To assess the relations between some of the categorical variables it was used the Chi square test. The Cramer’s V coefficient was used to evaluate the strength of the significant relations found between some of the variables under study. This coefficient varies from 0 to 1, and for V ≈ 0.1 the association is considered weak, for V ≈ 0.3 the association is moderate and for V ≈ 0.5 or over, the association is strong (Witten & Witte, 2009).
In order to minimize the possibility of interpretative divergences and to assign a clear and precise meaning to the variables, creating the possibility of making them measurable, the conceptual and empirical operationalization of the variables was performed.
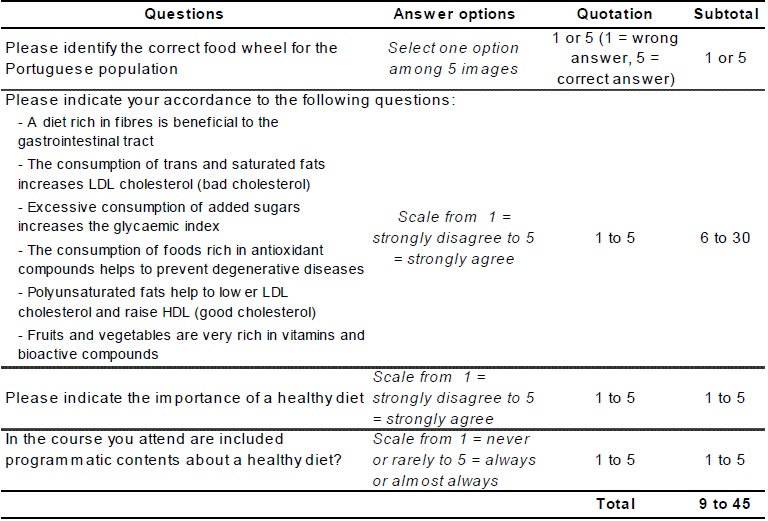
To create the variable food knowledge, the first step was to attribute a quotation to each question included in Part II of the questionnaire (Table Nº 1). Then, it was calculated a subtotal of each question and these subtotals were used to calculate the total for each participant, thus giving the score for the variable food knowledge. This variable corresponded to values varying from 9 to 45, and which could be interpreted as follows: [9 - 15[ = poor food knowledge; [15 - 30[ = satisfactory food knowledge; [30 - 40[ = good food knowledge; [40 - 45] = very good food knowledge.
The process to calculate the variable eating habits was the same that was used for the variable food knowledge. In this case it was given the quotation 1 when the answer was adequate to healthy eating habits and the quotation 0 when it was not (Table Nº 2). The variable eating habits ranged from 0 to 24, interpreted as follows: [0 - 5[ = poor food eating habits; [5 - 12[ = satisfactory eating habits; [12 - 20[ = good eating habits; [20 - 24] = very good eating habits.
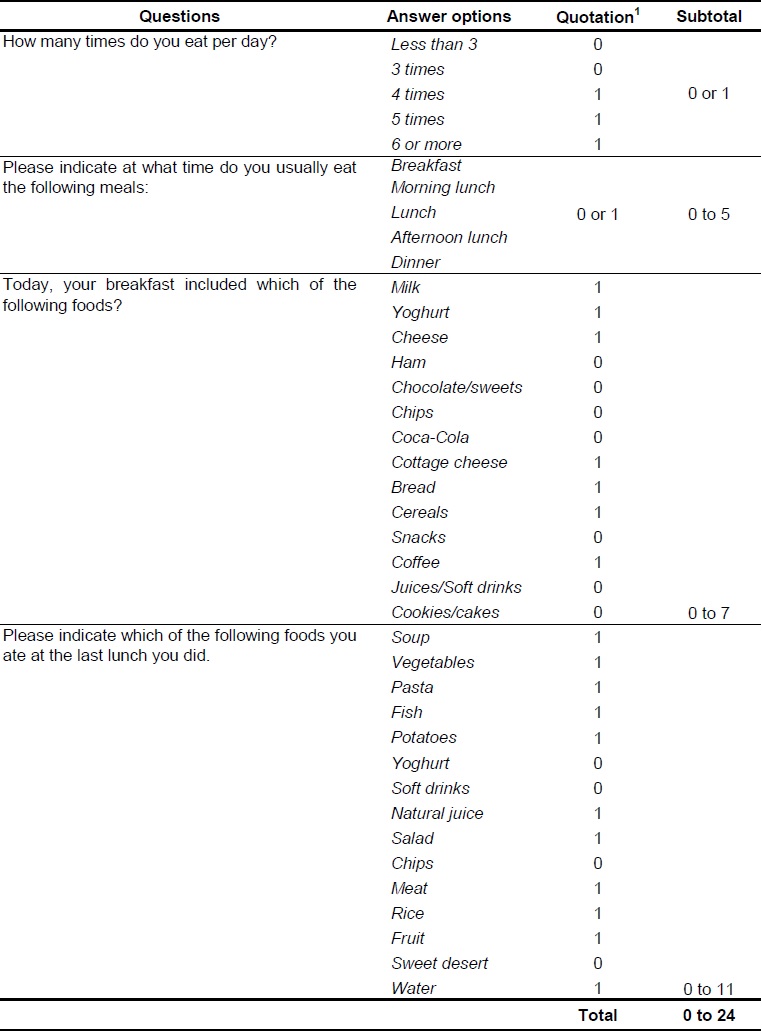
(1) Quotation takes value = 1 when the answer was adequate to healthy eating habits; and 0, when it was not
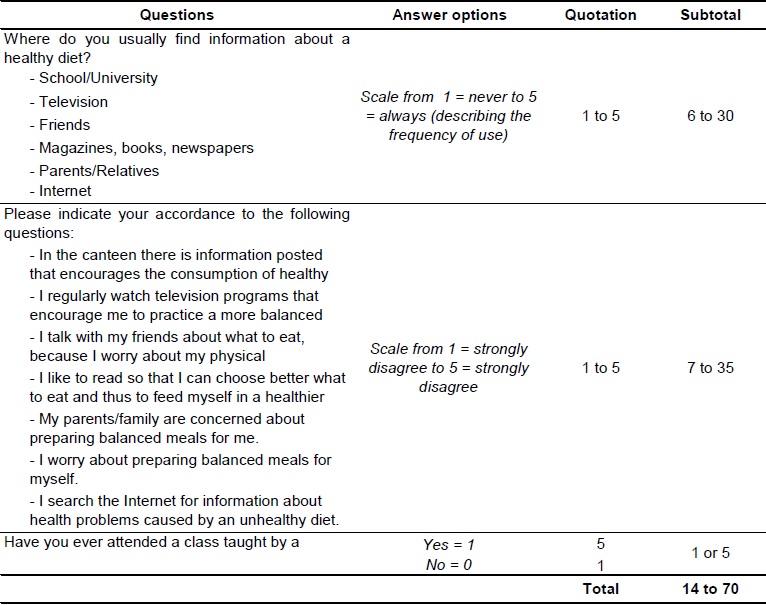
Source: Own elaboration, based on the research dataThe operationalization of the variable level of information about a healthy diet was done in the same way as the other two variables (Table Nº 3). The score of this variable varied from 14 to 70, interpreted as follows: [14 - 25[ = poor level of information about a healthy diet; [25 - 40[ = satisfactory level of information about a healthy diet; [40 - 60[ = level of information about a healthy diet; [60 - 70] = very good level of information about a healthy diet.
Source: Own elaboration, based on the research data
As for the participants’ sleeping hours they were classified in three classes, interpreted as follows: less than 7 hours of sleep = insufficient; from 7 to 8 hours of sleep (inclusive) = adequate; and, more than 8 hours of sleep = excessive.
3. Results and discussion
3.1. Sample characterization
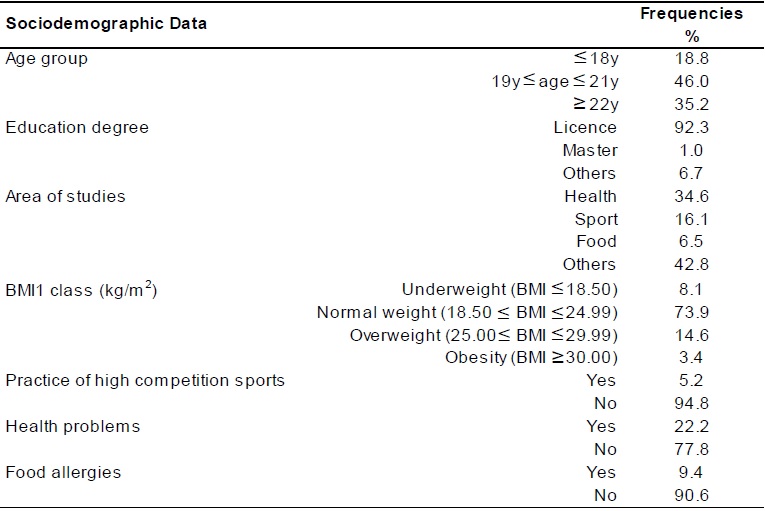
The sample was composed by 670 university students, from which 63.4% were women and 36.6% were men. The age of the participants ranged from 17 to 70 years old, being on average 21.85 ± 5.51 years. As it can be observed in Table Nº 4, 46.0% of the participants were in the age group of 19-21 years. As for the level of education, most of the participants (92.3%) attended a license degree, followed by the participants who attended others degrees (6.7%) and only a few percentage of them (1.0%) attended a master degree. Regarding the area of studies, 42.8% of the participants’ studies were from areas that were not specified in the questionnaire, followed by the students from areas related to health (34.6%). The majority of the participants, 73.9%, had a normal weight and only 3.4% were obese. The results further showed that only a minority of the participants, 5.2%, practiced a high competition sport, 77.8% had not health problems and 9.4% of them had food allergies.
Source: Own elaboration, based on the research data
3.2. Food knowledge
For the whole sample the mean score for the participants’ food knowledge was 35.94 ± 4.40 (scale from 9 to 45), meaning that –in general– the students had a good food knowledge. Most of the participants, 77.6%, identified the correct food wheel for the Portuguese population (Figure Nº 1) and revealed a very good degree of knowledge about different nutritional aspects, with most values over 4, on average, on a scale from 1 (poor) to 5 (very good) (Table Nº 5). Moreover, 74.0% of the participants believed that it is extremely important to follow a healthy diet. The results further showed that 26.5% of the participants answered that in the course they attended are frequently included programmatic contents related to a healthy diet (never or rarely: 25.1%; sporadically: 10.8%; sometimes: 19.9; always or almost always: 17.8%).
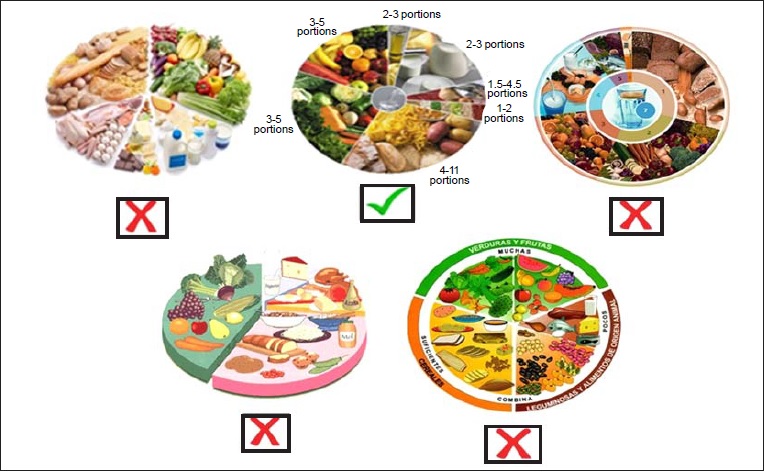
Figure 1
Question about the identification of the correct Portuguese Food Wheel
Source: own elaboration, based on FAO (2019)
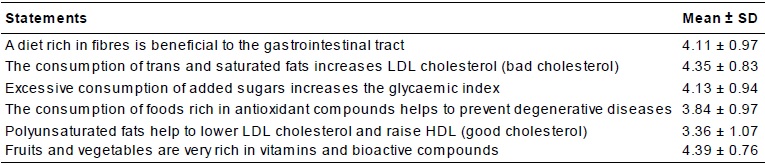
Source: Own elaboration, based on the research data
When seen by gender (Table Nº 6), for both men and women the participants’ food knowledge was good. In view of these results there were not found significant differences between genders, meaning that gender did not influence the participants’ food knowledge (. = 0.598). Nevertheless, in previous studies it was found that women tended to have a better food and nutrition knowledge than men (Kresić, Kendel, Pavicić, Cvijanović & Ivezić, 2009; Yahia, Wang, Rapley & Dey, 2016).

Source: Own elaboration, based on the research data
It was also analysed the participants’ food knowledge according to the age group (Table Nº 6) and a higher percentage of the participants aged 22 or over, 22.1%, had a very good food knowledge, when compared to those from the other age groups (age . 18y: 9.5% and 19y ≤ age £ 21y: 12.2%). The results of the Chi square test showed that there were significant differences among age groups, meaning that age group influenced the participants’ food knowledge. However, the association between the variables was weak (V = 0.119). These results may be due to the fact that the older participants were in more advanced years of the courses they attended and therefore had already acquired more knowledge.
As for the participants’ food knowledge according to the area of studies (Table Nº 6), it was found that, regardless the area of studies, most of the participants had good food knowledge (health: 71.1%; food: 55.8%; sport: 85.6%; other: 74.5%). However, it is important to note that a higher percentage of the participants from health and food areas had a very good food knowledge, 22.8% and 37.2% respectively, when compared to those from sport (9.6%) and other areas (7.7%). Independently of the area of studies, none of the participants had a poor food knowledge. The results of the Chi square test showed that there were no significant differences between the areas of studies (. = 0.463). In the study performed by Jones et al. (2015), it was found that students who had taken a college-level nutrition course tended to have better food nutrition knowledge than those who had not.
Regarding the influence of BMI class on the participants’ food knowledge, as it can be observed in Table Nº 6, there were no significant differences among the different BMI classes, meaning that this variable did not influence the participants’ food knowledge. The results further show that independently the BMI class, most of the participants had a good food knowledge.
There were also investigated other possible associations, namely the presence of a health problem and the influence of practicing a high competition sport. However, there were no significant differences in none of those cases (Health problems: . = 0.978; Practice of high competition sport: . = 0.938), meaning that the presence of a health problem and the practice of a high competition sport did not influence the participants’ food knowledge.
3.3. Eating habits
For the sample at study, the mean score for the participants’ eating habits was equal to 11.42 ± 2.27 (scale from 0 to 24), which means that in general the participants’ eating habits were satisfactory. These results are not in line with previous scientific research where it was found that university students’ eating habits are usually characterized by unhealthy food choices (Deliens, Clarys, De Bourdeaudhuij & Deforche, 2014). A considerable percentage of the participants, 40.8%, ate 5 meals per day and only 0.6% ate less than 3 meals per day (3 meals/day: 7.6%; 4 meals/day: 25.9%; 5 meals/day: 40.8%; 6 or more meals/day: 25.1%). Furthermore, 6.6% of the participants indicated that usually do not eat breakfast, 17.8% do not take a morning lunch, 1.0% skip lunch, 5.7% do not eat the afternoon lunch, 1.7% skip dinner and 40.7% of the students do not eat the evening supper. In another study developed in Spain it was found that 98% of the university students in the study had breakfast and almost 75% of them had at least four meals per day (García-Meseguer, Burriel, García & Serrano-Urrea, 2014). The results also showed that, in general, the participants’ breakfast included milk (54.0% of positive answers), bread (45.8% of positive answers), cereals (32.7% of positive answers) and coffee (23.9% of positive answers). It is important to highlight that only few students answered that at breakfast they consumed chocolate (2.4%), chips (0.1%), Coca-Cola (2.1%), snacks (4.6%), juices (5.5%) or cakes (12.1%). When the participants were asked about what they ate at lunch, 30.1% of them answered that they ate soup, 28.4% consumed vegetables, 28.2% ate pasta, 21.6% fish, 16.0% potatoes, 2.5% yoghurt, 15.5% soft juices, 4.3% juices, 23.6% salad, 10.4% chips, 58.2% meat, 38.5% rice, 27.8% fruit, 9.4% a sweet desert and 44.9% drank water. Several studies found that the intake of fruits and vegetables among university students is generally low (Peltzer & Pengpid, 2015).
Table Nº 7 shows the participants’ eating habits according to some of the variables, and when seen by the age group it was found that a higher a percentage of the participants aged 22 or over, 36.9%, had good eating habits when compared to those from the other age groups, but also a higher percentage of them revealed poor eating habits, 1.7%, than the participants from the other age groups. The results of the Chi square showed that the differences among age groups where statistically significant (. = 0.021), and therefore age group influenced the participants’ eating habits. However, the association between the variables was weak (V = 0.093).
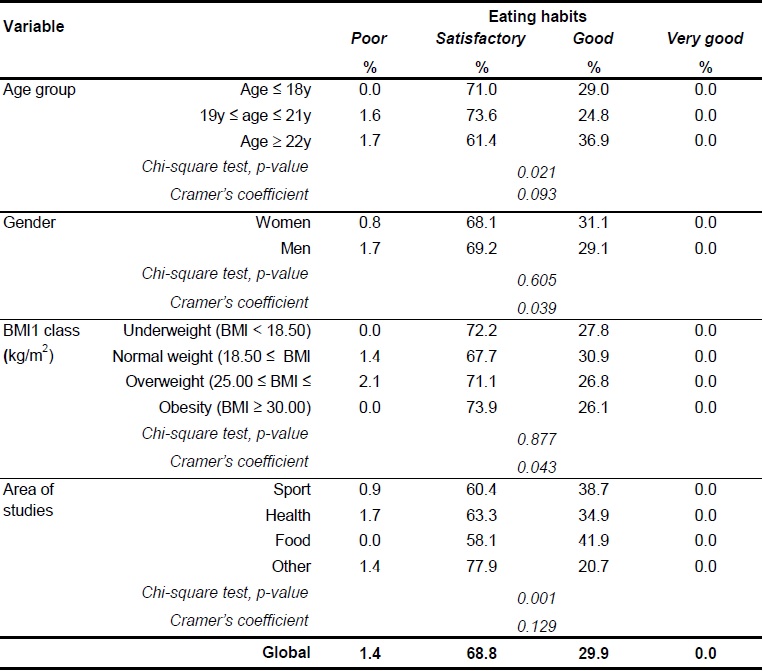
Source: Own elaboration, based on the research data
According to gender, it was observed that the results were similar for both men and women and that both genders revealed satisfactory eating habits (68.1% for women and 69.2% for men). In this case, there were no significant differences between genders. According to other studies, in non-stress periods, female students tended to adopt better eating habits than male students, but that tendency is different when female students are stressed and in those periods they tended to increase the consumption of high-sugar, high-fat foods and unhealthy snacking, while reducing the intake of healthier foods like vegetables (Economos, Hildebrandt & Hyatt, 2008; Papier, Ahmed, Lee, & Wiseman, 2015; Sharma, Harker, Harker, & Reinhard, 2010).
Regarding the participants’ eating habits according to the BMI class, as it can be observed in Table Nº 7, independently of the BMI class, the majority of the participants revealed satisfactory eating habits, with no significant differences among BMI classes. These results are not surprising, because in other studies it was also reported some inconsistent findings between BMI and dietary patterns (Aparicio et al., 2017).
When the eating habits were analyzed according to the area of studies, it was observed that, regardless the area of studies, most of the participants had satisfactory eating habits. However, none of the participants from food areas revealed poor eating habits, when compared to those from other areas (sport: 0.9%; health: 1.7%; other areas: 1.4%). Nevertheless, in none of the cases the participants’ eating habits were very good. The results of the Chi square test showed that there were significant differences among the areas of studies (.= 0.001) and therefore the area of studies influenced the participants’ eating habits, but with a weak association between the variables.
As it can be observed in Table Nº 8, most of the participants who practiced high competition sports, 51.4%, revealed good eating habits, while the majority of the participants who did not practice, 69.9%, revealed satisfactory eating habits. Therefore, not surprisingly were found significant differences among the two groups (. = 0.015), with a weak association between the variables (V = 0.113). In fact, there are specific guidelines for athletes and proper eating habits provide the achievement of a high performance (Galanti et al., 2014; Meyer, 2015; Shi & Gisolfi, 1998).
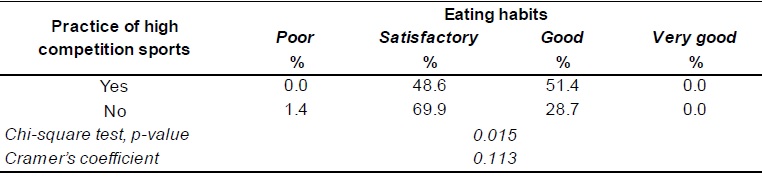
Source: Own elaboration, based on the research data
It was also analysed if the presence of health problems influenced the participants’ eating habits and no association was found (. = 0.222), being the eating habits of most of the participants who had a health problem satisfactory (74.3%), as well as the eating habits of those who had not (67.2%).
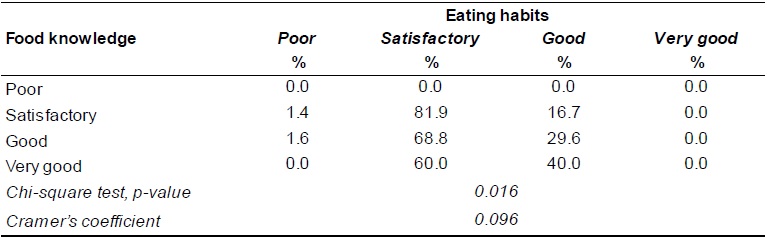
Since nutrition knowledge is one of the factors that influence eating habits (Spronk, Kullen, Burdon & O’Connor, 2014), it was evaluated if a higher food knowledge was associated with better eating habits (Table Nº 9). The results suggested that a better food knowledge corresponded to better eating habits. The results of the Chi square test showed that food knowledge influenced the participants’ eating habits (. = 0.016), with a weak association between the variables (V = 0.096). Nonetheless, for most of the participants, regardless the food knowledge, their eating habits were satisfactory. In another study by Abraham, Noriega & Shin (2018), it was found that despite the participants’ food knowledge, their food choices were not necessarily healthy.
Source: Own elaboration, based on the research data
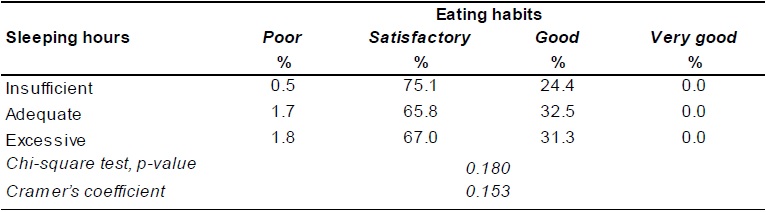
A sleep duration from 7 to 9 hours is necessary for young adults’ optimal health (18-25 years), according to the National Sleep Foundation (Hirshkowitz et al., 2015). In the present study, the participants slept on average 7.01 ± 1.95 hours, which is considered adequate. As for the association between the participants’ eating habits and their sleeping hours (Table Nº 10), it was found that, independently of the sleeping hours, the majority of the participants had satisfactory eating habits. Therefore, no significant differences were found, meaning that the participants’ sleeping hours did not influence their eating habits. The results of the study performed by Nedeltcheva et al. (2009) suggested that a recurrent sleep deprivation is associated with an increased consumption of excess calories from snacks, however without a statistically significant change in the intake of energy from meals.
3.4. Information about a healthy diet
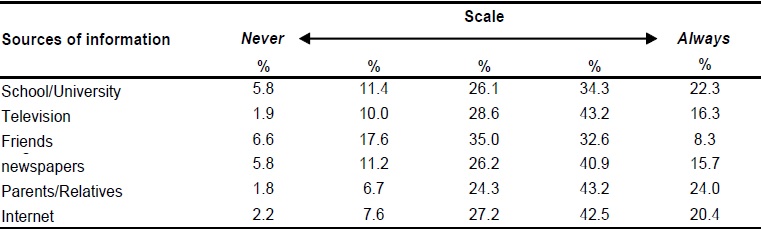
Table Nº 11 presents the participants’ frequency of usage of the different sources of information about a healthy diet and the most privileged sources of information were the parents/family and also the television, with 43.2% of the participants, in both cases, indicating that used those sources of information frequently. These results are not surprising, since parents transmit information about dietary attitudes to their offspring and therefore influence their eating patterns (Deliens et al., 2014; Larson & Story, 2009). It is important to note that 41.8% of the participants indicated that they agree with the fact that their parents/family are concerned about preparing balanced meals for them and 39.2% of them are concerned with the preparation of balanced meals for themselves. When the students were asked if they already attended a class performed by a nutritionist, the majority of them, 69.6%, answered that they did not, against 30.4% of the participants who answered yes.
Source: Own elaboration, based on the research data
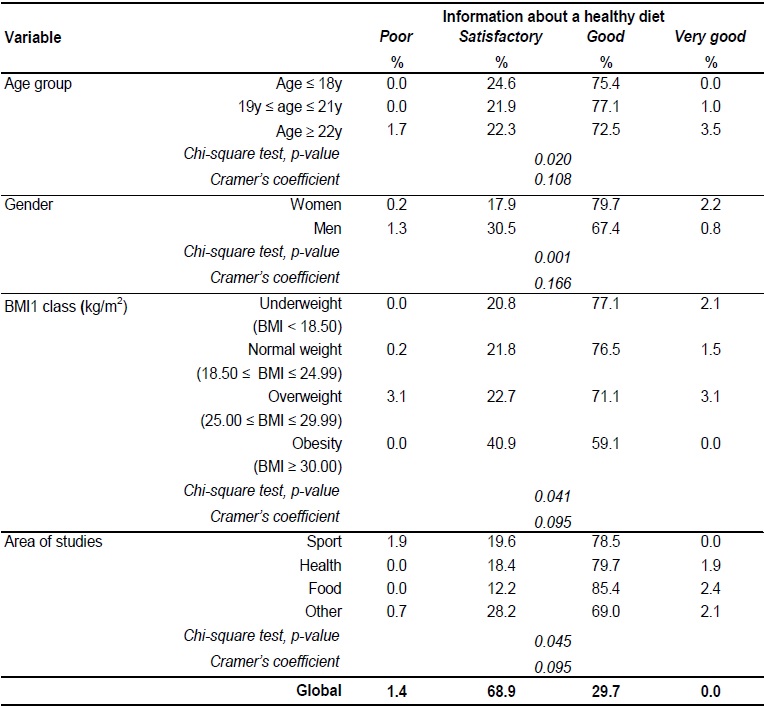
Most of the participants, 68.9%, had a satisfactory level of information about a healthy diet, 29.7% good and only 1.4% of them revealed a poor level of information about this subject (Table Nº 12). When seen by age group, the results were not totally elucidative, since the participants aged 22 or over were the only ones who revealed a poor level of information about a healthy diet (1.7%), but they were also the ones with a higher percentage of students with very good information about this topic (3.5%). Nonetheless, were found significant differences among age groups (.= 0.020), meaning that this variable influenced the participants’ level of information about a healthy diet. However, the association between the variables was weak (V = 0.108).
Source: Own elaboration, based on the research data
According to gender, the results suggested that women tended to have a higher level of information about a healthy diet than men, with significant differences between genders (. = 0.001). Again the association between the variables was weak (V = 0.166). In previous studies it was also found that women tend to search more information about health issues than men, especially using the Internet (Bidmon & Terlutter, 2015).
As for possible influence of BMI class, as it can be observed in Table Nº 12, it was found that BMI class in fact influenced the participants’ level of information about a healthy diet (. = 0.041), with a weak association between the variables (V = 0.095). Also the area of studies proven to influenced the participants’ level of information about a healthy diet (. = 0.045), but again with a weak association between the variables (V = 0.095).
There were also analysed other possible associations, namely the influence of the practice of high competition sports and the presence of health problems. The practice of high competition sport did not influence the participants’ level of information about a healthy diet (. = 0.073), but the presence of a health problem did (. = 0.027, V = 0.119). The results further showed that a higher percentage of the participants who had a health problem revealed a very good level of information about a healthy diet (4.2%), when compared to those who had not (1.0%).
Since not all the information about a healthy diet is equally reliable (Diviani, van den Putte, Giani & van Weert, 2015), it was analysed if the level of information about a healthy diet actually influence the participants’ food knowledge(Table Nº 13). The results suggested that a higher level of information about a healthy diet corresponded to a better food knowledge. The results of the Chi squared showed that the level of information about a healthy diet influenced the participants’ food knowledge (. = 0.000), with a weak association between the variables (V = 0.190).

Source: Own elaboration, based on the research data
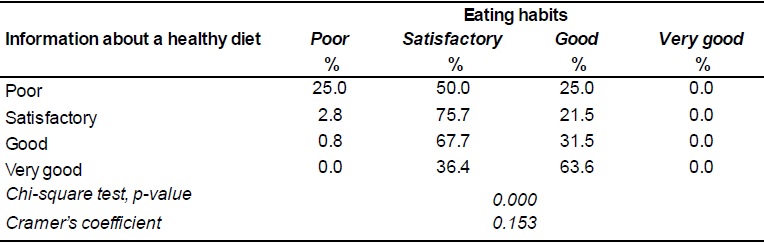
Table Nº 14 refers to the participants’ eating habits according to the level of information about a healthy diet, and as it can be observed a higher percentage of the participants with a very good information about a healthy diet, 63.6%, revealed to have good eating habits, when compared to the other participants. In this case it was also proved that the level of information about a healthy diet influenced the participants’ eating habits, again with a weak association between the variables.
Source: Own elaboration, based on the research data
4. Conclusion
This study allowed obtaining interesting results about the students’ food knowledge and eating habits. Most of the participants identified the correct food wheel for the Portuguese population and, in general, they revealed to have a good food knowledge. There were found significant differences in the participants’ food knowledge regarding age groups, with a higher percentage of participants aged 22 or over revealing very good food knowledge, when compared to those from the other age groups. Also the area of studies influenced food knowledge, with a higher prevalence of very good food knowledge among the participants who attended courses in areas related to food.
Most of the participants had satisfactory eating habits, being this variable influenced by age group, the area of studies, the practice of a high competition sport and also the participants’ food knowledge. The results suggested that better food knowledge corresponded to better eating habits. The majority of the participants slept the recommended number of hours for their age and this variable did not influence the participants’ eating habits.
The main sources of information for obtaining information about a healthy diet were parents/family and television. In general, the participants’ level of information about a healthy diet was satisfactory. The results further showed that age group, gender, BMI classes, the area of studies and also the presence of a health problem influenced the participants’ level of information about this subject. As to the association between the participants’ food knowledge and their level of information about a healthy diet, it was observed that a higher level of information was associated with a better food knowledge. This trend was similar for the participants’ eating habits, so that a better level of information corresponded to better eating habits.
The results highlighted of this study the importance of a reflection about the phenomenon under study, being necessary to intensify the debate on this topic in a school context, showing to the students the importance of a healthy diet. It will be also important for the university itself to provide a supportive food environment that promotes healthier eating patterns, comprehending health education sessions that contribute to increase the students’ awareness about this subject.
REFERENCES
Abraham, S., Noriega, B. R., & Shin, J. Y. (2018). College students eating habits and knowledge of nutritional requirements. Journal of Nutrition and Human Health, 2(1). Retrieved from http://www.alliedacademies.org/abstract/college-students-eating-habits-and-knowledge-of-nutritional-requirements-9188.html
Alsunni, A. A., & Badar, A. (2015). Fruit and vegetable consumption and its determinants among Saudi university students. Journal of Taibah University Medical Sciences, 10(2), 201-207. https://doi.org/10.1016/j.jtumed.2014.11.003
Aparicio, A., Rodríguez-Rodríguez, E. E., Aranceta-Bartrina, J., Gil, Á., González-Gross, M., Serra-Majem, L.,…Ortega, R. M. (2017). Differences in meal patterns and timing with regard to central obesity in the ANIBES (‘Anthropometric data, macronutrients and micronutrients intake, practice of physical activity, socioeconomic data and lifestyles in Spain’) Study. Public Health Nutrition, 20(13), 2364-2373. https://doi.org/10.1017/S1368980017000635
Bidmon, S., & Terlutter, R. (2015). Gender differences in searching for health information on the internet and the virtual patient-physician relationship in Germany: Exploratory results on how men and women differ and why. Journal of Medical Internet Research, 17(6). https://doi.org/10.2196/jmir.4127
Deliens, T., Clarys, P., De Bourdeaudhuij, I., & Deforche, B. (2014). Determinants of eating behaviour in university students: A qualitative study using focus group discussions. BMC Public Health, 14, 53. https://doi.org/10.1186/1471-2458-14-53
Diviani, N., van den Putte, B., Giani, S., & van Weert, J. C. (2015). Low Health literacy and evaluation of online health information: A systematic review of the literature. Journal of Medical Internet Research, 17(5). https://doi.org/10.2196/jmir.4018
Economos, C. D., Hildebrandt, M. L., & Hyatt, R. R. (2008). College freshman stress and weight change: Differences by gender. American Journal of Health Behavior, 32(1), 16-25. https://doi.org/10.5555/ajhb.2008.32.1.16
El Ansari, W., Suominen, S., & Samara, A. (2016). Eating habits and dietary intake: Is Adherence to dietary guidelines associated with importance of healthy eating among undergraduate university students in Finland? Central European journal of public health, 23, 306-313. https://doi.org/10.21101/cejph.a4195
Fabián, C., Pagán, I., Ríos, J. L., Betancourt, J., Cruz, S. Y., González, A. M.,…Rivera-Soto, W. T. (2013). Dietary patterns and their association with sociodemographic characteristics and perceived academic stress of college students in Puerto Rico. Puerto Rico Health Sciences Journal, 32(1), 36-43.
Food and Agriculture Organization of the United Nations, FAO. (2019). Food-based dietary guidelines - Portugal. Rome: FAO. Retrieved from http://www.fao.org/nutrition/education/food-dietary-guidelines/regions/countries/Portugal/en
Galanti, G., Stefani, L., Scacciati, I., Mascherini, G., Buti, G., & Maffulli, N. (2014). Eating and nutrition habits in young competitive athletes: A comparison between soccer players and cyclists. Translational Medicine @ UniSa, 11, 44-47.
Gan, W. Y., Mohd, N. M. T., Zalilah, M. S., & Hazizi, A. S. (2011). Differences in eating behaviours, dietary intake and body weight status between male and female Malaysian University students. Malaysian Journal of Nutrition, 17(2), 213-228.
García-Meseguer, M. J., Burriel, F. C., García, C. V., & Serrano-Urrea, R. (2014). Adherence to Mediterranean diet in a Spanish university population. Appetite, 78, 156-164. https://doi.org/10.1016/j.appet.2014.03.020
Hilger, J., Loerbroks, A., & Diehl, K. (2017). Eating behaviour of university students in Germany: Dietary intake, barriers to healthy eating and changes in eating behaviour since the time of matriculation. Appetite, 109, 100-107. https://doi.org/10.1016/j.appet.2016.11.016
Hirshkowitz, M., Whiton, K., Albert, S. M., Alessi, C., Bruni, O., DonCarlos, L.,…Adams Hillard, P. J. (2015). National Sleep Foundation’s sleep time duration recommendations: Methodology and results summary. Sleep Health, 1(1), 40-43. https://doi.org/10.1016/j.sleh.2014.12.010
Janssen, H. G., Davies, I. G., Richardson, L. D., & Stevenson, L. (2018). Determinants of takeaway and fast food consumption: a narrative review. Nutrition Research Reviews, 31(1), 16-34. https://doi.org/10.1017/S0954422417000178
Jessop, D. C., Herberts, C., & Solomon, L. (2005). The impact of financial circumstances on student health. British Journal of Health Psychology, 10(Pt 3), 421-439. https://doi.org/10.1348/135910705X25480
Jones, A. M., Lamp, C., Neelon, M., Nicholson, Y., Schneider, C., Wooten Swanson, P., & Zidenberg-Cherr, S. (2015). Reliability and Validity of Nutrition Knowledge Questionnaire for Adults. Journal of Nutrition Education and Behavior, 47(1), 69-74. https://doi.org/10.1016/j.jneb.2014.08.003
Kabrita, C. S., Hajjar-Muça, T. A., & Duffy, J. F. (2014). Predictors of poor sleep quality among Lebanese university students: association between evening typology, lifestyle behaviors, and sleep habits. Nature and Science of Sleep, 6, 11-18. https://doi.org/10.2147/NSS.S55538
Kresić, G., Kendel Jovanović, G., Pavicić Zezel, S., Cvijanović, O., & Ivezić, G. (2009). The effect of nutrition knowledge on dietary intake among Croatian university students. Collegium Antropologicum, 33(4), 1047-1056.
Larson, N., Laska, M. N., Story, M., & Neumark-Sztainer, D. (2012). Predictors of fruit and vegetable intake in young adulthood. Journal of the Academy of Nutrition and Dietetics, 112(8), 1216-1222. https://doi.org/10.1016/j.jand.2012.03.035
Larson, N., & Story, M. (2009). A review of environmental influences on food choices. Annals of Behavioral Medicine: A Publication of the Society of Behavioral Medicine, 38(Suppl. 1), S56-73. https://doi.org/10.1007/s12160-009-9120-9
Li, K. K., Concepcion, R. Y., Lee, H., Cardinal, B. J., Ebbeck, V., Woekel, E., & Readdy, R. T. (2012). An examination of sex differences in relation to the eating habits and nutrient intakes of university students. Journal of Nutrition Education and Behavior, 44(3), 246-250. https://doi.org/10.1016/j.jneb.2010.10.002
Likert, R. (1932). A technique for the measurement of attitudes. Archives of Psychology, 22(140), 55.
Lupi, S., Bagordo, F., Stefanati, A., Grassi, T., Piccinni, L., Bergamini, M., & Donno, A. D. (2015). Assessment of lifestyle and eating habits among undergraduate students in northern Italy. Annali Dell’Istituto Superiore Di Sanità, 51, 154-161. https://doi.org/10.4415/ANN_15_02_14
Meyer, A. (2015). Does education increase pro-environmental behavior? Evidence from Europe. Ecological Economics, 116, 108-121. https://doi.org/10.1016/j.ecolecon.2015.04.018
Nedeltcheva, A. V., Kilkus, J. M., Imperial, J., Kasza, K., Schoeller, D. A., & Penev, P. D. (2009). Sleep curtailment is accompanied by increased intake of calories from snacks. The American Journal of Clinical Nutrition, 89(1), 126-133. https://doi.org/10.3945/ajcn.2008.26574
Niemeier, H. M., Raynor, H. A., Lloyd-Richardson, E. E., Rogers, M. L., & Wing, R. R. (2006). Fast food consumption and breakfast skipping: predictors of weight gain from adolescence to adulthood in a nationally representative sample. The Journal of Adolescent Health: Official Publication of the Society for Adolescent Medicine, 39(6), 842-849. https://doi.org/10.1016/j.jadohealth.2006.07.001
Papier, K., Ahmed, F., Lee, P., & Wiseman, J. (2015). Stress and dietary behaviour among first-year university students in Australia: Sex differences. Nutrition, 31(2), 324-330. https://doi.org/10.1016/j.nut.2014.08.004
Peltzer, K., & Pengpid, S. (2015). Correlates of healthy fruit and vegetable diet in students in low, middle and high income countries. International Journal of Public Health, 60(1), 77-90. https://doi.org/10.1007/s00038-014-0631-1
Schnettler, B., Denegri, M., Miranda, H., Sepúlveda, J., Orellana, L., Paiva, G., & Grunert, K. G. (2013). [Eating habits and subjective well-being among university students in southern Chile]. Nutricion Hospitalaria, 28(6), 2221-2228. https://doi.org/10.3305/nutr hosp.v28in06.6751
Schnettler, B., Miranda, H., Lobos, G., Orellana, L., Sepúlveda, J., Denegri, M.,…Grunert, K. G. (2015). Eating habits and subjective well-being. A typology of students in Chilean state universities. Appetite, 89, 203-214. https://doi.org/10.1016/j.appet.2015.02.008
Sharma, B., Harker, M., Harker, D., & Reinhard, K. (2010). Youth transition to university in Germany and Australia: an empirical investigation of healthy eating behaviour. Journal of Youth Studies, 13(3), 353-367. https://doi.org/10.1080/13676260903447510
Shi, X., & Gisolfi, C. V. (1998). Fluid and carbohydrate replacement during intermittent exercise. Sports Medicine, 25(3), 157-172.
Spronk, I., Kullen, C., Burdon, C., & O’Connor, H. (2014). Relationship between nutrition knowledge and dietary intake. The British Journal of Nutrition, 111(10), 1713-1726. https://doi.org/10.1017/S0007114514000087
Theodoridis, X., Grammatikopoulou, M. G., Gkiouras, K., Papadopoulou, S. E., Agorastou, T., Gkika, I.,…Chourdakis, M. (2018). Food insecurity and Mediterranean diet adherence among Greek university students. Nutrition, Metabolism and Cardiovascular Diseases, 28(5), 477-485. https://doi.org/10.1016/j.numecd.2018.02.007
Witten, R., & Witte, J. (2009). Statistics. (9a. ed.). New Jersey: Wiley.
World Health Organization, WHO. (2006). Global database on body mass index. Retrieved from http://apps.who.int/bmi/index.jsp?introPage=intro_3.htm
World Health Organization, WHO. (2018a). Constitution of WHO: Principles. Retrieved from http://www.who.int/about/mission/en/
World Health Organization, WHO. (2018b). Non communicable diseases-key facts. Retrieved on August 27th 2018, from http://www.who.int/news-room/fact-sheets/detail/noncommunicable-diseases
World Health Organization, WHO. (2018c). The determinants of health. Retrieved from http://www.who.int/hia/evidence/doh/en/
Yahia, N., Wang, D., Rapley, M., & Dey, R. (2016). Assessment of weight status, dietary habits and beliefs, physical activity, and nutritional knowledge among university students. Perspectives in Public Health, 136(4), 231-244. https://doi.org/10.1177/1757913915609945