Abstract: This study aims to research which economic sectors most contributed to the formation of the Gross Domestic Product (GDP) and Human Development Index (HDI) in Brazil from 1990 to 2010. The HDI and GDP were the dependent variables selected for the study. The independent (industries sectors) variables were collected from the United Nations Industrial Development Organization (UNIDO) database and included employees, salaries, and manufacturing establishments of 23 industries sectors that were separated into technological levels according to the Organization for Economic Co-operation and Development (OECD). The SPSS statistical program allowed the following analyses: histograms, dispersion diagrams, descriptive statistics for each of the variables and segments involved in the research (average, fashion, median, standard deviation, variance, minimum, maximum, and amplitude), normality of data (Kolmogorov-Smirnov test) and correlation (Pearson and Spearman). The Food and Beverage sector was the most opened physical stores in Brazil. It has (until 2010) most employed people, although the Textile and Leather sectors have also potentially increased during the period. Other Equipment and Transport Vehicles, Motor Vehicles, Trailers, Semitrailers, Coke and Petroleum Derivatives have most contributed for the GDP increase. The methodological filter could potentially limit the findings. This paper explains and emphasizes the economic sectors that contributed to the economic development in Brazil which could help authorities to address investments in order to improve social and economic indicators. Most of the studies about GDP and HDI are not correlated, but rather studied separately, which does not contribute to the holistic understanding of economic development. INTRODUCTION
Keywords:Economic SectorsEconomic Sectors, Gross Domestic Product Gross Domestic Product, Human Development Index Human Development Index.
Resumen: Este estudio tiene como objetivo investigar qué sectores económicos contribuyeron a la formación del Producto Interno Bruto (PIB) y del Índice de Desarrollo Humano (IDH) en Brasil de 1990 a 2010. El IDH y el PIB fueron las variables dependientes seleccionadas para el estudio. Las variables independientes (sectores industriales) se obtuvieron de la base de datos de la Organización de las Naciones Unidas para el Desarrollo Industrial (ONUDI) e incluyeron empleados, salarios y establecimientos manufactureros de 23 sectores industriales separados en niveles tecnológicos según la Organización para la Cooperación y el Desarrollo Económicos (OCDE). El programa estadístico SPSS permitió los siguientes análisis: histogramas, diagramas de dispersión, estadísticas descriptivas para cada una de las variables y segmentos involucrados en la investigación (promedio, moda, mediana, desviación estándar, varianza, mínimo, máximo y amplitud), normalidad de los datos (Prueba de Kolmogorov-Smirnov) y correlación (Pearson y Spearman). El sector de Alimentos y Bebidas fue la tienda física más abierta de Brasil. Tiene (hasta 2010) la mayoría de las personas empleadas, aunque los sectores de Textil y Cuero también han aumentado potencialmente durante el período. Otros equipos y vehículos de transporte, vehículos motor, remolques, semirremolques, derivados de coque y petróleo han contribuido en mayor medida al aumento del PIB. El filtro metodológico podría limitar los hallazgos. Este documento explica y enfatiza los sectores económicos que contribuyeron al desarrollo económico en Brasil, lo que podría ayudar a las autoridades a abordar las inversiones para mejorar los indicadores sociales y económicos.
Palabras clave: sectores económicos, Producto Interno Bruto, Índice de Desarrollo Humano.
Brazilian industrialization according to its technologies intensities
Industrialización brasileña según sus sectores industriales
Universidad de Carabobo
Received: 03 March 2018
Accepted: 16 June 2018
The Brazilian economy had a remarkable growth record by the end of 1920 until the end of the 1970, when the country´s Gross Domestic Product (GDP) had an average rate of 7%. The 1980s were characterized by low FDI inflows and high macroeconomic instability, which led to country to a string recession caused by the high inflation.
The economic, social, and political changes that have occurred in Brazil during the time period 1990 to 2000 mainly resulted from a series of government actions and global changes that caused the attraction and retention of foreign investments in the country. The economy underwent significant structural changes during the 1990s, which changes transformed Brazil into a price stable country and an attraction to multinationals.
Glosny (2010) highlights business opportunities incremented by the economic growth in the last decades of the twentieth century provided business for many developing countries, including Brazil. These businesses and developments came via External Direct Investments (EDI). Technology contributed to the development of international trade and together with globalization and EDI, transformed the society in cultural, political, and social levels. Attributes, such as market consumer potential and stable socio-economic indicators were also decisive in attracting external direct investments (Allison & Hayes, 2000).
In a globalized economy many competitive advantages depend on local factors. For this reason, geographical concentrations play an important role for companies. Therefore, multinational companies not only created more jobs, but also contributed to the economic development of the region (Cracolici, Cuffaro & Nijkamp, 2009) Taking into consideration some studies from Adhikary, (2011) and Azam, (2000) that positively correlate foreign direct investment and economic growth with economic development, this study aims to identify the industrial economic activities that most favored the evolution of the Human Development Index (HDI) and the Gross Domestic Product (GDP) between 1990 and 2010 in Brazil. The chosen period is justified based on two events: (i) the HDI was officially released in 1990; and (ii) the mark of public policies applied to the industrial development effectively with the liberalism political regime (end of the 1980s) (Narula & Dunning, 2000).
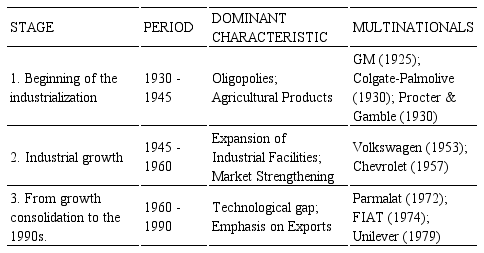
To portray the developmental historical perspective of Brazil, De Lacerda et al., (2001) dismember the economic facts directly related to industrial development and social facts into two major steps: the mercantile period (until 1930), characterized by little progress, and the industrial period (from 1930 onwards), marked (among other things) Brazil's industrial improvement processes and the arrival of multinationals and foreign capital into the country.
In the early twentieth century, Brazil had little economic and industrial influence in the international arena, acting primarily as an exporter of primary goods such as coffee and sugar. During this period, industrial products were imported (Ipea, 2010). The first Vargas government (1930–1945) was significant for the Brazilian industrialization. It obtained technology from the United States for the construction of the National Steel Industry (CSN) in Volta Redonda, Rio de Janeiro, which later opened new ways for other companies. From 1930 to 1960, the non-durable consumer goods (footwear, clothing, food, etc.) and durable industries (furniture, automobiles, etc.) were developed. For the first time, the value of the Brazilian industrial production surpassed the agricultural production (Narula & Dunning, 2000). During all these decades, the industrialization growth mainly occurred in the south and southeast areas of Brazil.
It was only in the next three decades (1960s, 1970s, and 1980s) that the existence of industrialization programs expanded industrialization to the north, northeast, and Midwest regions. In particular, electronic and plastic industries were intensified in these regions (Narula & Dunning, 2000).
The shift of industrial activities in the 1990s to low-cost countries, worked not only by the low cost of production provided, but also for the offer of technological competence in terms of engineers and technicians (Boehe, 2005). With foreign investment, better education, and the increase in the domestic consumption, Brazil became an important economic global player (Cheng et al., 2007; Rodrik, 2004). Also, in the 1990s industry began to adopt management techniques (such as Lean Management, Six Sigma, Root Cause Analysis, and Value Stream Mapping) that were already applied in global industries decades ago (Torche & Ribeiro, 2010).
Following global trends in 1992, President Collor (1990–1992) reduced the imports barriers in the country (Bastos, 2000) which provided a renewal of the industrial and technological parks in Brazil. Although possessing neoliberal ideas, Collor suffered impeachment due to corruption and other illegal actions (Feijó & Carvalho, 2002)
After the Collor government, in 1994, President Fernando Henrique Cardoso (FHC) adopted a neoliberal model with the privatization of almost all state-owned enterprises. FHC introduced the Plano Real (the Real Plan), which became a landmark of his time in the government. The plan aimed to end hyperinflation and bring financial stability back to Brazil. The Real Plan was a package of austerity measures that cut back government spending and tightened tax collection, among other measures. What would be the country’s new currency began as an indexing system; the Unidade Real de Valor (Unit of Real Value), which was tied to the U.S. dollar, soon came to be used as an official indicator of value in taxes and prices. During his mandate, FHC stimulated the manufacturing industry, and the banking sector had further development (Furtado, 2005). Cardoso also aimed to redistribute funds at a national level in order to make public education fair, and Cardoso recognized the need to increase teachers’ salaries in order to attract high-quality candidates and professionals.
In the end of the 1990s and beginning of the 2000s, there was an injection of foreign investments in the food and beverage, machinery and equipment, and metals sectors. It was in the end of the 1990s that many multinationals settled in the country (De Lacerda et al., 2001; Guimarães, 2004).
According to Nassif (2008), in the end of 1990s, there was also a structural change profile marked by the maintenance of the intensive and science-based industrial sectors participation, although the resource-intensive sectors increased their participation to the detriment of the labor-intensive sectors.
Table 1, adapted from Amatucci and Avrichir, (2009) shows the main steps of the Brazilian economy and the coming of the multinationals to the country until the end of the 1990s.
Stages of the Brazilian economy and the multinationals in the country
Adapted from Amatucci and Avrichir
From 2000 onwards, Brazil’s economic pattern has been marked by a strong reduction in external vulnerability, expanded credit-based private consumption, better income distribution, and recovery of the government’s autonomous spending. The three sources of growth (exports, private consumption, and public spending) raised the economy’s investment rate and formal employment (Viana & Da Silva, 2015).
Also, in the 2000s the country returned to a prominent position in the national development. Policies in the technological industry and in the foreign trade aimed at the strengthening and expansion of the Brazilian industrial base through innovation were essential for the country’s competitiveness (Ferraz, 2009).
The growth pattern began to slow down after the world economic crisis in 2008 (the subprime crisis). Even though the labor market was going through a favorable situation when it was hit by the crisis (the unemployment rate was approximately 7.8%), the exports drastically reduced in the following years, resulting in the dismissal of workers from the automation, Leather, and Medical, Optical, and Precision Instruments segments) (Silva, Neto & De Aquino, 2014).
The highlight of this study is the analysis of the Industrial Classification of All Economic Activities of Brazil with selected variables that indicate economic development.
UNIDO (United Nations Industrial Development Organization) database was chosen for this study; a database that includes information on the industrial production of 169 countries between the years 1963 and 2010 (INDSTAT, 2006). However, because of some gap information in the time series, the analysis was focused on the years 1990–2010. This selection was also justified by the parallel analysis of the Report on Human Development (1990) concurrently with the HDI.
The data preparation took place through two main secondary sources:
1) Classic books on the subject, government websites, and scientific papers. Through these sources, it was possible to understand the historical and evolutionary issues of industrial and economic development in Brazil. Two were the most used criteria for the selection of the papers from Papers from Scopus, Web of Science, and Wiley databases. The number of citations of each publication was also considered.
2) UNIDO database, which provides a set of categories of industrial productive activities that can report on the following variables:
i) Number of industry units;
ii) Number of Employees: the number of people who worked in or for the establishment during the reference year;
iii) Salaries and Wages: include all payments in cash or in kind paid to "employees" during the reference year for the work done to the property.
In this study, the industrial activities with its variables i, ii, and iii were separated according to their industrial levels: High (H), Medium High (MH), Medium Low (ML), and Low (L). The effect of each of these independent variables on the economic growth (GDP) and the HDI were then estimated. As these two variables are highly correlated variables for addressing essentially the same phenomenon (physical capital and/or industry productivity), an estimate for each independent variable was made, in order to avoid multicollinearity problems, aiming to test the robustness of the results.
Table 2 lists the industrial activities, as classified by the United Nations, with the relative technological levels. The aggregation of these variables by technological levels was selected in view of the literature inferences about the different effects that each technological level has on the economic growth and development. In this sense, the OECD classification was used.
The classification of industrial activities by technology levels

Adapted from the UNIDO database
The HDI data was extracted from the United Nations website, 23 and because data was not available for the whole period, it was necessary to perform data interpolation using the data mining algorithm SMOReg (a role-based algorithm through one Application Programming Interface (API) to predict the missing numbers. In relation to the GDP, the values were collected from the UNCTAD website. Data analysis procedures are summarized in Table 3.
Data analysis procedures used in this study

Because of the occurrence of temporal gaps in data dissemination, the period from 1990 to 2010 was selected for analysis; this selection was also justified by the parallel analysis of the Human Development Report, which emerged in 1990, concomitantly to the HDI.
The use of the SPSS statistical program allowed the following analyses: histograms, dispersion diagrams, descriptive statistics for each of the variables and segments involved in the research (average, fashion, median, standard deviation, variance, minimum, maximum, and amplitude), normality of data (Kolmogorov-Smirnov test), correlation (Pearson and Spearman), and linear regression with the least squares estimation technique. In the regression analysis, the results were not analyzed according to the parameterizations of the model because this type of work must be done by a meteorologist or another qualified professional.
Microsoft Excel enabled simplified graphing and statistical analysis, which complemented the analysis of results.
This work is classified as listed in Table 4.
Research classifications of this study

As this paper does not intend to detail how the formation of the indicators of the UNIDO database was carried out, more information is available on the website. The above-mentioned variables are available from the United Nations for various industrial production segments, presented in Table 5, and detailed in the International Classifications of All Economic Activities - Review 4, prepared by the United Nations Statistics Division.
Industrial segments as outlined in International Classifications of All Economic Activities - Review 4

In this study, the independent variables were the number of employees, the amount of salaries/income, and the number of establishments. All of these variables are in annually base.
Two dependent variables, HDI and GDP, were selected for the study because of the production influence may have on them, and because they are widely used as parameters of economic development, as discussed along the theoretical reference. The HDI data were extracted from the United Nations website and since there were no values available for the entire analyzed period, it was necessary to perform data interpolation using the SMOReg Forecast data mining algorithm, a function-based algorithm, through An Application Programming Interface (API). The GDP values were collected by the World Bank website. In summary, the data collection is as described in Table 6.
Data collection information about this study

The values of this variable presented high amplitude of the data, which indicated the presence of outliers or the average value does not correspond to its real value (being higher or lower). It is also important to note that the standard deviation of this variable was also high.
Four economic sectors were prominent due to the number of opened establishments as seen in Table 7.
Economic sectors that most opened stablishments in Brazil

Out of the 23 types of industries, the Food and Beverage sector was the industry that most opened physical stores in Brazil between 1990 and 2010, with an average of 23,994 establishments. Following the Food and Beverage segment comes the Textile sector with 17,936 establishments, and Metal Products and Furniture, with 13,262 and 12,265 establishments, respectively.
Recycling, Oil, and Tobacco Products were sectors that least opened establishments. Together, the average of these facilities did not total 250 places. According to Silveira and Dornelles (2010), this index was already estimated because the latter two sectors are characterized by intense oligopolistic competition in the markets in which they operate. From 1996 to 2010, 14 segments showed a gradual increase in their number of establishments; this percentage varied between 133.58% as higher growth (Machinery and Equipment) and 31.59% as lower growth (Chemicals). Basic Metals and Medical, Optical, and Precision Instruments expressed the largest reductions in the number of establishments in the early 1990s, being 14.7% and 25%, respectively.
Three industrial branches were prominent due to their results in hiring employees as shown in Table 8.
Economic sectors that most hired employees in Brazil

Together, the first two sectors did not total the amount of jobs generated by the third sector, Food and Beverage. This sector is also notable for having presented growth in the hiring of individuals, practically every year.
In 1990, Food and Beverage employed 634,898 people, while in 2010 this sector exceeded 1,612,291 employees, which almost tripled the generation of employment in a decade. With more jobs, more people getting paid and often receiving other benefits, there is more money circulating in the market. Parallel to this, it is important to remember that the government also collects more taxes. Textile and Leather had an increase of 78% during the time from 1996 to 2010. Over the same time period, the Footwear sector grew 54.3%. Two segments were relatively little employed, when compared with others, as seen in Table 9.
Economic sectors that least hired employees in Brazil

As highlighted in Baltar et. al. (2010) study, the employment of the low and mid low industries sectors helped to increase the consumption, as these segments were directly associated with the increase in labor income and employment. These segments also helped the reduction of unemployment by an increase in the share of formal employment.
It was found that the majority of the segments presented an average salary of about one billion dollars. However, during the studied period, Recycling paid the lowest salary amount of $25.063.590,50. Over time, this sector presented a relative increase, with 2007 being the year of greatest expansion. Office Machinery and Computer Products and Tobacco Products were the other two industrial activities that had the least expenses of employee salaries, with $224.608.763,00 and $243.446.089,50, respectively. The productivity of the high technology group and market shows higher labor productivity, as expected (Jacinto & Ribeiro, 2015). Tobacco Products, although in terms of wages paid little, when compared with other sectors, presented and continues to contribute positively to the national GDP. This is because the government charges high taxes on this type of product. According to the National Cancer Institute and Philip Morris International, Tobacco Products are taxed on a global average at 60% of the selling price of the product, generating more than USD 200 million of annual tax revenue dollars for governments.
For the selection of segments that paid higher salaries from 1990 to 2010, those values above USD 2 billion were used, where on average, the industries spent USD 1 billion.
The economic growth of a country can be defined by the increase in its production and can be assessed by the GDP calculation. This alone does not reflect the quality of life. However, GDP influences personal satisfaction, among many things. On the other hand, the HDI can show the overall progress of a nation.
Four segments stood out in the descriptive analysis in relation to the productive increase, being: Other Equipment and Transport Vehicles (501.2%), Motor Vehicles, Trailers, and Semitrailers (282%), Coke and Petroleum Derivatives (360%), and Office Machinery and Computer Products (1.422%). These results were most significant during the years 1996 to 2010, when inflation in the early 1990s was already controlled, and Brazil started to attract more FDI (Jacinto & Ribeiro, 2015). This study obtained four regression models for the GDP per capita variable, and it is shown in Table 10.
Regression models of 4 sectors for the Brazilian´s per capita GDP

The results indicate the existence of four sectors capable of explaining the increase of Brazilian GDP per capita between 1990 and 2010. These sectors are wages of Non-metallic Mineral Products, wages of Plastic and Rubber Products, wages of Manufactured Metal Products, and the number of establishments for Office Machinery and Computer Products.
To complement the analysis, Triola suggests the R² analysis because it is the measure of the proportion of the variation occurring in the dependent variable (GDP per capita), which is explained by the variation in the explanatory variable. Therefore, the summaries of the models with R², known as coefficient of adjustment or explanation, are shown in Table 11.

It is noted that the ordinary least squares models (OLS), an R2 above 0.99 independent variables have a high degree of explanation regarding the dependent variable. Thus, GDP per capita can be explained at 99% by the four segments. Although the errors (the difference between the observed and predicted values) are high, they can be justified by the size or handling of high numbers.
The Durbin-Watson test was also performed to determine the interference of the errors. According to Triola, the Durbin-Watson test values can range from 0 to 4; a value greater than 2 indicates negative correlation between adjacent residues, and a value less than 2 indicates a positive correlation. In this study, the Durbin-Watson test presented 0.39.
The analysis of variance aimed to compare the models and to evaluate the significance of the regression to determine the significance of the model. Table 12 displays these values.
ANOVA results of the dependent variable: GDP per capita

The ANOVA presented a p-value of 0.001, regardless of the model, indicating that all are highly significant. Thus, the four presented segments were significant for the contribution of the Brazilian GDP rate between 1990 and 2010.
Although the models are significant, it was opted for the exclusion of the office machinery and computer products sector, which is present in models, both for the negative contribution of the beta value and because of the misalignment with the other variables, compared to the other segments. It is the industrialist sector which produces for final consumption, and with lower added value such as typewriters, calculators, photocopying machines, etc (Furtado, 2005).
Studying the pattern of productivity evolution is justified by the need to understanding and monitoring the competitiveness of a country in order to maintain a sustainable economic growth (Jacinto & Ribeiro, 2015). According to many economists, the Brazilian industry has continued to present bad results. Although the appreciation of the dollar may contribute to the increase of exports of domestic industrialized products (such as agro-business products), there are factors, apart from the exchange rate, which could harm this sector. Declining investments, reduced consumption (mainly of durable goods), and economic crisis are the main worrying factors for Brazil's industry consolidation.
The Food and Beverage sector is the one that most opened physical stores in Brazil, and at the same time it has (until 2010) most employed people, although the Textile and Leather sectors have also potentially increased during the period. In terms of production growth, Other Equipment and Transport Vehicles, Motor Vehicles, Trailers, and Semitrailers, and Coke and Petroleum Derivatives have most contributed to the GDP increase. According to Baldwin (2011), the incorporation of industrial activities that most influenced the GDP was influenced by two main factors: the public policies implementation of the 1980s and 1990s, and also the arrival of multinational industries that brought along know how and technologies.
An extensive participation of foreign companies without Brazilian industrial growth (during the dictatorship) meant that foreign capital was important for the structure and composition of the manufacturing sector in Brazil (Tyler, 2018).
Notice the ordinary least squares model (OLS), an R2 above 0.99 independent variables have a high degree of explanation regarding the dependent variable. Another test performed in order to determine the interference of the errors was the Durbin-Watson test. In this study, the Durbin-Watson test presented 0.39. Although the four models are significant, it was opted for the exclusion of the office machinery and computer products sector.
The ANOVA test and regression were valid for the GDP variable. The ANOVA results indicated the difference between the mean in each sector studied in this paper. Thus, the regression pointed out the possibility to predation of other results by the coefficient beta of the sector. However, the office machinery and computer products have an aggregated value larger than of other sectors and the influence in Brazilian GDP is lower. This represents the low technology presented in Brazilian industries.
The relationship between structure and growth is a starting point to understand the dynamics of productivity, both for theoretical and by empirical results. The economic development of a country goes through its productive structure. Several authors draw attention to a positive path of growth, where changes in structure are associated with increases in productivity, specially via technological driven sectors (Rocha, 2007).
Stages of the Brazilian economy and the multinationals in the country
Adapted from Amatucci and Avrichir
The classification of industrial activities by technology levels
Adapted from the UNIDO database
Data analysis procedures used in this study
Research classifications of this study
Industrial segments as outlined in International Classifications of All Economic Activities - Review 4
Data collection information about this study
Economic sectors that most opened stablishments in Brazil
Economic sectors that most hired employees in Brazil
Economic sectors that least hired employees in Brazil
Regression models of 4 sectors for the Brazilian´s per capita GDP
ANOVA results of the dependent variable: GDP per capita
