Article of Scientific and Technological Research
Productive efficiency of intellectual capital-added value in large agroindustry companies
Valor adicionado a partir de la eficiencia productiva del capital intelectual en grandes empresas agroindustriales
 Jairo Alberto Olarte Cabana jalbertoolarte@ucompensar.edu.co
Patricia González González patricia.gonzalez@correounivalle.edu.co
Jairo Alberto Olarte Cabana jalbertoolarte@ucompensar.edu.co
Patricia González González patricia.gonzalez@correounivalle.edu.co
Productive efficiency of intellectual capital-added value in large agroindustry companies
Cuadernos de Administración (Universidad del Valle), vol. 38, no. 74, e2411919, 2022
Universidad del Valle
Received: 29 March 2022
Revised document received: 29 May 2022
Accepted: 30 June 2022
Published: 30 January 2023
Abstract: This paper aims to posit the Value-Added Intellectual Coefficient (VAIC) as a tool to measure the added value created from the productive efficiency of intellectual capital in large agroindustrial companies in the department of Magdalena, Colombia. To this end, value-added statements were prepared. Then, VAIC methodology-proposed indexes were determined, and finally, the association hypotheses and significant relationship between the VAIC and financial indicators were confirmed. Based on the validation of hypotheses, estimators, multiple linear regression analysis, and panel data, per the empirical results, most of the analyzed companies scored well in terms of value-added creation. Likewise, the VAIC’s solid explanatory capacity of human capital efficiency was validated concerning the values obtained in operating profit. This result confirms the assumptions of the theory of resources and capabilities.
Keywords: Measurement, Added value, Intellectual capital, Added value ratio.
Resumen: El objetivo de este artículo, es proponer el Value-added Intellectual Coefficient (VAIC) como una herramienta que mide la creación de valor adicionado a partir de la eficiencia productiva del capital intelectual en grandes empresas agroindustriales del departamento del Magdalena, Colombia; para ello, se elaboraron estados de valor adicionado, luego se determinaron los índices propuestos por la metodología VAIC, y, finalmente, se confirmaron las hipótesis de asociación y relación significativa entre el VAIC e indicadores financieros. En los resultados empíricos, basados en la validación de hipótesis, estimadores, análisis de regresión lineal múltiple y panel de datos, la mayoría de las empresas analizadas obtuvieron una nota con concepto bueno frente a la creación de valor adicionado; así mismo, se validó la fuerte capacidad de explicación del VAIC, en sí, de la eficiencia del capital humano, con respecto a los valores obtenidos en la utilidad operacional; resultado que confirma los supuestos de la teoría de los recursos y capacidades.
Palabras Clave: Medición, Valor adicionado, Capital intelectual, Coeficiente de valor adicionado del capital intelectual.
I. Introduction
The knowledge-based economy has given rise to new social, political, financial, and economic realities, affecting organizations’ productive processes. In this sense, Pulic and Kolakovic (2005) identify intellectual capital as a determining factor and following the importance of its intangible nature; it is considered fundamental to achieving the purposes outlined by decision-makers at the organizational level. From the aforementioned scenario, Pulic (1998) highlights the absence of tools to measure added value creation based on the productive efficiency of intellectual capital and assets, for existing indicators fail to capture the entirety of the economic context of the 21st century or observe with myopia, thus leading to partial analyses of organizational reality.
Pulic (1998) draws attention to what could be considered a high degree of ignorance of the value-creating potential of human talent in organizations. This Pulic validates by affirming that personnel payments are recorded in cost or expense accounts and not considered an investment, neglecting that a share of organizations’ value creation arises from employees’ input skills and knowledge. Therefore, for Pulic (1998), payroll items should be considered an investment. On the other hand, despite the multiple measurement models referenced in the literature offering a solution to the information asymmetries exposed by traditional financial reports and indicators, many of these are only helpful in management. However, such models fail to measure intellectual capital’s productive efficiency (Iazzolino and Laise, 2016).
Without a methodology to validate intellectual capital as a value creator from a financial perspective, Pulic (1998) designed the VAIC to measure value creation and the productive efficiency of intellectual and physical capital in an organization, region, or country. In this way, he proposed the Statement of Value Added as a report that accounts for the value that organizational resources create, which is identifiable thanks to the relationship between value-added and intellectual capital: human and structural and capital employed: physical-financial. Therefore, the application of the VAIC, and specifically the relevance of this paper, focuses on the limited empirical evidence on emerging methods such as Pulic’s (1998) in palm oil-producing companies in the department of Magdalena, Colombia. Furthermore, the above represents an opportunity to introduce new concepts that allow an understanding of the specificities of the knowledge economy and its particular dynamics from an accounting perspective.
This research also could provide some insights as to the importance of measuring and managing intellectual capital in the organizations studied; first of all because innovations and productive efficiency with the capacity to generate value for stakeholders derive from it (Xu and Zhang, 2021; Xu and Liu, 2020; Sardo and Serrasqueiro, 2018 and Arpad, 2017). Thus, this research is a contribution inasmuch as it describes and applies a methodology that makes explicit, in a financial language, how intellectual capital is an input to the creation of value and, therefore, affords measurements that may be incorporated as information sources into organization’s decision-making on personnel, organizations such as those analyzed in the sector and context in which this work unfolded. Methodologically, it is noteworthy that the models outlined in this article may constitute a roadmap for future research on intellectual capital.
A review of the background makes it possible to assert that no research akin to this one has been conducted in large companies belonging to the Oil Palm Agroindustry from the department of Magdalena, Colombia. However, in the frontier literature, there is evidence of VAIC applications to study organizational performance and its relationship with intellectual capital. Bontis. et al. (2015) provided empirical advancements in the field of intellectual capital and value creation in tourism companies in Serbia and Costa et al. (2019) adopted the same approach in Portugal’s tourism industry. Meanwhile, Chowdhury et al. (2019) investigated the relationship between intellectual capital efficiency and organizational performance in the pharmaceutical sector in Bangladesh, while Acuña and Contreras (2021) studied financial performance and value-added generation in family firms based on intellectual capital as a determinant variable.
In 2012, Ghosh and Mondal calculated India’s banking sector VAIC. In contrast, Pal and Soriya (2012) demonstrated how the efficiencies that comprise VAIC explain value creation from intellectual capital and how it impacts financial ratios. In turn, Cahill et al. (2013) conducted studies in organizations belonging to the financial sector in Australia and discussed how VAIC explains the behavior of financial variables. Along the same line, Xu and Zhang (2021) studied the significance of IQ on performance in agricultural companies in China. To that end, they applied the VAIC methodology, analyzed the data through a panel, and found a positive and significant relationship between intellectual capital and financial performance.
As a theoretical foundation, Grant (1991), grounded in the theory of resources and capabilities, mentions that a company’s competitive advantage is sustained by using its tangible and intangible resources (Xu and Zhang, 2021; Abdur et al., 2020). DiMaggio and Powell (1983) are authorities in institutional theory (from an organizational studies perspective) and provide a broad view of social and economic events’ dynamics, especially those that take place in the sphere of organizations (Ibrahim, 2017). For their part, McPherson and Pike (2001) and Pike and Ross (2004) are a beacon of measurement theory, a key aspect for understanding the measurements proposed by Pulic (Ramírez and Gómez, 2013).
Aside from being considered organizations’ new wealth, intellectual capital and its components have been a focus of questioning for some decades due to their high strategic value, emerging in the 1990s from the differences between market value and book value in an organization. From Pulic’s (2008) point of view, intellectual capital is a term associated with the intellectual production of human talent and comprises two elements: human and structural capital. Concerning human capital (HC), Pulic (2008) contributes new meanings to the literature and regards it as the knowledge that employees possess and make available to the organization; however, this is not identifiable through indicators or items1, but through payroll payments, thus becoming an operational expense in origin, according to financial accounting. Structural capital (SC) is the knowledge that has been systematized and enables the improvement of the organization’s internal processes. For Pulic (2008), this is conceived as the residual portion or flow of added value after deducting human capital from the added value (Pulic, 2008).
Regarding how the VAIC is determined, it measures the creation of added value resulting from efficiently using intellectual capital; specifically, it accounts for the value created per monetary unit invested in all organizational resources, tangible and intangible. Pulic (1998), the creator of this methodology, uses financial statements to calculate the value added, the efficiencies of intellectual capital, and the capital employed, thus mirroring the creation or destruction of value. In a complementary manner, authors such as Abdulsalam et al. (2011) point out that the methodology is objective in that it focuses on quantifiable measures that reduce subjectivity in the estimates. They further emphasize that using financial measurements allows it to dialogue with other indicators, even under the same monetary unit of measurement.
Calculating the VAIC requires identifying companies’ ability to create added value (VA) in the first stage, for which Pulic (2008) proposes a scheme focused on the difference between the inflows and outflows of resources. The structure comprises net sales revenue, costs, and expenses (not including salary expenses and items that do not involve cash outlays, such as depreciation, amortization, and provisions). It is expressed through this formula: VA = Total sales (-) costs and expenses.
According to Pulic (2008), the second stage of the VAIC calculation determines the Human Capital Efficiency Index -(IECH), the Structural Capital Efficiency Index (IECES), and the Employed Capital Efficiency Index (IECE). IECH accounts for how each monetary unit allotted to human capital creates value and is identifiable through salary payments and other employee-related costs. It is given by dividing the value added by human capital, i.e., IECH equals VA/CH. IECES represents the ratio of structural capital (CES) to VA. It is calculated as follows: IECES: CES/VA. Thus, the sum of the efficiency indexes of human and structural capital makes up Intellectual Capital Efficiency (IECI), which can be synthesized in the following formula: IECI = IECH + IECES. Finally, the Employed Capital Efficiency Ratio (IECE) is determined, wherein employed capital (CE) is the book value of equity, and the employed capital efficiency Ratio (IECE) is equal to IECE = VA/CE. The third step to determine the Intellectual capital value-added coefficient (VAIC) results from adding up the three efficiencies found: VAIC = IECH + IECES + IECE.
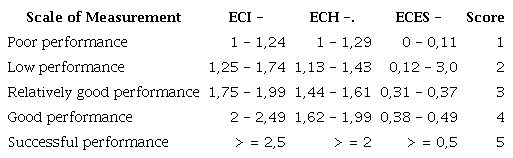
The results derived from applying the above indicators can be interpreted according to the following scoring scale to measure the efficiency of intellectual capital; it should be noted that Pulic (2008) proposed this scale (Table 1).
1.1. Research hypothesis
The above-referenced studies affirm a positive relationship between financial performance indicators and VAIC; therefore, intellectual capital can be said to impact organizations’ performance (Pulic, 1998) positively. In concomitance with the above, Figure 1 proposes the hypothesis model to be validated, which comprises the variables to be studied with the VAIC, including UO, ROA, and RAC.
The hypotheses to be tested are presented below:
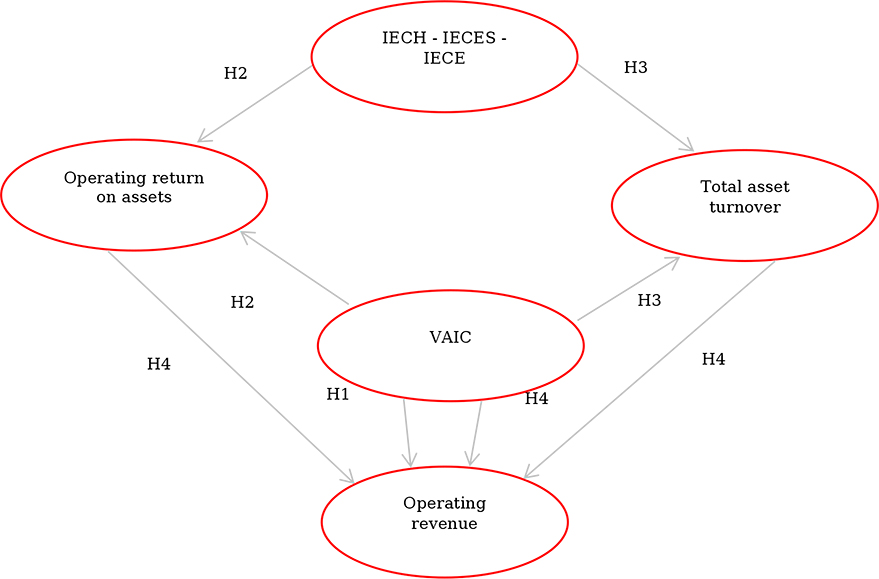
Figure 1
Conceptual model of hypotheses to be tested
Source: Authors’ own elaboration
H.1. Operating revenue -OU- is positively and significantly associated with VAIC -Model1. This hypothesis uses operating revenue as the explained variable because it synthesizes the results of the value-added statement proposed by Pulic.
H.2. The operating return on assets -ROA- is positively and significantly related to the human, structural, and employee capital efficiency indexes -IECH, IECES, IECE- and VAIC -Model2. This hypothesis holds ROA as a financial performance indicator that mirrors management’s efficiency in relation to the use of assets.
H.3. Total asset turnover -TAC- is positively and significantly related to the human, structural, and employee capital efficiency indexes -IECH, IECES, IECE- and VAIC -Model3. This hypothesis is intended to provide a second efficiency indicator on the productivity of tangible assets and observe if the VAIC influences it.
H.4. Operating revenue (OU) positively relates to VAIC, operating profitability, and total asset turnover (Model 4).
The following questions are answered considering the above arguments: How can added value creation be measured based on the productive efficiency of intellectual capital? What linear relationships exist between VAIC and financial performance indicators in the organizations studied?
Finally, our objective is to measure added value creation from the productive efficiency of intellectual capital in large companies from the Oil Palm Agroindustry of the Department of Magdalena, Colombia. Structurally, this document consists of the following sections: the background gives an account of the theoretical-conceptual references supporting the studied variables. Then, the research hypotheses are outlined, and quantitative methods -VAIC and parametric analysis - are applied to the data collected from the organizations to the sample -chosen through non-probabilistic sampling. In this way, the application of the VAIC methodology continues. The creation or not of added value is determined, and linear association tests between operating income, operating profitability of assets, and total asset turnover as a function of the VAIC and its efficiencies are carried out. The conclusions will be at the end.
2. Research design
2.1. Methodological structure
The research design is non-experimental, the method is deductive, the scope is correlational, its purpose is practical, and its approach is based on quantitative data analysis. The data were analyzed through descriptive statistics, normality tests, and correlation matrix. Similarly, parametric analysis was linked to multiple linear regression tests (considering the hypotheses and assumptions for determining the properties of the model estimators: stochastic relationship, homoscedasticity, and non-autocorrelation). The data used to determine the VAIC were company financial statements (certified and audited by the statutory auditor institution in Colombia) for 2014, 2015, 2016, 2016, 2017, and 2018. These are characterized by being longitudinal and transversal (time series), enable analyzing changes over time, and are appropriate for using the panel data (financial data was processed through the statistical and econometric package Eviews).
2.2. Sample
Data were collected from four (4) companies (20 observations) belonging to the sector studied. These companies are characterized as follows: large companies, extraction of crude palm oil and its derivatives as an agro-industrial activity, legally incorporated and use the accounting regulations of group II from the International Financial Reporting Standards for SMEs in Colombia. The companies in this case study will be identified as company 1, company 2, company 3, and company 4 due to company data confidentiality.
On the other hand, it should be noted that the sampling was by convenience or intentional due to the limitations of accessing public information with data as detailed as required for applying the VAIC methodology, meaning it was imperative to gain direct access to the source. The latter is a difficult barrier to overcome due to the limited dissemination of financial information, as it is considered privileged and restricted to internal users. Furthermore, some organizations’ minimal involvement in academic projects, such as the one posited here, reduces the possibilities of realizing university-company cooperation initiatives. Even so, specific alliances made it possible to access the financial statements of 4 large companies interested in participating in the research.
2.3. Measurement of variables
Dependent variables:
-
Operating Profit (OU): Sales (-) Operating costs and expenses.
-
Return on Operating Assets (ROA): Operating income/total assets.
-
Total asset turnover: = sales/total assets .
Independent variables:
-
Value-added Intellectual Capital Coefficient -VAIC-: an indicator that allows measuring the productive efficiency of intellectual capital.
-
Intellectual capital efficiency indexes: IECH, IECES, IECE.
2.4. Empirical models
Taking into account the hypotheses proposed, the models designed to apply regression tests and examine the existence of a linear UO-VAIC association between the latter and its components with respect to financial indicators, such as the operating return on assets and total asset turnover, were prepared.
2.5. Regression equations
UO = β0it+ β1(VAIC)it+ Eit(H. 1)
ROA= β0it+ β1(VAIC)it+ β2(IECH)it+β3(IECES)it+ β4(IECE)it+ Eit(H.2)
RAC = β0it + β1(IECH)it+β2(IECES)it+β3(IECE)it+β4(VAIC)it+Eit(H.3)
UO = β0it+ β1(VAIC)it+ β2(ROA)it+ β3(RAC)it+Eit(H.4)
3. Results and discussion
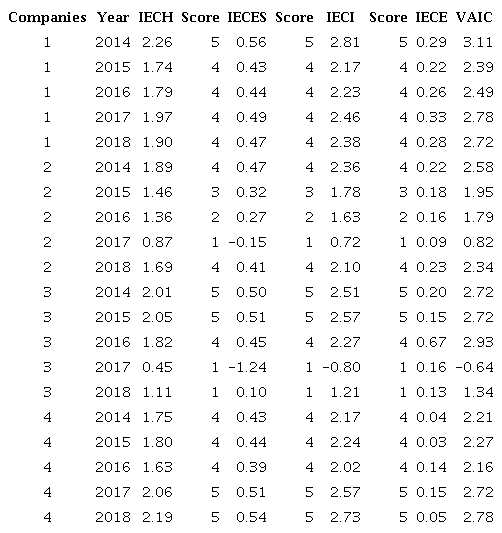
The development of the stages required by the VAIC made it necessary to prepare value-added statements to find the efficiency indexes of the intellectual capital (human and structural) and the capital employed. Furthermore, the financial indicators were determined. The efficiency indexes and the rating attributed according to González (2017) (who proposes a complement to Pulic’s (1998) measurement scale) were calculated (Table 2) after having the value-added statements.
Source: Authors’ own elaboration based on research data.
The data in Table 2 show that most of the cases studied move between good and successful performance regarding the efficient use of their intellectual capital. The most common rating is good performance (4), followed by a successful, relatively sound, low, and inferior performance for the years in which the organizations showed operational losses.
3.1. Hypothesis validation
The descriptive statistics and correlation matrix are presented, to begin with, followed by a description of the results obtained in the linear regression models2. In this regard, it is vital to mention that the IECES variable was not significant in any option it was proposed as an explanatory variable; therefore, it was excluded from the presentation of the models.
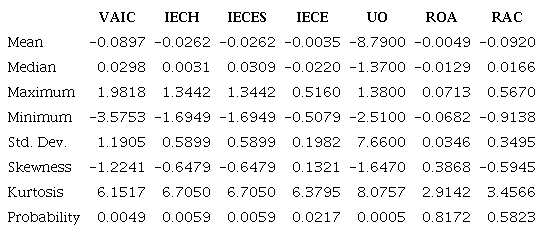
3.2. Descriptive statistics
Table 3 shows that the analyzed data have a -0.0897 mean. Following the figures that make up the database of the four (4) companies under study and taking into account the average value of the VAIC series, the following results are presented: in 2015, companies No. 1 (-0.7199) and No. 2 (-0.6282) were below the mean, whereas companies No. 3 and 4 (0.0002) (0.0620) were above it, respectively. In 2016, Company No. 2 (-0.6282) and company No. 4 (-0-1144) had indexes below the average, while No. 1 (0.0978) and No.3 (0.2176) had superior indicators.
Source: Authors’ own elaboration based on research data.
Companies No. 2 and 3 saw indexes below the average in 2017, i.e., (-0.9693) and (-3.5753), respectively. Contrarily, companies No. 1 (0.2959) and 4 (0.5667) saw higher values. Finally, all the organizations yielded VAIC values above the average in 2018: Company No. 1 (-0.0626), company No. 2 (1.5192), company No. 3 (1,9817), and company No. 4 (0.0593). On the standard deviation side, from the VAIC variable, the behavior of the companies tends to deviate or display a deviation behavior of 1.1905.
On the other hand, Table 4 shows a robust positive correlation of 94.77% between the UO variable and VAIC. The VAIC and ROA variables displayed the same dynamics with an 85.38% correlation, which indicates that increases in VAIC indexes represent increases in the return on the financial return on assets (ROA). Also, note that the IECH variable has a high correlation with the operating profit (UO) at 97.44%.
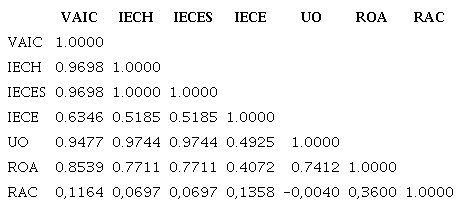
Source: Authors’ own elaboration based on research data.
3.3. Discussion of the Panel Data Model results
At this point, it is worth pointing out that using the panel data technique requires choosing how the panel will be configured, whether the starting point is a single company, fixed-company, fixed-time, random or dichotomous behavior. Considering the above explanation and after reviewing the results of the Hausman test (which checks which model is suitable for further interpretation), the model that best explains the interactions between the variables is the random model. The results of the linear regression models and the validation of hypotheses are presented below (see regression model 1 in Table 5).
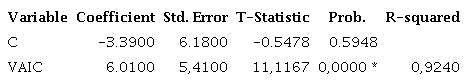
Notes: * Indicates significance level at 1%. Model 1: UO = β0it + β1(VAIC)it + Eit.where: UO is Operational Profit; β0: constant; VAIC is Value Added Intellectual Coefficient; I: firm; t; year. Source: Authors’ own elaboration based on research data.
As can be seen, regression model 1 (Table 5) signals that the relationship is significant, given that it explains 92.40% (R-Squared) of the behavior of the dependent variable. Its Durbin.Watson Stat indicator is 2.298, which is still considered a positive referent to identify the absence of autocorrelation problems. Finally, the F-Statistic value of 33.44 reveals the model’s explanatory properties; therefore, hypothesis No. 1 is accepted since the model provides confidence and is conclusive.
The results obtained through model 1 are shared by Bontis et al. (2015) in reporting a solid correlation between UO and VAIC by validating explanatory power at 67.5%; in other words, VAIC can explain 67.5% of the variations in operating revenue. In a complementary manner, González (2017) and his research results assert that VAIC explains 40% of the changes in the operating revenue of large companies employed for the case study in Colombia. The above is within the framework of a 0.00269917 probability, a t-statistic of 3.47557637, and an F-statistic equal to 12. Also, the results of Chowdhury et al. (2018) and Jin and Xu (2022) are consistent with the validation of hypothesis 1.
The results thus far derive an analysis that supports the fulfillment of what the theory of resources and capabilities posits since the positive indicators of VAIC and its explanation concerning changes in operating profit are representative of the efficient use of each organization’s resources and that, as a whole, contribute to the creation of value. This finding is of utmost importance for the organizations studied, as it allows them to see the allocation of human capital as a source of value creation and the main asset in improving organizational competitiveness and sustainability.
Table 6 shows the model for validating hypothesis No. 2, where VAIC significantly and positively explains the changes in ROA -0.0001. Likewise, variables IECH -0.0013- and IECE -0.0026- exert a robust explanatory power. The model presents an adjusted R-squared with a value of 87.69%, which is significant in relation to the behavior of the explained variable. The F-statistic yielded a value of 36.65, i.e., it is positive and explains the relationship between the ROA variable and the proposed explanatory variables as a whole.
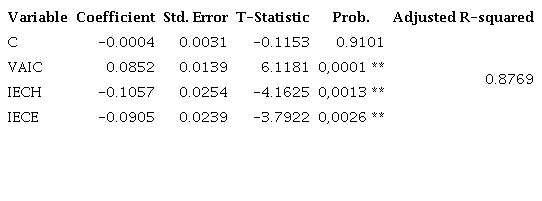
Notes: * Indicates significance level at 5%. Model 2: ROA = β0it + β1(VAIC)it + β2(IECH)it + β3(IECES)it + β4(IECE)it + Eit. Where ROA is the operating return on assets; β0 is the constant; VAIC is the Value Added Intellectual Coefficient; IECH is the human capital efficiency index; IECES is the structural capital efficiency index; CCEE is the capital employed efficiency index; I the firm; and t the year. Source: Authors’ own elaboration based on research data.
Regarding the fulfillment of the assumptions under the classic regression model, model 2 (hypothesis No. 2) yielded a Durbin-Watson Stat indicator of 1.259, which is acceptable for discarding autocorrelation problems and fulfills the independence assumption (Field, 2009). Additionally, the criteria established by Bartllet (1937), cited by García and Ortiz (2017), allow us to identify that these are homoscedastic. Finally, according to the Jaque Bera test, there is a normal distribution of the data with a probability above 5%. Per the preceding, hypothesis No. 2 is accepted as the VAIC significantly explains ROA changes. Considering that we intended to learn how each element from the VAIC helps explain the ROA, the IECES (Structural Capital Efficiency Index) independent variable was not significant in explaining variations in the operating return on assets; therefore, it was excluded from the model (See Table 6).
The application of ROA to measure financial performance is configured as one of the most representative variables in this type of measurement (Jin and Xu, 2022; Xu and Zhang, 2021; Chowdhury et al., 2019; Tiwari and Vidyarthi, 2018; Bontis. et al., 2017; Nawaz and Haniffa, 2017; Cahill. et al., 2013 and Komnenic and Pokrajcic, 2012). Specifically, the literature validates a significant association between ROA and VAIC. In the case of Tiwari and Vidyarthi (2018), VAIC significantly explains changes in ROA, with a probability (F-Stat) of 0.000 and an Adjusted R2 of 61.54%. Similarly, Ting and Lean (2009) conclude that VAIC and ROA are significantly related and agree, along with Nawaz and Haniffa (2017), that IECH and IECE are what most contribute to this relationship.
In the validation model for hypothesis No. 3, no explanatory goodness of fit is observed from the individuality of the variables (VAIC (0.5736), IECH (0.5847), IECE (0.9646)), nor the general characteristics of the model. Therefore, there is no significant linear association (Adjusted R-Squared 19.36%) between the variables tested; thus, the hypothesis is rejected (Table 7).
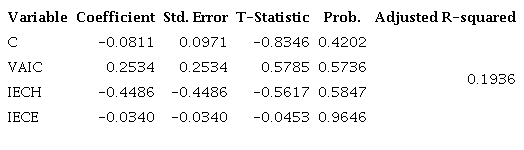
Note: Model 3: RAC = β0it + β1(IECH)it + β2(IECES)it + β3(IECE)it + β4(VAIC)it + Eit. Where RAC is total asset turnover; β0 is the constant; IECH is the human capital efficiency index; IECES is structural capital efficiency index; IECE is capital employed efficiency index; VAIC is Value Added Intellectual Coefficient; I the firm; and t the year. Source: Authors’ own elaboration based on research data.
This is consistent with the results obtained by Chowdhury et al. (2019) in identifying a negative and non-significant correlation between VAIC and asset turnover (RAC). Similarly, Komnenic and Pokrajcic (2012) revealed that structural capital is not associated with the above productivity measure. This is why, particularly for this paper, the IECES variable was excluded from the regression model. Finally, the last model (see Table 8) aims to measure the link between the VAIC, ROA, and RAC variables in their explanatory capacity for changes in operating revenue.
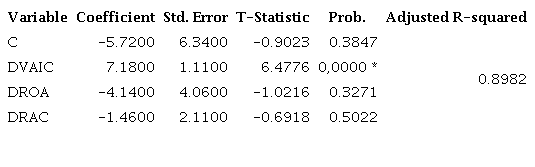
Notes: * Indicates significance level at 1%. Model 4 UO = β0it + β1(VAIC) it + β2(ROA) it + β3(RAC)it + Eit. Where UO is operating revenue; β0: is the constant; VAIC is Value Added Intellectual Coefficient; ROA is the return on assets; RAC is total asset turnover; I the firm; and the year. Source: Authors’ own elaboration based on research data.
Thus, only the VAIC variable (0.000) was explanatory of changes in UO. This finding coincides with model 1; however, the ROA (0.3271 P-test) and RAC (0.5022 P-test) variables are insignificant in explaining UO variations. To conclude this part of the paper, it is worth noting that our findings confirm some of the arguments put forward in the introduction above, i.e., applying the VAIC methodology affords human capital managers a methodology to financially measure how it creates value and contributes to the fulfillment of strategic objectives. Thus, management is provided with a new perspective that offers the actual value of the people attached to the organization, who make their knowledge available to the organization to generate added value.
4. Conclusions
The oil palm sector in Colombia is consolidating as an emerging market and, therefore, should not be reduced to the classic factors of production. Thus, it becomes imperative to recognize the value-creating potential of intellectual capital, especially human capital. The results lead to the conclusion that the VAIC methodology is a fundamental instrument for measuring the impact of intellectual capital on the value creation of the companies analyzed since the VAIC is the sum of the efficiency of intangible resources (ECH and ECES) and the efficiency of physical resources (ECE), all within the conceptual and methodological approach proposed by Pulic.
The organizations studied create value in that their performance was mainly categorized as “good,” which is interpreted as appropriate use of intellectual capital and confirms the assumptions of the theory of resources and capabilities inasmuch as it validates that the management of intellectual resources is an input, a differential factor in the market, going beyond merely possessing the resource by moving the emphasis on its use to create value. Concerning the hypotheses, the VAIC significantly explains the changes in operating profit, as evidenced by the fact that the data in model 1 allow the null hypothesis to be accepted thanks to a 92.40% R-Squared, an F-Statistic indicator of 33.44 and the absence of autocorrelation problems (Durbin.Watson Stat of 2.298). Therefore, it is inferred that higher salary investments could lead to an increase in operating profit. On the validation of hypotheses No. 3 and 4, these did not yield significant results; therefore, no significant association is attributed to the variables that make it up (see summary Table 9).
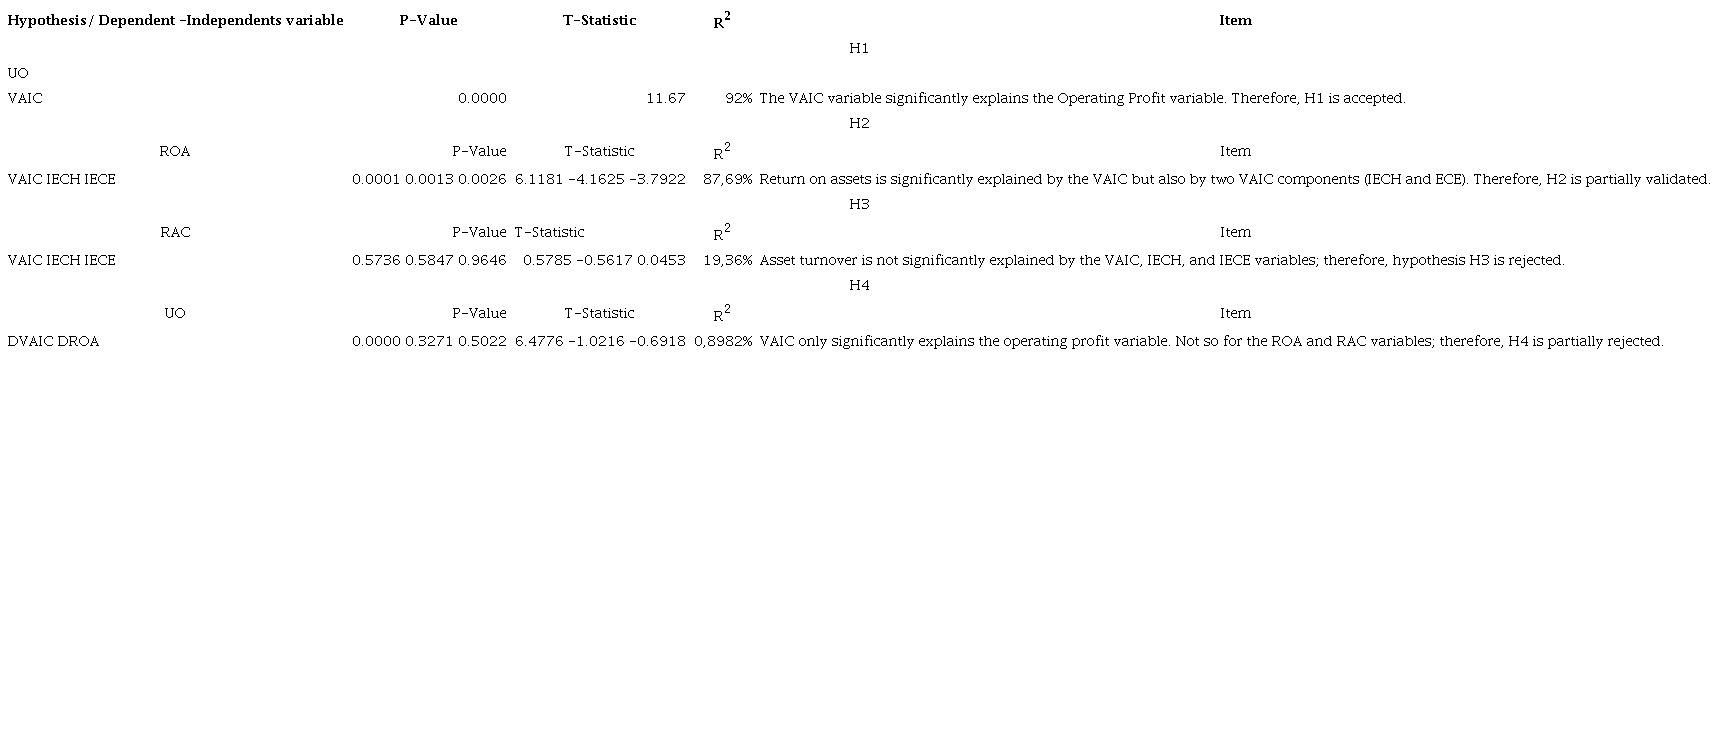
Source: Authors’ own elaboration based on research data.
The VAIC is a methodology for measuring the productive efficiency of intellectual capital in any monetary unit. In countries such as Colombia, access to the data required for applying it is restricted, given that they originate in accounting and are retrieved from the statement of comprehensive income. Despite this limitation, the VAIC is one of the few proposals that analyzes value creation based on intellectual capital using data retrieved from financial accounting. Finally, for future research topics, we propose applying these models in other industrial sectors to validate, through a broader study, which of them use their intellectual capital more efficiently. Another topic that could be an object of research is to include relational capital within the structure proposed by Pulic, thus coupling this methodology to the traditional view of intellectual capital.
5. References
Abdulsalam, F., Al-Qaheri, H., & Al-Khayyat, R. (2011). The Intellectual Capital Performance of Kuwaiti Banks: An Application of VAIC™ Model. Business, 3, 88-96. http://doi.org/10.4236/ib.2011.31014
Abdur, R., Farooq, S., Liaqat, F., Qadeer, A., & Younas, N. (2020). Analyzing the impact of intellectual capital on financial performance of food & personal care and textile sectors: a comparative analysis. Pakistan Economic and Social Review, 58(1), 35-60. https://www.semanticscholar.org/paper/ANALYZING-THE-IMPACT-OF-INTELLECTUAL-CAPITAL-ON-OF-Aiza-Iaqat/865e576344cea8fffcac240f5ccbdecac0ddacf4
Acuña, O.C., Contreras, O.C. (2021). The impacts of intellectual capital on financial performance and value-added of the production evidence from Chile. Journal of Economics, Finance and Administrative Science, 26(51), 127-142. https://doi.org/10.1108/JEFAS-08-2019-0178
Arpad, S. (2017). Quantifying value added intellectual capital at small and medium enterprises. Knowledge Horizons - Economics, 2, 88-97. https://bit.ly/33RVe2r
Bontis, N., Dženopoljac, V., & Janoševic, S. (2015). Intellectual capital in Serbia’s hotel industry. Journal of Intellectual Capital, 27(6), 1365-1384. http://doi.org/10.1108/IJCHM-12-2013-0541
Bontis, N., Kristandl, G. (2007). Constructing a definition for intangibles using the resource based view of the firm. Management Decision, 45 (9), 1510-1524. http://doi.org/10.1108/00251740710828744
Bontis, N., Zenopoljac, V., Elkanj, N., & Yaacoub, C. (2017). Impact of intellectual capital on corporate performance: evidence from the Arab region. Journal of Intellectual Capital, 18(4), 884-903. http://doi.org/10.1108/JIC-01-2017-0014
Cahill, D., Joshi, M., Kansal, M., Sidhu, J. (2013). Intellectual capital and financial performance: an evaluation of the Australian financial sector. Journal of Intellectual Capital, 14(2), 264-285. http://doi.org/10.1108/14691931311323887
Chowdhury, L. A. M., Rana, T., Akter, M., & Hoque, M. (2018). Impact of intellectual capital on financial performance: evidence from the Bangladeshi textile sector. Journal of Accounting & Organizational Change, 14(4), 429-454. https://doi.org/10.1108/JAOC-11-2017-0109
Chowdhury, L. A. M., Rana, T., & Azim, M. I. (2019). Intellectual capital efficiency and organisational performance: In the context of the pharmaceutical industry in Bangladesh. Journal of Intellectual Capital, 20(6), 784-806. https://doi.org/10.1108/JIC-10-2018-0171
Costa, V., Silva, M., & Loureiro, P. (2019). Intellectual Capital and Value Creation: Evidence from the Portuguese Tourism Industry. https://www.proquest.com/openview/c44a01449b0bbae5443480fbf25e4913/1?pq-origsite=gscholar&cbl=4451210
DiMaggio, P., Powell, W. (1983). The iron cage revisited: institutional isomorphism and collective rationality in organizational fields. American Sociological Review, 48(2), 147-60. https://n9.cl/bpxhs
Field, A. (2009). Discovering Statistics Using SPSS (Third ed.). Sage Publications. https://nyu-cdsc.github.io/learningr/assets/discoveringstatistics.pdf
García, C. M., Ortiz, R. A. (2017). Una nueva prueba para el problema de igualdad de varianzas [Tesis de pregrado]. Universidad Santo Tomas. https://repository.usta.edu.co/handle/11634/3837
Ghosh, S., Mondal, A. (2012). Intellectual capital and financial performance of Indian Banks. Journal of Intellectual Capital, 13(4), 515-530. http://doi.org/10.1108/14691931211276115
González, G.P. (2017). Una propuesta para medir la creación de valor por parte del capital intelectual en grandes empresas colombianas. En: Harvard Deusto Business Research (pp. 3-16). http://doi.org/10.3926/hdbr.135
Grant, R. (1991). The resource-based theory of competitive advance: Implications for strategy formulation. California Management Review, 33(3). https://doi.org/10.2307/4116666
Iazzolino, G., Laise, D. (2016). Value creation and sustainability in knowledge-based strategies, Journal of Intellectual Capital, 17(3), 457-470. http://doi.org/10.1108/JIC-09-2015-0082
Ibrahim, A. H. (2017). Some Issues In The Institutional Theory: A Critical Analysis. International Journal of Scientific & Technology Research, 6, 150-156. https://www.ijstr.org/final-print/sep2017/Some-Issues-In-The-Institutional-Theory-A-Critical-Analysis.pdf
Jin, G., Xu, J. (2022). Does Intellectual Capital Affect Financial Leverage of Chinese Agricultural Companies? Exploring the Role of Firm Profitability. Sustainability, 14, 2682. https://doi.org/10.3390/su14052682
Komnenic, B., Pokrajcic, D. (2012). Intellectual capital and corporate performance of MNCs in Serbia. Journal of Intellectual Capital, 13(1), 106-119. http://doi.org/10.1108/14691931211196231
Nawaz, T., Haniffa, R. (2017). Determinants of financial performance of Islamic banks: an intellectual capital perspective. Journal of Islamic Accounting and Business Research, 8(2), 130-142. http://doi.org/10.1108/JIABR-06-2016-0071
McPherson, P., Pike, S. (2001). Accounting, empirical measurement and intellectual capital. En: Journal of Intellectual Capital, 2, 246-260 http://doi.org/10.1108/EUM0000000005659
Pal, K. y Soriya, S. (2012). IC performance of Indian pharmaceutical and textile industry. Journal of Intellectual Capital, 13(1), 120-137, https://doi.org/10.1108/14691931211196240
Pike, S., Ross, G. (14, January, 2004). Mathematics and modern business management. Paper presented at the 25th McMaster World Congress Managing Intellectual Capital, Hamilton, McMaster University, Canada. https://www.researchgate.net/publication/274387186_Mathematics_and_Modern_Business_Management
Pulic, A. (21, January, 1998). Measuring the performance of intellectual potential in the knowledge economy, paper presented presented in 1998 at the 2nd McMaster World Congress on Measuring and Managing Intellectual Capital by the Austrian Team for Intellectual Potential (p. 21-23), McMaster University y DeGroote School of Business, Hamilton, Canada. https://n9.cl/oam49
Pulic, A., Kolakovic, M. (2005). Value Creation Efficiency in the New Economy. Global Business and Economic Review, 5(1), 111-128. https://doi.org/10.1504/GBER.2003.006201
Pulic, A. (2008). The principles of intellectual capital efficiency- A brief description. https://asset-pdf.scinapse.io/prod/2371185822/2371185822.pdf
Ramírez, G. Z., Gómez, S. A. (2013). Una aproximación teórica a los modelos de medición y valoración contable en una economía inmaterial. Cuadernos de Contabilidad, 14(35), 747-780. http://www.scielo.org.co/scielo.php?script=sci_arttext&pid=S0123-14722013000200015
Sardo, F., Serrasqueiro, Z. (2018). Intellectual capital, growth opportunities, and financial performance in European firms Dynamic panel data analysis. Journal of Intellectual Capital, 19(4), 747-767. https://doi.org/10.1108/JIC-07-2017-0099
Ting, I. W., Lean, H. H. (2009). Intellectual capital performance of financial institutions in Malaysia. En: Journal of Intellectual Capital, 10(4), 588-599. https:// doi.org/10.1108/1469193091099666
Tiwari, R., Vidyarthi, R. (2018). Intellectual capital and corporate performance: a case of Indian Banks. Journal of Accounting in Emerging Economies, 8(1), 84-105. https://doi.org/10.1108/JAEE-07-2016-0067
Xu, J., Liu, F. (2020). The Impact of Intellectual Capital on Firm Performance: A Modified and Extended VAIC Model. Journal of Competitiveness, 12(1), 161-176. https://doi.org/10.7441/joc.2010.01.10
Xu, J., Zhang, Y. (2021). Does Intellectual Capital Measurement Matter in Financial Performance? An Investigation of Chinese Agricultural Listed Companies. Agronomy, 11, 1-18. https://doi.org/10.3390/agronomy11091872
Notes
Conflict of interest declaration