Article
Prospects for state credit risk in Brazil: An analysis of the probability of default
Perspectivas para o risco de crédito estadual no Brasil: Uma análise da probabilidade de default
 Leonardo Vieira Bortolini leonardo.bortolini@outlook.com.br
Bruno Pérez Ferreira brunoperez.bh@gmail.com
Frank Magalhães de Pinho frank_magalhaes@yahoo.com.br
Leonardo Vieira Bortolini leonardo.bortolini@outlook.com.br
Bruno Pérez Ferreira brunoperez.bh@gmail.com
Frank Magalhães de Pinho frank_magalhaes@yahoo.com.br
Prospects for state credit risk in Brazil: An analysis of the probability of default
Revista de Contabilidade e Organizações, vol. 16, e188194, 2022
University of São Paulo
Received: 06 July 2021
Accepted: 30 May 2022
Published: 07 October 2022
Abstract: As public indebtedness reached record levels in 2021, and economic crises increase public entities’ need for financial loans, credit risk stands out as a useful metric for potential creditors, and for the entities themselves, regarding the management of their liability portfolio. This paper assesses, for the short term, the prospects for state credit risk, focusing on the probability of default. The methods used combine projections resulting from the application of panel data modeling with Monte Carlo simulations, taking as reference concepts related to the sustainability of public entities for determining the risk of default. Results indicate the persistence of a negative condition for most states, and the possibility of grouping entities at different levels of credit risk. In addition, we achieved a practical, alternative, and complementary tool for the analysis of subnational credit risk in the short term.
Keywords: Credit risk, Public debt, Probabily of default, Sustainability.
Resumo: Na medida em que o endividamento público alcança patamares recordes em 2021 e que crises econômicas ampliam a necessidade dos entes públicos pela tomada de crédito, o risco de crédito ganha destaque como métrica útil a potenciais credores e também aos próprios entes em termos de gerenciamento de sua carteira de passivos. Este trabalho avalia, visando ao curto prazo, as perspectivas para o risco de crédito estadual, com enfoque na probabilidade de default. Os métodos utilizados combinam projeções resultantes da aplicação de modelagem para dados em painel com simulações de Monte Carlo, tomando-se como referência conceitos atinentes à sustentabilidade de entes públicos para apuração do risco de inadimplência. Os resultados indicam a manutenção de uma condição negativa para grande parte dos estados e, também, a possibilidade de agrupamento dos entes em diferentes patamares de risco de crédito. Adicionalmente, obteve-se uma ferramenta prática, alternativa e complementar para análise do risco de crédito subnacional no curto prazo.
Palavras-chave: Risco de crédito, Dívida pública, Probabilidade de default, Sustentabilidade.
1 INTRODUCTION
Taking on credit to finance government actions is a recurrent practice in all administrative spheres. In moments of expansion of state action, loans are often the way through which investments become possible. In situations of fiscal imbalance, caused, for example, by a slowdown in economic activity, public debt is sometimes the alternative to ensure the continuity of service provision by public administration.
The "willingness" of creditors to lend their resources is conditioned by their perception on borrowers' ability to meet the agreed obligations. As a result, there is a constant need to assess the risks inherent to credit market transactions. Depending on the situation of the public entity that borrows, the costs of indebtedness, if badly managed, can become a chronic financial complicating factor. On the other hand, if the credit analysis is poor, the creditor may take unwanted risks. Thus, as important as the assessment of default risks is for the lender, so must be the assessment of the debt costs and risks for the borrower.
In the academy, the literature on sovereign risk analysis is abundant, focusing mainly on its determining factors, its evolution, and on the comparison between Brazil’s country risk and that of other countries.
However, the topic of credit risk is not so frequent in studies focused on subnational entities. Although authors have discussed more emphatically the issue of state debt sustainability since the end of the 1990s, there are still few studies that assess exclusively the conditions of Brazilian states, regarding the evolution of their default risk.
In light of this, the paper investigates the prospects for credit risk of Brazilian states. To do that, our goal was to model the behavior of state debt based on macroeconomic factors that are relevant for determining the credit risk of these entities, and, from then on, to make simulations on the states’ probability of default.
The results provide a practical instrument for analysis of state credit risk, inspired by methods used for country analysis. It is a useful instrument for both states and their creditors. Given the growth of state public debt in Brazil, we inserted new elements that are helpful for understanding and searching alternatives to the fiscal crisis that most of these entities have been facing.
2 THEORETICAL BACKGROUND
Discussions about public entities’ risk of default are closely associated with the evaluation of debt sustainability, which represents the entity’s capacity to keep a balance between its cash availability and its financial obligations, in the short and long term.
An important landmark among the studies on public debt sustainability is the paper by Hamilton and Flavin (1986), where they use the concept of intertemporal budget constraint. In their article, "On the Limitations of Government Borrowing: A Framework for Empirical Testing", the authors observe that sovereign governments are subject to limitations for borrowing, and the consequent increase of their liability. They assess empirically that these governments must show creditors the ability to balance their budget, in order to keep debt sustainable.
Many studies followed, also seeking to assess sustainability through compliance with the intertemporal budget constraint, through different methods. For example, through stationarity tests for public debt, where Wilcox (1989) and Buiter and Patel (1992) stand out, or by co-integration tests with series of public revenue and expenditure, as in Trehan and Walsh (1988), Hakkio and Rush (1991), Corsetti and Roubini (1991), Ahmed and Rogers (1995), and Smith and Zin (1991).
However, a reference study is Bohn’s (1998) "The Behavior of U.S. Public Debt and Deficits". The author proposes an empirical approach, different from others so far, through a method that enables finding evidence of Governments’ corrective actions regarding primary surpluses, in the face of debt accumulation. The restriction would be satisfied in cases where the positive primary result would follow the growth of liabilities, focusing on the concept of fiscal reaction.
Barbosa (2018) presents a compilation of the main studies published in the 1980s, 1990s, and after 2000, to assess debt sustainability in several countries, also highlighting the different methodological trends over the years. The most recent papers assume the balance situation recurrently, using the comparison between the behavior of the primary result and the debt stock, as proposed by Bohn (1998, 2007), and Potrafke and Reischmann (2015). Ghosh et al. (2013), in turn, improve Bohn's model by estimating a fiscal reaction function for developed countries, aiming to determine a limit level of Debt/GDP ratio for keeping sustainability, inserting in their analysis the concepts of fiscal fatigue and fiscal space.
Another group of researchers sought to evaluate the sustainability of the public debt in order to include elements of uncertainty in the analysis, using the risk management perspective. This is the case of Barnhill and Kopits (2003), who use the concept of Value-at-Risk (VaR).
Specifically about the sustainability of the Brazilian debt, we mention the studies by Luporini (2001, 2015), Mello (2008), and Chicoli and Bender (2015), which assess sustainability based on Bohn’s (1998) methodology to observe the Brazilian government response to debt increase (fiscal reaction).
In an analysis focused on incorporating elements of uncertainty, Garcia and Rigobon (2004) studied the behavior of public debt as a share of GDP, by estimating a model of autoregressive vectors. They used the empirical relationship obtained to make calculations similar to the Value-at-Risk (VaR) indicator, commonly used in financial analysis. Through Monte Carlo simulations, the authors calculated the probabilities of the Brazilian Debt/GDP reaching different levels over a ten-year horizon, and achieved results consistent with the EMBI+Br (Emerging Markets Bond Index) sovereign risk indicator.
From a similar logic, and using the VaR concept, Lima, Gaglianone and Sampaio (2008) proposed an improvement of Garcia and Rigobon’s study (2004). While in the first study the authors defined the thresholds used to calculate probabilities arbitrarily, in the latter, the authors used the quantile autoregression method, to propose a maximum level (ceiling) for the projected debt trajectory to be sustainable. However, they considered the stationarity of the Debt/GDP ratio as sufficient to ensure sustainability, fitting in with Bohn's criticism.
Baghdassarian (2006) also innovated by using an approach that considers fiscal sustainability under uncertainty. The author took traditional approaches as a starting point, but added to his model the contributions of studies with financial stochastic modeling, to propose projections that focus on the calculation of the Brazilian debt’s probability of default. He also used macroeconomic variables to explain the behavior of the Debt/GDP and the Monte Carlo method to make projections for the future trajectory.
Regarding the subnational debt, the situation of mismatch in the public accounts of these entities, and the consequent increase in the level of indebtedness, have fostered several studies. As highlighted by Barbosa (2018, p. 40), most of them focused on the assessment of the determinants of fiscal deficit, on federative relations, and on the impacts of the Fiscal Responsibility Law, and "there are few studies focusing on debt sustainability and its assessment through intertemporal budget constraint".
This research topic has become even more important in face of the various renegotiations between the Brazilian Federal Government and the states. There are other studies on subnational entities worth mentioning, such as those by Pérez and Prieto (2015), Caldeira et al. (2016), Mora and Santos (2016), Cardoso et al. (2018), Liu and Waibel (2010), Tabosa et al. (2016), and Rozenov (2017).
It is important to mention the literature on sustainability, since it is from this concept that most researchers assess the probability of default, and consequently, the credit risk associated to public entities. This paper adopted a similar trajectory.
3 METHODOLOGY
To model the behavior of states' indebtedness, we carried out a panel data analysis. In this case, tests were done with secondary data, by evaluating the quality of the adjustment, in order to have an empirical equation capable of describing the states’ debt behavior and primary result. Next, in order to draw perspectives for the states' credit risk, we applied a predictive method for the short term, from the equation obtained in the previous analysis.
The variables involved in the analysis, for each state, are: Public Sector Net Debt as a share of GDP; state GDP; Primary Result; Interest Rate; Exchange Rate; and Inflation Rate. We worked with nominal data from Brazil Central Bank time series repository, on a quarterly basis, according to the availability, covering from the 1st quarter of 2008 to the 4th quarter of 2020, which resulted in 52 observations per state. Regarding states’ GDP, and given the annual data availability, we interpolated the values for the 1st, 2nd, and 3rd quarters, so that the values for the 4th quarter corresponded to the official IBGE (Brazilian Institute of Geography and Statistics) publication, and also respected the amount of national GDP (sum of the states) calculated by the Central Bank.
To carry out the estimation exercises of state credit risk, we did Monte Carlo simulations, using the empirical distribution of variables and Cholesky transformation, to draw potential scenarios for state debt in 8 quarters. We present a detailed description of these steps as additional material, at the end of the article.
We used the set of projections for two distinct types of analysis related to credit risk: (i) evaluation of the probability that the Debt/GDP ratio reaches specific levels; and (ii) evaluation of the probability of default and of other scenarios.
The first type of analysis proposed was based on Garcia and Rigobon (2004), where they achieved "risk probabilities" through a measure comparable to Value-at-Risk. The analysis consisted in assessing the percentage of trajectories where, at least in one of the quarters, the Debt/GDP ratio reaches an established threshold (percentile).
The second type of analysis consisted in checking the share of trajectories that could point to insolvency or unsustainability, in the analyzed period. This type of analysis is similar to the one used by Baghdassarian (2006), although we used different metrics and parameters.
To define the criterion for identifying trajectories that indicate default, we adopted the concept used by authors who have proposed ways of determining sustainability. Let us consider the equation that expresses the dynamics of Public Debt, with this and the other variables expressed as a share of GDP:
where bt represents the debt/GDP stock; rt represents interest rate/GDP; gt the primary expenses/GDP; τt the government primary revenues/GDP; and γt the GDP variation rate.
As Costa (2009, p. 90) mentions, "the present value of a stable Debt/GDP ratio decreases over time. Therefore, its stability is a sufficient condition to ensure the sustainability of the public debt". It is reasonable to assume that the interest rate is higher than the growth rate of the economy, for the case of the national and subnational debts in Brazil, in the period analyzed; therefore, achieving the primary surplus necessary to keep the Debt/GDP ratio constant is a good measure for assessing sustainability.
Under this view, it is possible to achieve the necessary primary result in a simple way, through equation (1), so that the difference between the debt stock/GDP in period t and t+1 is null,
The calculation of the default probability was done by comparing the trajectories of the Projected Primary Result (RPP) and the Required Primary Result (RPR), to keep the Debt/GDP ratio stable. RPP was estimated from the empirical distribution of state Primary Results, and used in the projections of debt trajectories. On the other hand, RPRs, at each point in time, are calculated through equation (2), using secondary data of GDP and interest rate, in addition to the projected values of Debt/GDP in each period.
Therefore, for each t period of each i projected trajectory, we have dit, the difference between RPP and RPR, which indicates an entity’s capacity to have the necessary resources to prevent the uncontrolled evolution of the debt.
Hence, the i trajectory that indicates the occurrence of default is the one that meets the following conditions:
Where represents the average dt, represents the average Debt/GDPt, and represents the average t for the 8 periods of each trajectory. Variable t, in the equation, is an arbitrary variable, with values between 1 and 8, for determining the sequence of periods within the trajectories.
The first condition (a) requires that, for n=8 periods, the sum of the differences between the projected and required primary in each period of the trajectory be negative, which indicates that the state would not make enough effort to keep the Debt/GDP ratio constant. The second condition (b) indicates that the difference between the projected and required primary result follows a downward trend in the projection period. In its turn, the third condition (c) establishes that the debt stock/GDP ratio must follow an upward trend. The formulas used in (b) and (c) have a structure similar to the beta coefficient in a regression analysis, and measure the sign (the slope of a straight line) of the relationship between dt and Debt/GDPt over time, respectively. The purpose of using these formulas is not to estimate a valid coefficient for making inferences, but only to achieve a valid relationship of this sign in the period under consideration. From there, the probability of default will result from the calculation of the share of trajectories that meet these conditions, over the total estimated trajectories.
The analysis of the trajectories also serves to indicate the probabilities that the entity fits into eight distinct scenarios, as illustrated in Figure 1. Besides the default scenario, where a < 0, b < 0, and c > 0, the second possible scenario has a < 0, but b > 0 and c > 0. In that case, although the entity will not be able to generate surplus necessary to contain the debt expansion, there are signs that the effort will increase, leading to a reduction in the difference between the projected and the required primary result. Another possible scenario where the debt shows a growth trend (c>0) is the one where a > 0 and b < 0, which indicates that although the entity can meet the need for primary surplus, there is a predicted effort decline. In practice, the effort reduction may be the result of some factors, such as the change in fiscal policy, the macroeconomic prospect, the expansion of state activities, or even the effect of the so-called fiscal fatigue, as discussed by Ghosh et al. (2013).
In the fourth scenario, with a > 0 and b > 0, there is a situation where the debt increases even with a positive and growing primary sufficiency. In theory, this is a rare scenario among the other potential ones. The other four possible scenarios are similar to the first four in terms of primary result generation, but are associated with a declining trend of the Debt/GDP stock, thus showing more favorable situations than the former.
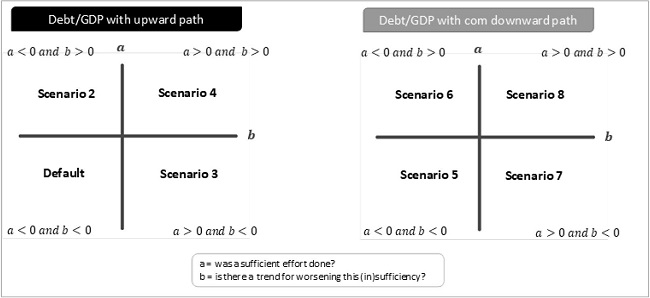
Figure 1
Scenarios created to assess the prospects for state credit risk
Source: elaborated by the authors.
Although the methodology that we propose uses concepts related to sustainability, we did not seek to refer to the condition of definitive or long term incapacity or insolvency, but to indicate a short-term scenario that points to an unsatisfactory condition and potential default occurrence. Therefore, it consists of an additional analysis, intended to identify potential behaviors of the entities’ fiscal dynamics, in the established period, as well as their probability of occurrence. Hence, the risk of default is associated with the signal given by the results most likely to observe in the states, regarding their ability to keep a balanced management of the debt and of the fiscal effort.
4 RESULTS FOR THE STATE DEBT DYNAMICS
We calculated the dynamics of state debts from econometric exercises whose dependent variable was the debt/GDP ratio of Brazilian states, between the first quarter of 2008 and the last quarter of 2020, as mentioned in the methodology. The analyses carried out to identify the best model for panel data, to describe the relationship between the variables, resulted in the choice of the pooled model. We present intermediate results that justify this choice in the additional material, at the end of the article.
We added two dummy variables to the final model, in order to purge the effects of discrepant information. Table 1 presents the estimated coefficients and their validity. Thus, we considered that the model is appropriate for generating forecasts for the Debt/GDP ratio, despite its potential limitations for identifying impacts or cause-effect relations of the explanatory variables on the Debt/GDP ratio.
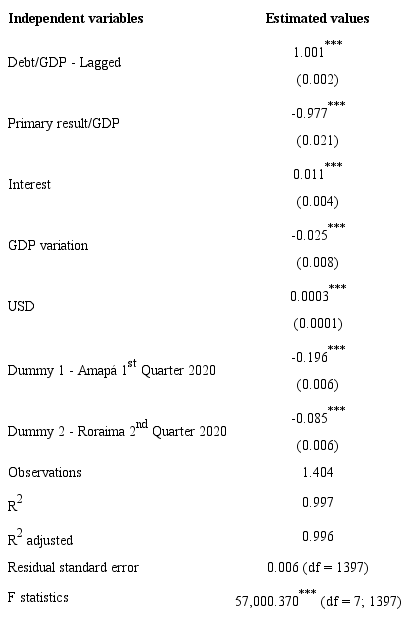
All the variables included showed statistical significance in describing the behavior of the state debt, except for the inflation variable, which we removed from the final model. As expected, since this is a stock variable, the debt in the previous period relates directly to that of the current period. In addition, increases in the assigned average carrying rate (interest) and in the dollar put upward pressure on the debt. On the other hand, the greater the fiscal effort (primary result) undertaken, and the better the performance of the economy (measured by GDP), the lower the indebtedness level tends to be. The subnational indebtedness in Brazil has distinct characteristics from that of the Central Government, arising from the process of doing credit operations. The need for the National Treasury Secretariat’s approval for indebtedness, and the lack of a secondary market for state public bonds are two examples. Despite these and other differences, the empirical results showed that the state debt dynamics was coherent, regarding the variables used in the traditional theoretical models proposed to describe the evolution of sovereign public debt, as mentioned by Baghdassarian (2006).
5 PROSPECTS FOR STATE CREDIT RISK
A first relevant result of the projections can be achieved through the percentiles of the minimum and maximum values assumed by the Debt/GDP over the 8 projected quarters (from the 1st quarter of 2021 to the 4th quarter of 2022). These results allowed us to measure the probability of the indicator overcoming a defined threshold, or, in other words, enabled analyzing the prospect of reaching Debt/GDP levels for each state in the period. We described the estimate of the simulated values in the methodology section.
Figure 2 shows the maximum values of Debt/GDP assumed by each state, considering the 95% percentile, and the minimum values considering the 5% percentile, thus configuring a confidence interval. Taking the state of Santa Catarina as an example (the median), Figure 2 shows that 95% of the trajectories presented a maximum point of up to 6.5% for Debt/GDP, while 95% of the trajectories presented values of at least 3.9% for this indicator.
In general, Rio de Janeiro, Minas Gerais, and Rio Grande do Sul are the states with the highest level of indebtedness, not only in absolute terms, but also as a proportion of GDP. As expected, the states’ ranking based on this indicator tends to vary little in the short period analyzed, since possible shocks in the explanatory variables of the model would not allow a significant reduction or increase, to the point of changing their relative positions significantly. However, it is possible to notice differences between the predicted variability for some states.
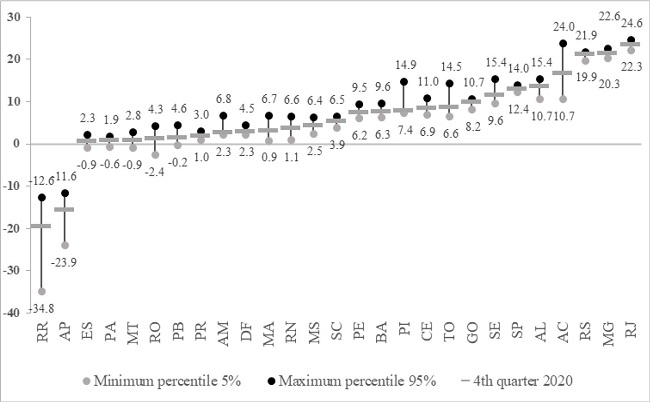
Figure 2
Confidence interval of state debt/GDP in the 8 quarters projected (%)
Source: elaborated by the authors.
The states of Acre, Amapá, and Roraima stand out for the large range between minimum and maximum values in the rojections. This is due, in part, to the smaller size of their economies, which means that revenue shocks (which affect the primary result), for example, have a large impact on the net debt level.
The states of Piauí and Amazonas stood out for presenting minimum debt values, at least at the same level observed at the end of 2020, which is an indication of increase in the level of indebtedness for the next 2 years. Distrito Federal, Goiás, Santa Catarina, and São Paulo achieved results that indicate a lower variation in the level of indebtedness.
The projections also enabled analyzing simultaneously the prospects for the increase in debt and the generation of primary result. The inverse proportionality relation between these two variables is another relevant result of the research. This indicates that entities with higher shares of growing debt trajectories are the same that present a lower probability of generating a primary surplus. In other words, this indicates that debt growth is linked to a deteriorating fiscal situation, a characteristic that points to the unsustainability of state debt in Brazil, which is consistent with the results found by Tabosa et al. (2016). Moreover, extreme cases of high growth probability, associated with low likelihood of primary surplus, indicate the occurrence of the so-called ‘fiscal fatigue effect’ for some Brazilian states. Ghosh et al. (2013) proved this effect for advanced economy countries; Chicoli and Bender (2015), for emerging economies (including Brazil); Pereira (2020), for Brazil; and Cruz (2020) found signs of it for Brazilian states. Figure 3 shows this inverse relationship between the two variables.
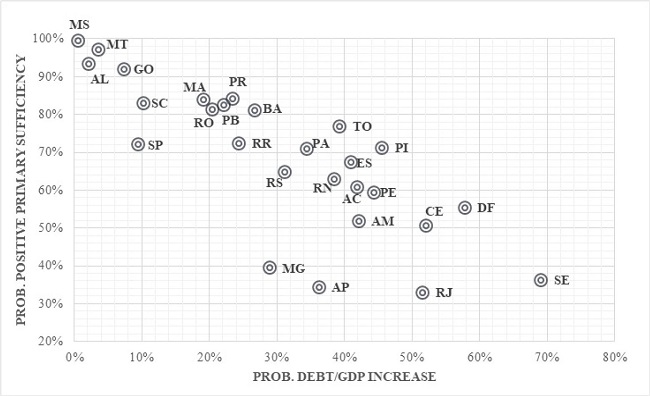
Figure 3
Probability of increasing debt/GDP and generating sufficient primary result in 8 quarters
Source: elaborated by the authors.
The last, and perhaps the main, analysis made from the projections to measure credit risk concerns the probability of default associated with each entity in the analyzed period. As highlighted, the trajectories that indicate default for this study are those that simultaneously meet the conditions of having a negative primary result sufficiency (a<0); decreasing primary result sufficiency (b<0); and debt/GDP with an increasing trajectory (c>0). The other combinations generate seven other possible scenarios with additional likelihood. The probabilities associated with each of the scenarios are shown in Figure 4, from the worst (Scenario 1 - Default) to the best (Scenario 8, which indicates sustained balance).
As expected, there is a lower probability for Scenarios 4 and 5, which are those with a directly proportional relationship between primary sufficiency and debt/GDP ratio.
In general, the analysis of scenarios found values consistent with the others. The results are negative overall, and the average probability of default for the states is 12.4%, which is significant. However, it is possible to group the entities according to the severity of their condition. A small group of states presents a more favorable situation, meaning a lower risk to creditors. This is the case of Mato Grosso, Mato Grosso do Sul, Alagoas, São Paulo, and Goiás, with an index below 5%. Another set of states stands out for their unfavorable situation, such as Sergipe, Rio de Janeiro, Ceará, Distrito Federal, and Amazonas, with a chance above 20%.
Among the negative highlights, we point out the cases of Minas Gerais and Rio Grande do Sul. Although these entities have presented a lower probability of default, compared to others, they showed significant probabilities for the other worst scenarios. They represent particular cases for the analysis of credit risk, in view of the significant relative size of their liabilities in relation to GDP, and their well-known deteriorating fiscal situation. On the one hand, their great capacity for revenue generation is a positive factor for achieving primary results. However, there are other variables that represent the fiscal situation that can affect their ability to meet obligations, but have no direct effect on net debt or on the generation of primary results; therefore, they were not fully captured in the model. This is the case of the proportion between discretionary and mandatory expenses in total expenses; the volume of pre-existing short-term liabilities (accounts payable or others, extra-budgetary); and the social security deficit, for example. These and other factors weigh against these two states, representing an increased risk associated with them.
Hence, although the results indicate homogeneity in the factors responsible for the variation of indebtedness among states, the projections made from the empirical distribution of interest rates, GDP, primary result of each state, and the dollar, allowed capturing their specificities, producing results that demonstrate coherently the heterogeneity (in terms of size and fiscal condition) among them.
The high average credit risk identified pressures the Union to adopt an active attitude in searching for alternatives to correct this situation, by using its prerogatives to establish rules for the Federation. This statement clearly shows the renegotiations in process to readjust state finances, especially to bail out the worst-off states.
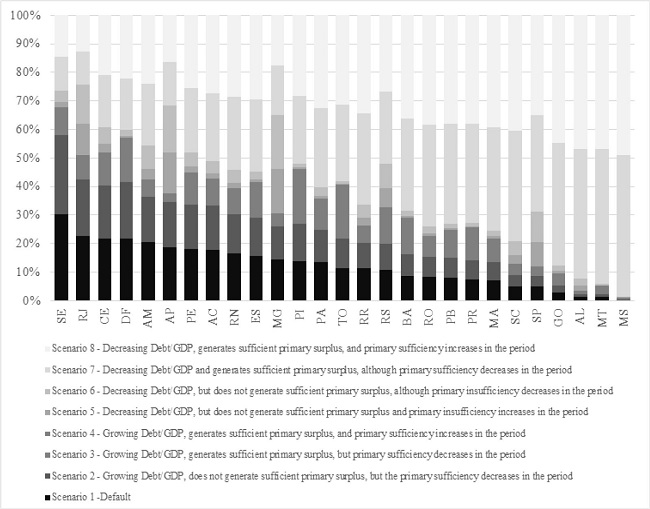
Figure 4
Probabilities for projected scenarios regarding the credit risk of Brazilian states
Source: elaborated by the authors.
This study strengthens the need to search for alternatives to restructure the states and create conditions to reduce their credit risk. These options include measures directly related to improving their fiscal situation, as well as others focused on enhancing debt management. The implementation of these alternatives is associated, among other factors, with creating new mechanisms of fiscal responsibility and improving the capacity to control their liability portfolio.
The most important renegotiation proposals currently in effect for the states, arising from Supplementary Laws n. 159/2017 and n. 178/2021, offer these states special conditions for fiscal rearrangement, allowing the expansion of their debt stock, either by granting grace periods or by authorizing new credit operations with guarantees from the Union itself.
The expansion of debt stock could be compensated, in terms of credit risk, precisely by the Union’s concession of new guarantees, including honoring states’ debt installments with third parties, for the duration of the plans. In addition, converting debts with third parties into debts with the Federal Government also has the advantage of better indexers, which generally make the debt load cheaper. However, at the end of the grace period, the quality and rigor of the fiscal adjustment made by the state during these plans would be determinant for the containment or expansion of credit risk. Therefore, the cost-benefit analysis of these agreements, for the Union and for the states themselves, should include in their scope, in addition to checking fiscal indicators and the relations inherent to federalism, the implications for state credit risk. Torrezan and Paiva (2021) did that for Rio de Janeiro.
In fact, we cannot think of debt management without the central role of the credit risk variable in the decisions. The rules established so far include the element ‘credit risk’, by using the Payment Capacity (CAPAG), an indicator regulated by MF Ordinance 501/2017 and MF Ordinance 882/2018, as a criterion for differentiating entities regarding the level of criticality of their fiscal situation. However, it is necessary to spread new instruments that assign a more important role to credit risk in the assessment and implementation of recovery processes.
Therefore, this paper innovates by proposing a methodology for measuring credit risk that has practical and dynamic characteristics, something still incipient in the literature. Updates of the projections made here are possible and necessary, if one of the states takes a new direction. Hence, the results are sensitive to the incorporation of new data, as they become available.
6 CONCLUSIONS
This study identified a relatively high number of trajectories that indicate default for a large set of Brazilian states, with no downward trend in this condition over the next two years.
The estimated model, together with the methodology used in the projections to determine short-term credit risk, were an additional tool for both credit risk analysis and management of state public indebtedness in Brazil. This analysis may be a new alternative for assessing state credit risk, beyond the Payment Capacity - CAPAG, calculated by the National Treasury Secretariat. Such approach also differs from the values determined by rating agencies, since these indexes provide a more stable notion of credit risk. On the other hand, the metrics proposed here sought to provide a dynamic and constantly updatable approach, as a proposal for practical use by both public managers and credit evaluators.
We must consider some limitations of this study, starting with the time horizon projected for the states' indebtedness. Due to our interest and the way we could calculate the indicators, the analysis was limited to short-term forecasts for state credit risk, during 8 quarters. Calculations strictly concerning the long-term sustainability of the state debt would require a methodology and scope different from those used here.
Although this study has tried to capture the perspectives for credit risk separately for each of the Brazilian states, we did not attempt to detail the specifics of each state, which would demand an in-depth study of each case, which would go beyond its scope.
Another limitation is that we used a non-parametric method for the projections of the explanatory variables of the model for state debt, based on the empirical distribution of such variables, an option justified by our interest to carry out an analysis that would cover all the states. We suggest that a feasible study should focus on one or a few states, and use parametric methods, in order to investigate more thoroughly the behavior and modeling of these variables for the cases of interest, considering their specificities.
Finally, we make some suggestions for future studies that may advance the discussion on state credit risk. The first is to compare the results achieved by the methodology we used, of the states’ primary result projections for the targets they set, within the scope of the Budget Guidelines Law. A new study could investigate the likelihood of achieving or not such goals. Another suggestion is to compare the results we obtained with the classifications used for the Payment Capacity.
One last suggestion concerns updating the projections made after the debt renegotiations proposed to the states have matured, in order to measure possible differences regarding the credit risk, of entities that did or did not adhere to these programs.
REFERENCES
Ahmed, S., & Rogers, J. H. (1995). Government budget deficits and trade deficits: are present value constraints satisfied in long-term data? Journal of Monetary Economics, 36(2), 351-374. https://doi.org/10.1016/0304-3932(95)01215-X
Baghdassarian, W. (2006). Avaliação da sustentabilidade fiscal sob incerteza. Cadernos de Finanças Públicas, 7, 31-74. Retrieved from: http://repositorio.enap.gov.br/handle/1/3856
Barbosa, L. M. (2018). Sustentabilidade fiscal dos estados brasileiros, 458. Retrieved from: https://downloads.fipe.org.br/publicacoes/bif/bif458.pdf
Barnhill, T. M., & Kopits, G. (2003). Assessing fiscal sustainability under uncertainity. In: IMF Working Papers, 03(79). International Monetary Fund. https://doi.org/10.5089/9781451850222.001
Bohn, H. (1998). The behavior of U.S. public debt and deficits. The Quarterly Journal of Economics, 113(3), 949-963. Retrieved from: https://www.jstor.org/stable/2586878
Bohn, H. (2007). Are stationarity and cointegration restrictions really necessary for the intertemporal budget constraint? Journal of Monetary Economics, 54(7), 1837-1847. https://doi.org/10.1016/j.jmoneco.2006.12.012
Buiter, W. H., & Patel, U. R. (1992). Debt, deficits, and inflation: an application to the public finances of India. Journal of Public Economics, 47(2), 171-205. https://doi.org/10.1016/0047-2727(92)90047-J
Caldeira, A. A., Wilbert, M. D., Moreira, T. B. S., & Serrano, A. L. M. (2016). Sustentabilidade da dívida estadual brasileira: uma análise da relação dívida líquida e resultado primário. Revista de Administração Pública, 50(2), 285-306. https://doi.org/10.1590/0034-7612151140
Cardoso, V. R. dos S., Pansani, D. A., Serrano, A. L. M., & Wilbert, M. D. (2018). Sustentabilidade da dívida pública: uma análise de curto e longo prazo aplicados aos municípios agregados. Revista Universo Contábil, 14(3), 7-27. https://doi.org/10.4270/ruc.2018317
Chicoli, R. da S., & Bender, S. (2015). Sustentabilidade a dívida pública brasileira: uma análise sob diversos conceitos de superávit primário e endividamento. In: Working Paper Series, 2015(37).
Corsetti, G., & Roubini, N. (1991). Fiscal deficits, public debt, and government solvency: evidence from OECD countries. Journal of The Japanese and International Economies, 5(4), 354-380. https://doi.org/10.1016/0889-1583(91)90004-A
Costa, C. E. E. L. da. (2009). Sustentabilidade da dívida pública. In: Dívida Pública: a experiência brasileira, pp. 81-99. Ministério da Fazenda. Retrieved from: https://sisweb.tesouro.gov.br/apex/f?p=2501:9::::9:P9_ID_PUBLICACAO_ANEXO:4718
Cruz, I. D. S. (2020). Fadiga fiscal dos estados brasileiros e a sustentabilidade das dívidas estaduais. Fundação Getúlio Vargas. Retrieved from: https://bibliotecadigital.fgv.br/dspace/browse?type=author&value=Cruz%2C+Itanielson+Dantas+Silveira
Garcia, M., & Rigobon, R. (2004). A risk management approach to emerging market’s sovereign debt sustainability with an application to Brazilian data. In: NBER Working Paper Series, 10336(March). https://doi.org/10.7551/mitpress/3759.003.0014
Ghosh, A. R., Kim, J. I., Mendoza, E. G., Ostry, J. D., & Qureshi, M. S. (2013). Fiscal fatigue, fiscal space and debt sustainability in advanced economies. Economic Journal, 123(566), 4-30. https://doi.org/10.1111/ecoj.12010
Hakkio, C. S., & Rush, M. (1991). Is the budget deficit “too large?”. Economic Inquiry, 29(3), 429-445. https://doi.org/10.1111/j.1465-7295.1991.tb00837.x
Hamilton, B. J. D., & Flavin, M. A. (1986). American economic association on the limitations of government borrowing: a framework for empirical testing. The American Economic Review, 76(4), 808-819. Retrieved from: https://www.jstor.org/stable/1806077
Lima, L. R., Gaglianone, W. P., & Sampaio, R. M. B. (2008). Debt ceiling and fiscal sustainability in Brazil: a quantile autoregression approach. Journal of Development Economics, 86(2), 313-335. https://doi.org/10.1016/j.jdeveco.2007.11.002
Liu, L., & Waibel, M. (2010). Managing subnational credit and default risks. In: Policy Research Working Paper, 5362(5362). https://doi.org/10.1596/9780821384831_ch11
Luporini, V. (2001). The behavior of the Brazilian federal domestic debt. In: Texto para discussão, 161. https://econpapers.repec.org/paper/cdptexdis/td161.htm
Luporini, V. (2015). Sustainability of Brazilian fiscal policy, once again: corrective policy response over time. Estudos Econômicos, 45(2), 437-458. https://doi.org/10.1590/0101-4161201545247vil
Mello, L. de. (2008). Estimating a fiscal reaction function: the case of debt sustainability in Brazil. Applied Economics, 40(3), 271-284. https://doi.org/10.1080/00036840500461873
Mora, M., & Santos, F. E. de L. e A. (2016). Limites ao endividamento e sustentabilidade fiscal: o caso dos governos estaduais. In: Texto para discussão, 2232. https://www.ipea.gov.br/portal/images/stories/PDFs/TDs/04102016td_2232.pdf
Pereira, R. M. (2020). Fiscal fatigue and public debt limit in Brazil: are we on sustainable path? In: Texto para discussão, 250. https://doi.org/http://dx.doi.org/10.38116/dp250
Pérez, J. J., & Prieto, R. (2015). Risk factors and the maturity of subnational debt: an empirical investigation for the case of Spain. Public Finance Review, 43(6), 786-815. https://doi.org/10.1177/1091142114552840
Potrafke, N., & Reischmann, M. (2015). Fiscal transfers and fiscal sustainability. Journal of Money, Credit and Banking, 47(5), 975-1005. https://doi.org/10.1111/jmcb.12231
Rozenov, R. (2017). Public debt sustainability under uncertainty: an invariant set approach. IMF Working Paper, 17(57). https://www.imf.org/en/Publications/WP/Issues/2017/03/13/Public-Debt-Sustainability-Under-Uncertainty-An-Invariant-Set-Approach-44744
Smith, G. W., & Zin, S. E. (1991). Persistent deficits and the market value of government debt. Journal of Applied Econometrics, 6(1), 31-44. https://doi.org/10.1002/jae.3950060104
Tabosa, F. J. S., Ferreira, R. T., Simonassi, A. G., Khan, A. S., & Tomaz, D. (2016). Reação fiscal ao aumento da dívida pública: uma análise para os estados brasileiros. Economia Aplicada, 20(1), 57-71. https://doi.org/10.11606/1413-8050/ea134918
Torrezan, R. G. A., & Paiva, C. C. de. (2021). A crise fiscal dos estados e o regime de recuperação fiscal: o déjà vu federativo. Revista de Administração Pública, 55(3), 716-735. https://doi.org/htt.doi.org/10.1590/0034-761220200042
Trehan, B., & Walsh, C. E. (1988). Common trends, the government’s budget constraint, and revenue smoothing. Journal of Economic Dynamics and Control, 12(2-3), 425-444. https://doi.org/10.1016/0165-1889(88)90048-6
Wilcox, D. W. (1989). The sustainability of government deficits: implications of the present-value borrowing constraint. Journal of Money, Credit and Banking, 21(3), 291-306. https://doi.org/https://doi.org/10.2307/1992415
ADDITIONAL MATERIAL
A - Additional specifications on database assembly
In general, we collected all data from Central Bank's repository of time series, but a few remarks are in order. In the case of the net state debt indicator, in addition to considering the response variable in the model, we also used its lagged value (in one period) as a potential explanatory variable in the analyses. We also examined the state primary result as a share of state GDP. As interest rate, we considered the average debt load rate in the period, calculated by the ratio between nominal interests and the debt stock registered in the immediately previous period. For inflation, we used the national IPCA (National Extended Consumer Price Index), understood as the accumulated variation of the index in the quarter. As for the exchange rate, we considered the last daily quotation of the US commercial dollar in each quarter.
State GDP was not available in the same periodicity as the other variables’ data. This is because IBGE only calculates its annual value, and publishes it with a two-year lag. The alternative we sought was the interpolation of the state GDP values for the 1st, 2nd, and 3rd quarters, so that the values for the 4th quarter would correspond to the official IBGE publication.
The interpolation methodology consisted of using monthly Brazilian GDP, calculated by the Central Bank, as a reference value for each quarter. Since national GDP is composed of the simple sum of states' GDP, we considered that, in each year, the structure of shares or, in other words, each state’s participation in the composition of national GDP, remained the same from the first to the fourth quarter. Since these shares do not show high volatility within a year, or even along the years, and that the structure of shares suffered little change during the entire period, we assumed this methodology as a feasible alternative, using as a base the interpolation values calculated by the Central Bank itself.
For the four quarters of 2019 and 2020, we used the same proportions as for the 4th quarter of 2018, multiplied by the national GDP values calculated and released by the Central Bank.
Since it is a stock variable, the hypothesis is that the indebtedness level of the previous period is relevant for explaining the current level. The interest rate and GDP variation are variables frequently used to determine the direction of the stock variation from one period to another, and these variables, by hypothesis, have an inverse potential influence on the debt stock. The primary result, by definition, represents the "fiscal effort" of the entity to reserve resources for the payment and, consequently, reduction of the debt stock. Inflation and exchange, on the other hand, besides being important variables to explain the economic context, are, in some cases, used as indexers of the entities’ contractual debts.
B - Additional information on modeling the state public debt
The data of the assembled base represent the evolution of time series for a range of observed units (states), which showed the appropriateness of econometric modeling for panel data. Therefore, the research consisted of a descriptive assessment of the database; evaluation of the need to address discrepant points or to change the variables; estimation and testing of the best-fitting panel model (pooled, fixed effects, or random effects); analysis of the fit of the chosen model; and application of necessary corrections.
Initial tests, conducted by descriptive analysis and by calculating the cook distances and studentized residuals, identified two discrepant occurrences, capable of affecting the estimation of the model parameters. The two cases - Amapá, in the first quarter of 2020, and Rondônia, in the second quarter of the same year - refer to receiving extraordinary revenues from Union transfers, as compensation for the effects of the Covid-19 pandemic. These transfers caused an increase in their available funds, leading to atypical values of net debt/GDP.
Instead of removing these observations from the base, we chose to address these two points by including two dummies as independent variables in the model, in order to capture specifically their influence on debt variation, and to purge their effect on the calculation of the coefficients of the other explanatory variables.
The two inserted dummies were also significant in the final model, which confirms the initial tests on the influence of these variables on the results. Since they refer to specific observations, in a certain period, for two states, their coefficients have no impact on future forecasts.
Table 2 shows the results of the tests that justified the choice of the pooled model. The rejection of the models for panel data with fixed or random effects indicates the inexistence of an idiosyncratic component, characterized by unobserved variables that could cause relevant differences among the states. This means that, although heterogeneous in terms of economic and indebtedness levels, the structure and the evolution pattern of the states' debt are similar.
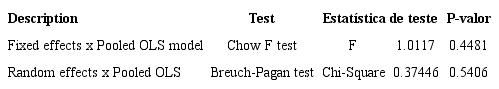
This is a coherent result, because the states show a similar debt structure: the Union is the main creditor; the contracts, in general, are tied to the same indexers; and they follow the same existing regulations for debt management, such as compliance with limitation rules and protocols for approving credit operations. In addition, the validity of a single model for all states, which uses the explanatory variables, is a result that confirms a general behavior of the Brazilian state debt, according to the macroeconomic theoretical models that characterize public debt.
The validity of a single model is also a relevant result for the management strategy of state public debt, since it explains the definition of single and broad transversal measures by the Central Government, which seek to control indebtedness or improve its management in all federation entities.
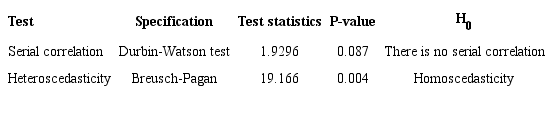
Table 3 shows the results of the Durbin-Watson and Breusch-Pagan tests, regarding the existence of serial correlation and heteroscedasticity in the model. The first test presented a favorable result, while the second was unfavorable. Therefore, we still had to make adjustments to achieve estimates with robust standard errors through White's estimator, in order to ensure the validity of the results and make forecasts.
C - Additional information on scenario simulations and probability of default
We conducted this part of the research from the relations identified in the estimated panel model. With the empirical equation that describes the dynamics of state public debt, and trough random draws carried out for the empirical distribution of the explanatory variables, we projected one million possible trajectories for the debt/GDP ratio over eight quarters.
The random draws were done as follows, for each state, separately:
(a) with the observed data, we calculated each percentile of the empirical distribution;
(b) from then on, a million random percentages were generated, representing potential values for the original explanatory variable, in each of the 8 projection periods; and
(c) the vectors of random values of each variable, in each period, were multiplied by the reverse of the Cholesky decomposed matrix, obtained from the correlation matrix of the empirical model previously estimated. We did this procedure to ensure that the drawn data presented the same correlation structure of the actual data observed and inserted in the estimation of the empirical model.
The choice of the non-parametric method described was the most viable operationally, given the need to make projections of four distinct variables for each of the 27 Brazilian states, making a parametric analysis impractical to identify each of the distributions, or to model their generating process.
By replacing the projected values of each random variable (inputs) in the estimated model, we obtained one million possible values for the debt/GDP ratio for each state, in each period; therefore, one million potential trajectories.
D - Consolidation of the indicators for debt/GDP variation and primary sufficiency
Table 4 allows a more precise analysis of the probability of debt increase, and the realization of a primary result sufficient to prevent debt growth. It describes the average probabilities of positive variation of these indicators for each quarter, or for the aggregate of 8 quarters, in addition to the average variation of debt per quarter, and the average sufficiency (or insufficiency) of primary result per quarter.
The states with the lowest probability of increasing debt per quarter - Mato Grosso do Sul, Alagoas, Mato Grosso, and Goiás, also show the lowest likelihood of increasing it in the whole period. We also see this relationship for the states with the highest probability of growth: Sergipe, Ceará, Rio de Janeiro, and Distrito Federal. The case of Acre and Amapá are exceptions; although showing a probability of debt growth per quarter above 51%, the high data variation caused more downward than upward trajectories for this indicator, in addition to a negative average marginal growth, which indicates that downward trajectories are steeper than the upward ones.
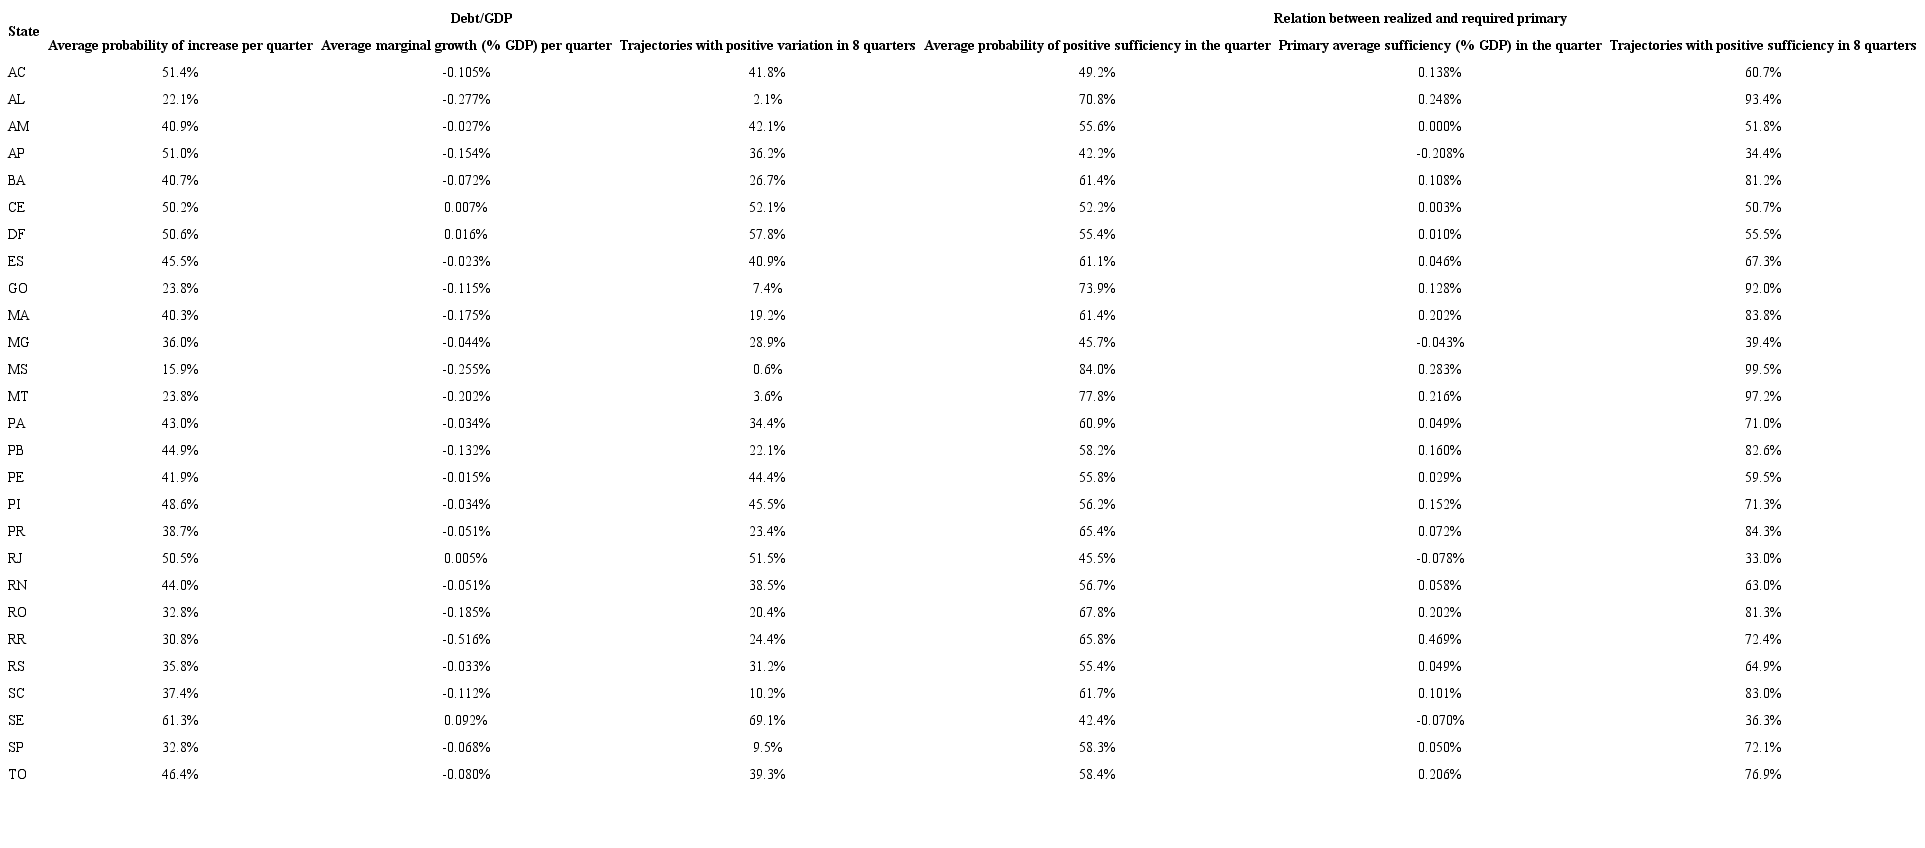
Although the growth of debt/GDP is a sign of unbalance and worsening of the state's fiscal situation, we should also pay attention to the capacity of generating sufficient primary result to cover this increase. The states that presented the lowest capacity for that were Rio de Janeiro, Amapá, Sergipe, and Minas Gerais, with probabilities between 30% and 40% of achieving sufficiency in the 8-quarter aggregate and negative average marginal sufficiency. Mato Grosso do Sul, Mato Grosso, Alagoas, and Goiás also stood out positively in this indicator, with sufficiency probability above 90% in total.
Author notes
The study provides state governments, the federal government, and financial institutions with a practical and dynamic tool for assessing the credit risk associated with Brazilian states. In addition, it raises important issues for discussions related to renegotiation and the national strategy for managing state public debt.
Corresponding author Tel. +55 (31) 3409-5000 E-mail: leonardo.bortolini@outlook.com.br (L. V. Bortolini); brunoperez.bh@gmail.com (B. P. Ferreira); frank_magalhaes@yahoo.com.br (F. M. de Pinho), Universidade Federal de Minas Gerais. Av. Pres. Antônio Carlos, 6627, Pampulha - Belo Horizonte/MG - 31270-901, Brazil