Article
Country corruption and abnormal book-tax differences: a multilevel analysis
Corrupção dos países e book-tax differences anormal: uma análise multinível
 Jéssica Rayse de Melo Silva jessicar@ufu.br
Patrícia de Souza Costa patricia.costa@ufu.br
Marco Aurélio dos Santos marco.aurelio.santos@fgv.br
Jéssica Rayse de Melo Silva jessicar@ufu.br
Patrícia de Souza Costa patricia.costa@ufu.br
Marco Aurélio dos Santos marco.aurelio.santos@fgv.br
Country corruption and abnormal book-tax differences: a multilevel analysis
Revista de Contabilidade e Organizações, vol. 16, e188514, 2022
University of São Paulo
Received: 15 July 2021
Accepted: 13 June 2022
Published: 24 November 2022
Abstract: This study seeks to investigate whether perceived corruption, which is characteristic of the institutional environment of many countries, is related to abnormal book-tax differences (ABTDs) for publicly held firms around the world. We have applied multilevel modeling to 170,543 observations for 99 countries from 2012 to 2018. Our research hypothesis proposes a positive association between ABTDs and countries' perceived corruption, and it was not rejected for the total sample and countries which have adopted the International Financial Reporting Standards (IFRS). These results suggest that in countries which have adopted the IFRS, managers are opportunistically using the greater flexibility resulting from the internationalization of accounting standards to practice corruption, and this may also possibly be influenced by the poor local institutional environment in terms of fighting corruption. This study contributes to the literature by offering new perspectives on how the business environment is affected by country characteristics, and employs multilevel modeling, which is the most accurate technique for samples with grouped structures.
Keywords: Abnormal book-tax differences, Perceived corruption, Profit quality, IFRS.
Resumo: Esta pesquisa se propôs a investigar se a corrupção percebida, característica do ambiente institucional dos países, apresenta relação com a book-tax differences anomal (BTDA) das companhias abertas. A amostra contempla 170.543 observações, pertencentes a 99 países no período de 2012 a 2018, que foram analisadas por meio de modelagem multinível. A hipótese de pesquisa, que aborda a associação positiva entre a BTDA e a corrupção percebida dos países, não foi rejeitada para a amostra total e para o grupo de países adotantes das International Financial Reporting Standards (IFRS). Isso sugere que para o grupo de adotantes das IFRS, a maior flexibilidade resultante da internacionalização das normas é utilizada oportunisticamente pelos gestores, que possivelmente são influenciados pela baixa qualidade do ambiente institucional em termos de corrupção. Os achados corroboram a premissa de que a baixa qualidade dos lucros das companhias está associada a maior corrupção percebida dos países. A pesquisa contribui com a literatura por trazer novas perspectivas sobre como o ambiente de negócios é afetado pelas características dos países, considerando a utilização da modelagem multinível, técnica mais acurada para amostras com estruturas agrupadas.
Palavras-chave: Book-tax differences anormal, Corrupção percebida, Qualidade do lucro, IFRS.
1 INTRODUCTION
Studies of corruption have been developed which relate country corruption with earnings management (Lourenço et al., 2018; Picur, 2004; Riahi-Belkaoui, 2004; Riahi-Belkaoui & Alnajjar, 2006; Santos & Takamatsu, 2018). The evidence obtained favors the association of environments with poorer quality profits with countries with greater levels of perceived corruption. Within the context of low profit quality, there are Abnormal Book-Tax Differences (ABTDs), which has been a sign of “bad news” for investors with its increase being successively associated with a reduction in the quality of accounting information (Brunozi Júnior et al., 2018, Brunozi Júnior et al., 2019).
ABTDs refer to the differences between book (accounting) profits and tax profits that cannot be explained by divergent tax treatment, and this occurs because accounting norms leave considerable room to maneuver in choosing accounting methods, while tax norms, even though they are more restrictive, tend to be ambiguous and susceptible to interpretation by taxpayers, which gives managers an opportunity to explore uncertainties in the legislation to pay lower taxes (Tang, 2006a).
The gap in this research centers around the possibility of exploring whether the informational content of ABTDs is influenced by the quality of a country’s institutional environment in terms of corruption. In light of the rational choice approach of the neo-institutional theory of economics, which considers the effect of the institutional environment on individuals’ decisions to maximize their own interests, this study seeks to investigate the relationship between corruption in countries and ABTDs in companies. We have analyzed 170,543 observations for 99 countries from 2012 to 2018 which provide evidence which supports the inclusion of perceived corruption metrics as an explanatory variable for ABTDs, and our hypothesis that there is a positive relationship between these variables was not rejected for the total sample and for countries that have adopted the International Financial Reporting Standards (IFRS). Thus, the evidence indicates that a greater level of perceived corruption in various countries is associated with poor quality profits for companies in these countries.
The results strengthen the theoretical framework which considers the influence of countries’ environmental statistics on the operational environment of companies there. Empirical studies like this one are supported by Malagueño Albrecht et al. (2010), who argue in favor of studies associating the presence and quality of accounting systems with corruption, even though there is a theoretically attractive link between these variables, and the need for empirical studies to support this connection.
In addition, this study contributes to the literature by offering new perspectives about how the business environment is affected by country characteristics, considering the utilization of HLM3 multilevel modeling, unlike the studies by Lourenço et al. (2018), Picur (2004), Riahi-Belkaoui (2004), Riahi-Belkaoui and Alnajjar (2006) and Santos and Takamatsu (2018), who have used multiple regressions and Ordinary Least Squares (OLS) to analyze the relationship between corruption and the operational level variables for these firms. Multilevel analysis is an appropriate technique for samples with structured groups, such as this one, because it recognizes the presence of these data hierarchies, and permits component residues on each level of the hierarchy (Căpraru et al., 2018).
In practice, users who act in the capital markets have an interest in understanding the relationship between corruption and the financial, organizational and political environment of countries to evaluate potential operational risks and opportunities (Kimbro, 2002). Thus, this study contributes by helping investors and investment analysts identify institutional factors which influence manager discretion which is reflected by ABTDs, thus, improving their investment decisions. Moreover, the examination of the relationship between a country’s corruption and the business environment presented in this study helps normalizers and legislators evaluate not only the appropriateness of accounting and taxation norms within scenarios with greater corruption, but also the need to revise mechanisms for best practices in governance, and the prevention and fight against corruption.
2 DEVELOPMENT OF THE HYPOTHESIS
There is no international consensus about the concept of corruption, but it has constantly been defined as the abuse of power for private gain (June et al., 2008). Corruption should not be confused with fraud, even though this term has been treated as a generic concept that includes other dishonest acts, such as corruption (Labuschagne & Els, 2006). To Snyman (2002), as cited by Labuschagne and Els (2006), fraud is a form of misrepresentation which causes real harm or potentially can cause harm to other parties, while corruption consists of illegal donations or the receipt of some benefit with the intent of manipulating or compensating the behavior of the receiver. Corruption should also not be confused with bribery, which is a form of corruption that consists of acts that concede financial benefits to government employees in exchange for favorable treatment or services (Jancsics, 2019).
Corruption can be analyzed using an individualistic approach or an institutional approach. Individual corruption consists of that which occurs in isolated acts of bad conduct by individual agents who use their positions in organizations to obtain benefits that have limited effects in terms of time and scope (Thompson, 2013). The institutionalist approach believes that corruption is constructed by organizational routines and practices, which occurs when an institution or its employees receive a benefit which is directly useful to the fulfillment of an institutional purpose (Thompson, 2018). Even though this analysis of corruption seems quite dichotomous, Thompson (2018) argues that in practice, elements of individual and institutional corruption coexist to various degrees and in various combinations, and as a result, cases of corruption can be appropriately described as more or less institutional or more or less individual.
The clandestine nature of corruption also makes it difficult to measure (Heinrich & Hodess, 2011). Corruption is illegal and regular and direct observation of corrupt activities is almost always impossible, which makes it difficult to have a measure of real corruption (Olken, 2009). This difficulty in measuring real corruption has led researchers to look for proxies, which are usually understood as perceptions of corruption (Heinrich & Hodess, 2011). Researchers such as Picur (2004), Riahi-Belkaoui (2004), Riahi-Belkaoui and Alnajjar (2006), Santos and Takamatsu (2018) and Lourenço et al. (2018) use perception metrics for corruption as a proxy for corruption in various countries.
Picur (2004), Riahi-Belkaoui (2004), Riahi-Belkaoui and Alnajjar (2006), Santos and Takamatsu (2018), specifically investigated the relationship between the level of perceived corruption in certain countries, measured by the World Bank's control of corruption index and the opacity of company profits. These authors verified that companies in countries with greater control over corruption present less opaque profits. Lourenço et al. (2018), in turn, consider the relationship between the perception of corruption, measured by the perceived corruption index of transparency international and the magnitude of absolute discretionary accruals as an earnings management metric. These authors find that in emerging economies, low levels of perceived corruption are associated with lower levels of earnings management, while in developed countries, lower levels of perceived corruption are associated with higher levels of earnings management. These authors conclude then that even though Riahi-Belkaoui (2004) and Riahi-Belkaoui and Alnajjar (2006) have demonstrated that countries with more elevated levels of corruption have more opaque financial statements, the utilization of a relatively homogeneous sample may not corroborate this relationship.
ABTDs are a statistic that has been associated with poor quality profits, and has a significant positive association with earnings management (Brunozi Júnior et al., 2018; Phillips, Pincus & Rego, 2003; Phillips, Pincus, Rego & Wan, 2003) and tax avoidance (Mills et al., 2002; Mills, 1998). Contrary to these ABTD studies that investigate earnings management in the absence of tax avoidance, and vice-versa, Tang (2006a) and Tang and Firth (2011) assume the simultaneous presence of both earnings management and tax avoidance, and assume empirically that ABTDs are an appropriate proxy for measuring earnings management and tax avoidance simultaneously, because they capture distortions in reports induced by managerial motivations after controlling for regulatory effects. Thus, ABTDs refer to the portion derived from discretionary choices in accounting and tax reports and they quantify the level of manipulation of book and tax profits (Tang, 2006a). Manipulations of book and tax profits that result in ABTDs are supported by agency theory, due to manager agency conflicts in terms of profits: reporting larger book profits will attract investors and lower tax profits will mean paying less tax (Hanlon et al., 2005).
Considering the theoretical framework which associates low quality profits with company ABTDs, and given that the existence of indications of poor-quality profits is associated with greater corruption in countries, we therefore postulate ceteris paribus:
-
H: Company ABTDs are positively associated with perceived corruption in countries.
The proposed hypothesis does not consider causality between the variables. Miller (2021) argues that corrupt actions are immoral, but not all immoral actions are corrupt. Thus, even though discretionary behavior can be considered immoral (Bruns & Merchant, 1990), it is not necessarily corrupt.
In this study, the association between the variables is supported by the neo-institutional economic theory which encompasses agency theory (Groenendijk, 1997). Rational choice, one of the approaches of neo-institutional theory, argues that the institutional environment influences individual behavior, but the individual naturally possesses a tendency to act in favor of his or her own interests to the detriment of collective benefits (Hall & Taylor, 2003). From this perspective, the absence of institutional arrangements results in the existence of dilemmas of collective action, which leads individuals to maximize the satisfaction of their own preferences, which leads to suboptimal results for the collective (Hall & Taylor, 2003). In line with this, in this study we consider corrupt behavior to be institutionalized on the country level and permeating multiple subunits and levels of organization (Ashforth & Anand, 2003). The highest levels of corruption create an environment which favors anti-ethical activities, and makes individuals more likely to accept opportunistic practices which are delineated by rational choice. This happens due to asymmetry of information which weakens the capacity of the investor to monitor and discipline managers, and thus facilitates opportunistic actions taken in self-interest (Riahi-Belkaoui & Alnajjar, 2006).
Kythreotis (2015) comments that the high level of corruption in countries is associated with a lack of implementation and application of laws, a low probability of punishment, and the existence of economic transactions that are not very transparent. To the author, in countries with high levels of corruption, managers have no fear of legal punishment, and this is why they choose particular accounting treatments in order to manipulate earnings, which reduces reliability and makes it impossible to get a faithful representation of financial statements (Kythreotis, 2015). Thus, it appears reasonable that in countries with higher levels of corruption, managers are more motivated to seek their personal interests due to an absence of institutional arrangements that strengthen collective benefits, which justifies this study’s expectation of our postulated positive association between perceived corruption and ABTDs.
It should be emphasized, however, that the relationship between the level of perceived corruption and ABTDs can be affected by the quality of the country’s accounting environment in terms of the presence of International Financial Reporting Standards (IFRS). Houqe and Monem (2016) believe that the accounting environment based on the IFRS can reduce perceived corruption and promote the publishing of corporate accounts. On the other hand, Kytherois (2015) does not believe that the adoption of the IFRS is sufficient to improve the reliability of financial statements because reliability is also affected by the degree of corruption in each country. Considering the possibility of a relationship between the IFRS and the perception of corruption in countries, which is not being investigated in this study, it is possible that the association between ABTDs and the perceived level of corruption is distinct between the groups which adopt and do not adopt international norms.
3 METHODOLOGICAL PROCEDURES
Our final sample consisted of 170,543 observations for 99 countries from 2012 to 2018. This study’s supplementary material contains the sample criteria used to obtain the sample.
The construction of a multilevel model used to verify this work’s hypothesis employed a multilevel step-up strategy which resulted in Equation 1. For more clarification about the application of this strategy and the obtained results, please see this study’s supplementary material.
Being:
ABTDi= abnormal differences between book profits and tax profits for company i in country j at time t;
γ000= expected value of the (average) dependent variable for the overall sample;
TIMEtij = level 1 explanatory variable (repeated measures) which corresponds to each year of the analysis (year = 1 for 2012, year = 2 for 2013, ..., year = 7 for 2018);
ROAij = Return on Assets of company i situated in country j;
TAij = natural logarithm of Total Assets for company i in country j;
INDij = ratio between third party capital and total assets of company i in country j;
SECTORij = sectors that company i situated in country j participates in, n-1 dummies;
GDPj = Gross Domestic Product of country j;
HDIj = Human Development Index for country j;
PCj = Perceived Corruption of country j;
LSj= country j’s Legal System, m-1 dummies;
ν00j= error associated with non-varying characteristics of country j over time;
τ0ij = error associated with non-varying characteristics of company i in country j over time;
ɛtij = error associated with company i in country j over time t.
We considered two metrics of perceived corruption as variables of interest: Perceived Corruption (PC), constructed based on an adjustment to the World Bank’s control of corruption index, which captures private sector corruption according to Rohwer (2009) and, for the sensitivity test, the Adjusted Perceived Corruption Index (APCI), which is based on the perceived corruption index issued by transparency international and focuses on corruption in the public sector. The supplementary material presents a detailed description, the expected sign in the correlation matrix, the theoretical reference which is the basis for all of the variables considered in the tested linear, hierarchical model, and the sensitivity test result.
The hierarchical model described in Equation 1 is composed of repeated measures. This means that the variables in Level 2 (company) and 3 (country) do not vary in the lower levels and this is why they are represented by their average values. This is why it was not possible to include a reference variable for IFRS in the equation, given that this information presented variations over the years. We then proceeded to group the observations in terms of their adoption of the IFRS. Thus, the described model was analyzed considering 3 groupings, the total sample, (without segregation for IFRS), non-adopters of the IFRS, and adopters of the IFRS.
4 RESULTS AND DISCUSSIONS
4.1 Descriptive analysis
The sample is made up of unbalanced panel data, with a progressive trend in the annual observance of companies situated in countries in which IFRS reporting is mandatory, which represented 58.09% (99,061 observations) of the total. Countries with mixed legal systems, namely more than one type of legal system, represented 56% of the total, followed by 22.9% of the observations for countries with a Roman legal tradition, or civil law; and 20.5% from countries with a single common law tradition.
Table 1 presents the descriptive statistics for the ABTD variable. Consult the supplementary material for the results obtained for the other quantitative variables.
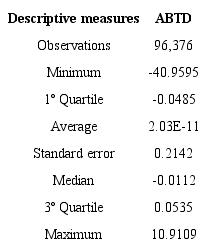
The ABTD measure is positive and for values close to zero it is close to the ABTD values obtained by Tang (2006a) and Tang and Firth (2011) for Chinese companies, but is substantially distant from the average obtained by Brunozi Júnior et al. (2018), who found values quite far from zero with negative magnitudes for ABTD in Brazilian companies. Positive values may suggest that the ABTDs of the surveyed companies involve manipulating book profits positively and/or tax profits negatively, as suggested by Tang (2006a).
The negative behavior present in half of the observations (median) is more aligned with the scenario found by Brunozi Júnior et al. (2018) for the Brazilian context, even though the sizes of the values are quite different. The negative sign suggests that these companies could be involved in discretionary earnings management which results in an underestimate of book profits and an overestimate of tax profits.
Table 2 presents the Pearson bivariate correlation coefficients obtained among the quantitative variables in this study.
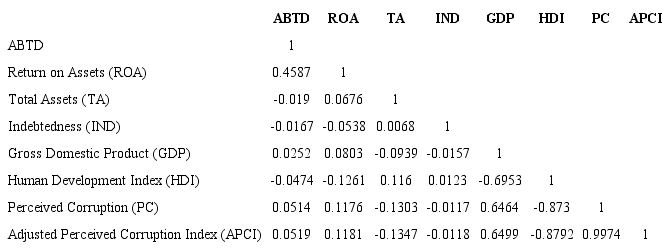
Table 2 demonstrates that ROA presents a positive association of a moderate degree with the ABTDs reported by companies. This finding is in line with the theoretical assumptions for the American context made by Manzon and Plesko (2002) and Frank et al., (2009), the Croatian context made by Šodan (2012), the Tunisian context made by Koubaa and Anis (2015), the Brazilian context made by Fonseca and Costa (2017), and the Chinese context by Tang and Firth (2011). These authors consider the positive association between discretionary behavior and company profitability, because in theory, profitable companies have more access to tax credits and the utilization of these tax benefits tends to reduce tax profits as compared to book profits (Manzon & Plesko, 2002). In the view of Tang and Firth (2011), the motivations behind the investment decisions and profitability of Chinese companies are related to the discretionary component of BTDs.
For the TA variable, the magnitude shows that the association between company size and ABTDs can be considered weak. The obtained sign suggests, without any causality, that as a company grows, ABTDs will diminish, and vice-versa. This result is in accordance with the technical assumptions postulated by Zimmerman (1983), Manzon and Plesko (2002) and Tang (2006a), and suggests a positive association between opportunistic behavior and company size.
For the IND variable, the strength of the association with ABTDs was also weak. The sign obtained indicates that, without attributing causality, as company indebtedness increases, ABTDs decrease, and vice-versa. The positive association between ABTDs and the variable representing the company’s capital structure is in keeping with the theoretical relationships pointed out by Watts and Zimmerman (1990), Frank et al. (2009) and Koubaa and Anis (2015).
For the country level variables, the GDP also corroborated the theoretical positive associations described by Picur (2004), Riahi-Belkaoui (2004), Riahi-Belkaoui and Alnajjar (2006). This result suggests that, when a country’s economic growth increases, the ABTDs for its companies will also increase without any causality.
The association between HDI and ABTDs also corroborates the findings of Picur (2004), Riahi-Belkaoui (2004) and Riahi-Belkaoui and Alnajjar (2006). The coefficient’s negative sign suggests that, to the extent that quality of life increases without any causality, company ABTDs decrease, and vice-versa.
Even though these are weak associations, it may be perceived that both of the measures of corruption used in this study (PC and APCI) presented a positive association with ABTDs. These results suggest evidence which strengthens the basic construct of this study, that environments with low quality profits are associated with greater levels of perceived corruption in countries.
4.2 Corruption and ABTDs: multilevel analysis
Table 3 contains the results obtained in the multilevel regression model which contemplates the PC variable as the variable of interest.
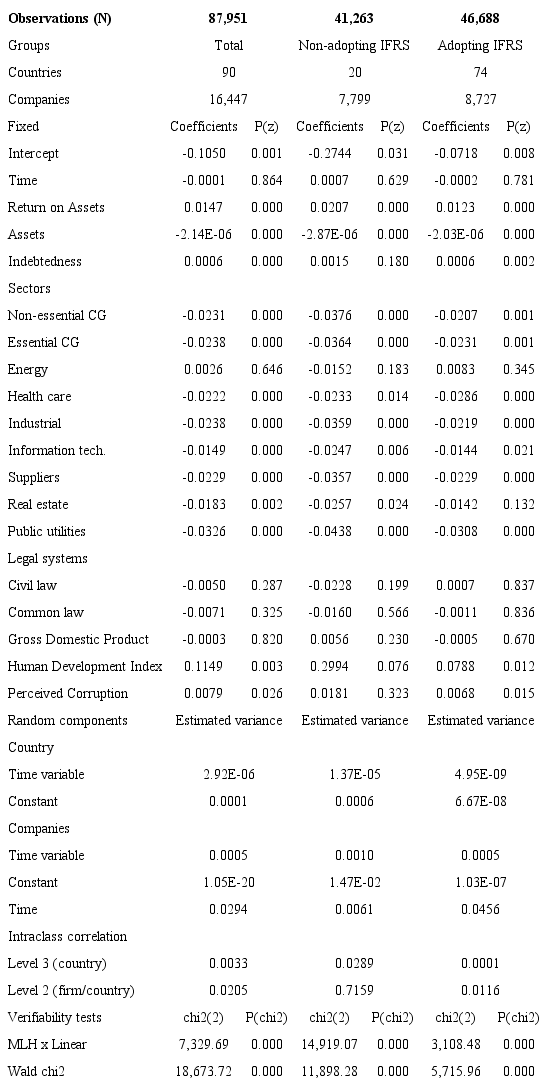
For all of the groups, the results of the Wald test indicate that the fixed effect components are not null. Moreover, the LR test demonstrated that the multilevel model was appropriate for the data structure presented in this study at a 1% level of significance for all cases.
The Level 3 intraclass coefficient demonstrates that average annual ABTDs are more correlated with the group of countries that did not adopt the IFRS (2.89%), than with the group of countries that did (0.01%). These results indicate that country characteristics, even though they have an influence, represented little of the annual average ABTD variation in the presence of the IFRS. The non-adopting IFRS group also presented a greater Level 2 correlation, suggesting that 71.59% of the average annual ABTD variance can be explained by the group characteristics of the companies and the countries, while in the adopting IFRS group, this percentage is significantly less than 1.16%. This signifies that the group characteristics of companies and countries tend to have more relevance for the non-adopting IFRS scenario.
Table 3 displays the results obtained for the PC variable which provide evidence for the acceptance of this study’s hypothesis, considering the total sample and the adopting IFRS group with 95% confidence. For both of these groups, the significance analysis indicates that, ceteris paribus, perceived corruption in countries explains the average annual ABTD variation reported by companies as proposed by our theoretical construct. Thus, greater corruption in countries is associated with poor quality profits.
The sign obtained for the correlation matrix repeats for the Return on Assets (ROA) variable, which is positively associated with ABTDs, and thus suggests, ceteris paribus, that more profitable companies report greater ABTDs for all groupings. The positive associations demonstrate that the behavior verified by Tang and Firth (2011) for Chinese companies, are also observed in multi-country samples. This indicates that motivations related to company profitability and investment policies are related to opportunistic behavior on the part of managers.
Even though the magnitude is very small, assets were a significant statistic with a negative sign. This means that when maintaining all other values constant, larger companies reported smaller ABTDs, especially in the non-adopting IFRS group. This result is in line with the findings of Watts and Zimmerman (1990), who consider that the greatest opportunities for managing earnings are in small companies due to less monitoring.
Indebtedness (IND) proved statistically significant for the overall sample and for the adopting IFRS group. For these groups, the results indicate more leveraged companies present greater ABTDs, without causality, which suggests that the high level of indebtedness may be a justification for more aggressive financial and tax reports, which was also found by Frank et al. (2009) and Koubaa and Anis (2015).
These findings demonstrate that the sector in which these companies act, with the exception of the energy sector for the overall sample, and the real estate sector for the adopting IFRS group, is related to reported annual ABTDs to a significant extent. The statistically significant sectors presented a negative sign which indicates that the companies of these sectors present, ceteris paribus, lower average ABTDs than those obtained by the communication services sector (the reference category).
The human development index variable was a significant statistic with positive coefficients, which is different from the sign presented in the bivariate correlation matrix in Table 2. This result in the inferred model, is in line with the proposals of Picur (2004), Riahi-Belkaoui (2004), and Riahi-Belkaoui and Alnajjar (2006), that companies situated in countries with a better quality of life require better quality accounting information.
The sensitivity test presented in the details of the supplementary material is in line with the results obtained in Table 3. It was verified that the variable of interest APCI had a positive relationship with the ABTDs for the overall sample and the Adopting IFRS Group, which corroborates the acceptance of our proposed hypothesis in this study.
5 FINAL CONSIDERATIONS
Corruption, as an abuse of power by private interests, is a characteristic of the institutional environment of a country which permeates society on various levels, and even involves the operational environment of corporations. Thus, the theoretical construct of this study considers whether a high level of perceived corruption can create a scenario that stimulates discretionary practices by managers in relation to book and tax accounting, exhibiting behavior that is also derived from agency relationships and increases Abnormal Book-Tax Differences (ABTDs). The hypothesis of a positive association between perceived corruption was not rejected for the overall sample and for the companies that adopted the International Financial Reporting Standards (IFRS).
To the extent that studies evaluate the relationship between the opacity of profits and the perceived corruption of countries, they have verified just one facet of management (earnings management), and this study represents an advance because it presents evidence that perceived corruption can be related to tax management, given that ABTDs capture in a simultaneous way, opportunistic managerial behavior in relation to book and tax profits.
This study finds an association between low quality profits and country corruption which may be influenced by environmental characteristics, because the presence of IFRS in this environment interfered with the reaction between the ABTDs and perceived corruption in these countries. The positive and significant relationship obtained in the scenarios that adopted IFRS (the overall sample and the adopting group) may provide indications that the greater resulting flexibility of the internationalization of norms may be being used in an opportunistic manner by managers to influence low quality country institutional environments (ones with greater corruption) not considering the subjectiveness responsible for these accounting choices.
This study also contributes by strengthening the theoretical framework of studies which investigate the influence of external environmental factors on company operational environments. The effect of country characteristics was corroborated by multilevel modeling which also contributed to the literature on this subject. The results represent advances because studies that investigate the relationship between the quality of profits and the corruption of countries have up until now just used one level of analysis (the company level), and this study provides indications that this relationship can vary between countries. These findings demonstrate to international normalization bodies the need to consider the macro-institutional environment in the delineation of norms. After observing how the specific qualities of countries interfere with the business environment, normalizers can use this material to edit more efficient norms, seeking not only to improve the quality of accounting information, but also implement policies that will prevent and combat corruption.
In practice, this study also contributes by demonstrating that investors need to consider the institutional environment of countries in making their investment decisions. They demonstrate that perceived corruption, and by extension, the characteristics that tend to be associated with it, like the weak application of the law and little risk of punishment, are factors that affect opportunistic behavior on the part of managers, which can affect profit reports.
In terms of future research, we recommend the utilization of other proxies on the country level in order to identify various characteristics of the macro-environment of countries which can influence the BTDs reported by companies, and the utilization of a multilevel model with a cross-referenced classification to reduce the degrees of freedom associated with the nominal variables utilized in this study.
REFERENCES
Ashforth, B. E., & Anand, V. (2003). The normalization of corruption in organizations. Research in Organizational Behavior, 25, 1-52. https://doi.org/10.1016/S0191-3085(03)25001-2
Ayers, B. C., Laplante, S. K., & McGuire, S. T. (2010). Credit ratings and taxes: The effect of book-tax differences on ratings changes. Contemporary Accounting Research, 27(2), 359-402. https://doi.org/10.1111/j.1911-3846.2010.01011.x
Brunozi Júnior, A. C., Kronbauer, C. A., Alves, T. W., & Martinez, A. L. (2019). Book-tax-differences anormais e persistência dos resultados contábeis e tributários em empresas de capital aberto listadas no Brasil. Revista Universo Contábil, 15(1), 07-26. https://doi.org/10.4270/ruc.2019101
Brunozi Júnior, A. C., Kronbauer, C. A., Martinez, A. L., & Alves, T. W. (2018). BTD anormais, accruals discricionários e qualidade dos accruals em empresas de capital aberto listadas no Brasil. Revista Contemporânea de Contabilidade, 15(35), 108-141. https://doi.org/10.5007/2175-8069.2018v15n35p108
Bruns, W. J., & Merchant, K. A. (1990). The dangerous morality of managing earnings. Management Accounting, 72(2), 22-25.
Căpraru, B., Ihnatov, I., & Pintilie, N.-L. (2018). Competition and diversification in the European Banking Sector. Research in International Business and Finance, 51(1), 1-30. https://doi.org/10.1016/j.ribaf.2018.09.014
Fávero, L., & Belfiore, P.(2017). Manual de análise de dados: estatística e modelagem multivariada com Excel®, SPSS® E STATA®. Rio de Janeiro, RJ: Elsevier Brasil.
Fonseca, K. B. C., & Costa, P. S. (2017). Fatores determinantes das book-tax differences. Revista de Contabilidade e Organizações, 29, 19-29. https://doi.org/10.11606/rco.v11i29.122331
Frank, M. M., Lynch, L. J., & Rego, S. O. (2009). Tax reporting aggressiveness and its relation to aggressive financial reporting. Accounting Review, 84(2), 467-496. https://doi.org/10.2308/accr.2009.84.2.467
Groenendijk, N. (1997). A principal-agent model of corruption. Crime, Law and Social Change, 27(3-4), 207-229. https://doi.org/10.1023/a:1008267601329
Hall, P. A., & Taylor, R. C. R. (2003). As três versões do neo-institucionalismo. Lua Nova: Revista de Cultura e Política, 58, 193-223. https://doi.org/10.1590/S0102-64452003000100010
Hanlon, M., Laplante, S. K., & Shevlin, T. (2005). Evidence for the possible information loss of conforming book income and taxable income. The Journal of Law and Economics, 48(2), 407-442. https://doi.org/10.1086/497525
Heinrich, F., & Hodess, R. (2011). Measuring corruption. In Measuring corruption: Handbook of Global Research and Practice in Corruption. Edward Elgar Pub. https://doi.org/10.4337/9781849805032
Houqe, M. N., & Monem, R. M. (2016). IFRS Adoption, Extent of Disclosure, and Perceived Corruption: A Cross-Country Study. The International Journal of Accounting, 51(3), 363-378. https://doi.org/10.1016/J.INTACC.2016.07.002
IFRS Foundation. (2001, April). International Accounting Standard IAS 29: Financial reporting in hyperinflationary economies. https://www.ifrs.org/issued-standards/list-of-standards/ias-29-financial-reporting-in-hyperinflationary-economies/
Jancsics, D. (2019). Corruption as Resource Transfer: An Interdisciplinary Synthesis. Public Administration Review, 79(4), 523-537. https://doi.org/10.1111/puar.13024
June, R., Chowdhury, A., Heller, N., & Werve, J. (2008). A user’s guide to measuring corruption. United Nations Development Programme, 1-81. https://www.undp.org/content/undp/en/home/librarypage/democratic-governance/anti-corruption/a-users-guide-to-measuring-corruption.html
Kimbro, M. B. (2002). A cross-country empirical investigation of corruption and its relationship to economic, cultural, and monitoring institutions: an examination of the role of accounting and financial statements quality. Journal of Accounting, Auditing & Finance, 17(4), 325-350. https://doi.org/10.1177/0148558X0201700403
Koubaa, R. R, & Anis, J. (2015). Book-tax differences: relevant explanatory factors. International Journal of Accounting and Economics Studies, 3(2), 95-104. https://doi.org/10.14419/ijaes.v3i2.4717
Koubaa, R. R., & Jarboui, A. (2017). Normal, abnormal book-tax differences and accounting conservatism. Asian Academy of Management Journal of Accounting and Finance, 13(1), 113-142. https://doi.org/10.21315/aamjaf2017.13.1.5
KPMG. (2020, February 23). Corporate tax rates table. https://home.kpmg/xx/en/home/services/tax/tax-tools-and-resources/tax-rates-online/corporate-tax-rates-table.html
Kythreotis, A. (2015). The interrelation among faithful representation (reliability), corruption and IFRS adoption: an empirical investigation. International Journal of Business and Economic Sciences Applied Research (IJBESAR), 8(1), 25-50. https://www.ceeol.com/search/article-detail?id=305784
Labuschagne, H., & Els, G. (2006). Corruption and fraud: any lessons for the auditor? Meditari Accountancy Research, 14(1), 29-47. https://doi.org/10.1108/10222529200600003
La Porta, R., Lopez-de-Silanes, F., Shleifer, A., & Vishny, R. W. (1998). Law and Finance. Journal of Political Economy, 106(6), 1113-1155. https://doi.org/10.1086/250042
Leuz, C., Nanda, D., & Wysocki, P. D. (2003). Earnings management and investor protection: An international comparison. Journal of Financial Economics, 69(3), 505-527. https://doi.org/10.1016/S0304-405X(03)00121-1
Long, Y., Ye, K., & Lv, M. (2013). Non-institutional determinants of book-tax differences: evidence from China. Journal of Accounting and Finance, 13(3), 146-153. http://t.www.na-businesspress.com/JAF/LongY_Web13_3_.pdf
Lourenço, I. C., Rathke, A., Santana, V., & Branco, M. C. (2018). Corruption and earnings management in developed and emerging countries. Corporate Governance: The International Journal of Business in Society, 18(1), 35-51. https://doi.org/10.1108/CG-12-2016-0226
Malagueño, R., Albrecht, C. O., Ainge, C., & Stephens, N. M. (2010). Accounting and corruption: a cross-country analysis. Journal of Money Laundering Control, 13(4), 372-393. https://doi.org/10.1108/13685201011083885
Manzon, G. B. J., & Plesko, G. A. (2002). The relation between financial and tax reporting measures of income. Tax Law Review, 55. https://heinonline.org/HOL/Page?handle=hein.journals/taxlr55&id=185&div=&collection=
Marschner, P. F., Dutra, V. R., Schwaab, K. S., & Ceretta, P. S. (2019). Determinantes das book-tax differences em empresas brasileiras: uma análise a partir do tamanho da empresa. Contabilidade, Gestão e Governança, 22(1), 1-18. https://doi.org/10.21714/1984-3925_2019v22n1a1
Miller, S. (2021). Corrupção institucional: Estudo em filosofia aplicada. Editora Vozes.
Mills, L., Newberry, K., & Trautman, W. B. (2002). Trends in book-tax income and balance sheet differences. SSRN Electronic Journal. https://papers.ssrn.com/sol3/papers.cfm?abstract_id=313040
Moore, J. A. (2012). Empirical evidence on the impact of external monitoring on book-tax differences. Advances in Accounting, 28(2), 254-269. https://doi.org/10.1016/j.adiac.2012.06.002
Olken, B. A. (2009). Corruption perceptions vs. corruption reality. Journal of Public Economics, 93(7-8), 950-964. https://doi.org/10.1016/j.jpubeco.2009.03.001
Phillips, J. D., Pincus, M. P. K., Rego, S. O., & Wan, H. (2003). Decomposing changes in deferred tax assets and liabilities to isolate earnings management activities. SSRN Electronic Journal. https://doi.org/10.2139/ssrn.452980
Phillips, J., Pincus, M., & Rego, S. O. (2003). Earnings management: New evidence based on deferred tax expense. The Accounting Review, 78(2), 491-521. https://doi.org/10.2308/accr.2003.78.2.491
Picur, R. D. (2004). Quality of accounting, earnings opacity and corruption. Review of Accounting and Finance, 3(1), 103-114. https://doi.org/10.1108/eb043397
Riahi-Belkaoui, A. (2004). Effects of corruption on earnings opacity internationally. Advances in International Accounting, 17(4), 73-84. https://doi.org/10.1016/S0897-3660(04)17004-9
Riahi-Belkaoui, A., & Alnajjar, F. K. (2006). Earnings opacity internationally and elements of social, economic and accounting order. Review of Accounting and Finance, 5(3), 189-203. https://doi.org/10.1108/14757700610686408
Rohwer, A. (2009). Measuring corruption: A comparison between the transparency international’s corruption perceptions index and the world bank’s worldwide governance indicators. CESifo DICE Report, 7(3), 42-52. https://www.econstor.eu/bitstream/10419/166975/1/ifo-dice-report-v07-y2009-i3-p42-52.pdf
Ryu, H., & Chae, S. J. (2014). The effect of book-tax conformity on the use of accruals: Evidence from Korea. Journal of Applied Business Research, 30(3), 753-762. https://doi.org/10.19030/jabr.v30i3.8560
Santos, L. C., & Takamatsu, R. T. (2018). Nível de corrupção dos países e opacidade dos resultados contábeis. Enfoque: Reflexão Contábil, 37(4), 21-32. https://doi.org/10.4025/enfoque.v37i4.34220
Šodan, S. (2012). Book-tax differences and companies’ financial characteristics: the case of Croatia. The Business Review Cambridge, 19(2), 265-271. http://www.jaabc.com/BRC19-2Summer2012Sodan.html
Tang, T. Y. (2006a). Book-tax differences: a function of accounting-tax misalignment, earnings management and tax management: empirical evidence from China. Business and Economics. The Australian National University. https://openresearch-repository.anu.edu.au/bitstream/1885/147339/2/b22994324_Tang_T_Y_H.pdf.
Tang, T. Y. H. (2005). Book-tax differences, a proxy for earnings management and tax management - empirical evidence from China. SSRN Electronic Journal, 1-36. https://doi.org/10.2139/ssrn.872389
Tang, T. Y. H. (2006b). The value relevance of book-tax differences - an empirical study in China’s capital market. SSRN Electronic Journal. https://doi.org/10.2139/ssrn.897120
Tang, T., & Firth, M. (2011). Can book-tax differences capture earnings management and tax Management? Empirical evidence from China. International Journal of Accounting, 46(2), 175-204. https://doi.org/10.1016/j.intacc.2011.04.005
Tang, T. Y. H., & Firth, M. (2012). Earnings persistence and stock market reactions to the different information in book-tax differences: Evidence from China. The International Journal of Accounting, 47(3), 369-397. https://doi.org/10.1016/j.intacc.2012.07.004
Watts, R. L., & Zimmerman, J. L. (1990). Positive accounting theory: A ten year perspective. The Accounting Review, 65(1), 131-156. https://doi.org/10.2307/247880
Xian, C., Sun, F., & Zhang, Y. (2015). Book-tax differences: Are they affected by equity-based compensation? Accounting Research Journal, 28(3), 300-318. https://doi.org/10.1108/ARJ-12-2013-0088
Zimmerman, J. L. (1983). Taxes and firm size. Journal of Accounting and Economics, 5, 119-149. https://doi.org/10.1016/0165-4101(83)90008-3
SUPPLEMENTARY MATERIAL
The collection of financial data utilized the Capital IQ online database, with an initial sample composed of 567,971 observations from 133 countries. Of these, we excluded those which did not list the country, observations from the financial sector, and those that did not have the maximum tax rate on profits, which is necessary to estimate taxable profits. In addition, we excluded those referring to hyperinflated economies, given that the operational results and financial positions of companies from these economies may not be useful (IFRS Foundation, 2001). Based on the Centre for Audit Quality (CAQ) report, which monitors countries which can be considered highly inflationary, we excluded observations from Argentina, Iran, Liberia, Libya, Sudan, Venezuela and Zimbabwe (Deloitte’s IAS Plus, 2019). Thus, the final sample consists of 170,543 observations from 99 countries during the period from 2012 to 2018.
For the treatment of outliers, we performed winsorization for all of the continuous variables on levels from 1% and 99%, as was done in the studies of Ayers, Laplante and Mcguire (2010), Tang and Firth (2012), Ryu and Chae (2014), Xian et al. (2015), and Marschner et al.(2019). After descriptive analyses, we proceeded with the estimation of the dependent variable BTD, in accordance with Equation 1, which we ran individually for each year of the sample. The equation is based on Tang (2005), Tang (2006a) and Tang (2006b), with an adaptation added by Koubaa and Jarboui (2017). The model performs a regression of BTD for non-discretionary items, which have been identified by Tang (2005), Tang (2006a) and Tang (2006b) as the original sources of the regulatory component. The unexplained portion of Equation 3, the residuals, are the measure for BTD.
In which:
BTDi= total book-tax difference, calculated by the difference between accounting profit and taxable profit. The taxable profit was estimated by an extrapolation, dividing current tax expenses by profit using the maximum tax rate on profit used in the country where the company is located, obtained from the KPMG website (2019).
∆REVi = represents the variation in company i's net sales revenues for the years t - 1 to t; staggered with lagged assets at t-1.
EARi = dummy variable equal to 1 (one) if company i reported a positive accounting earnings before taxes on profit, and 0 (zero) if it did not.
∆INVi = represents the variation in investments. It is calculated as the difference between the sum of investment, real estate and intangible accounts of company i for year t - 1 and year t, scaled by total assets at t-1.
LAGTDi = tax differences of company i reported in year t-1, staggered by total lagged assets at t-1.
ɛi = residuals of the equation, utilized as the dependent variable BTD in the main multilevel model.
In an analogous manner to Koubaa and Jarboui (2017), Tang and Firth (2011) and Tang and Firth (2012), we divided the independent variables of Equation 3 (with the exception of EAR) by total lagged assets at t-1, with the objective of mitigating problems related to the size of the companies. In addition, we estimated a cross-section of the model using robust errors to reduce (not eliminate) possible problems with heteroskedasticity. We performed the multicollinearity test for all of the years and verified that the variance inflation factors presented tolerable values.
We utilized the multilevel step-up strategy to construct the main model, which is based on a non-conditional (null) model for the composition of the variance. Equation 2 describes the null model tested in this study.
ABTDtij = represents the abnormal difference between accounting profit and taxable profit for company i in country j at time t;
γ000= expected (average) value of the dependent variable of the overall sample;
ν00j= error associated with non-varying characteristics of country j over time;
τ0ij = error associated with non-varying characteristics of firm i in country j over time;
ɛtij = error of firm i in country j over time t.
The analysis of the non-conditional models is relevant, because it permits the verification of whether there is variability in ABTD between companies from the same country and those from different countries. It should be noted that a repeated measure hierarchical model is being used in this study, which makes it inviable to insert a control variable regarding the adoption of IFRS as a predictor, with it being necessary to analyze by groups: overall sample (without segregation by the IFRS), non-adopters of the IFRS, adopters of the IFRS. Table 4 presents the results of the null model considering the complete sample, the non-adopters of the IFRS group, and the adopters of the IFRS group.
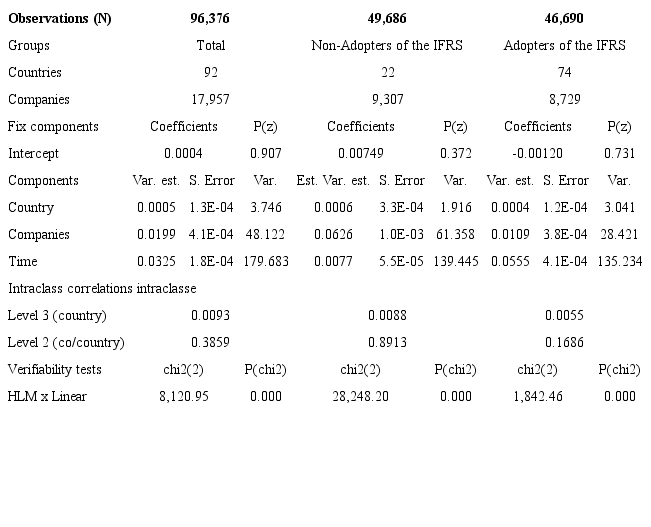
For all of the presented groups (the overall sample, non-adopters of the IFRS and adopters of the IFRS), the analysis of the chi2 probability test of verifiability suggested the non-acceptance of the null hypothesis with a 1% level of confidence, indicating that the estimation for the multilevel modeling is appropriate for the data structure presented in the sample.
In dividing the variances by their respective standard errors, we have what would be a close estimate of the z results for the random effects parameters (Fávero & Belfiore, 2017). We can verify from Table 1 that the proportions of the variances estimated by their respective standard errors (Est. Var. / Standard Error) were greater than the critical value of a normal standard distribution with a significance of 5%, which is 1.96, for all of the groups. This group corroborates the choice of multilevel modeling instead of traditional OLS modeling. These results, then, indicate that the latent characteristics of countries can explain differences in the ABTD of the companies for all of these groupings.
For the overall sample, the intraclass correlation between the average annual ABTD for the same country (level 3) and 0.93%, which suggests that the ADs are slightly correlated among the countries. For the overall sample, the intraclass correlation for level 2, which refers to the correlation between average annual ABTD for the same company in a given country is 0.3859%, indicating that the random effects of the firms and countries explain approximately 39% of the total variance of the residuals.
Considering the segregation of the samples, the intraclass correlation for level 3 demonstrates that annual ABTD is more correlated with the characteristics of the countries in the non-adopters of the IFRS group with a value of 0.88%, while for the adopters of the IFRS group, this variation is 0.55%. These results indicate that the characteristics even though they influenced the ABTDs, represent little of the variation of the average annual ABTD. The non-adopters of the IFRS group also presented a higher correlation for Level 2, with a value of 0.8913, which suggests that approximately 89% of the variance in average annual ABTD can be explained by the combination of the characteristics of the companies and countries. For the adopters group this percentage is significantly less, on the order of 16.86%. This signifies that the combined characteristics of the firms and countries tend to have more relevance in a scenario where there is no adoption of the IFRS.
The following step of the multilevel step-up strategy proceeded with the application of a model with random intercepts and a model with random intercepts and inclinations for the definition of the random nature of the error terms (Fávero & Belfiore, 2017). After the realization of a Likelihood Ratio (LR) test to compare estimations for all of the groupings, namely the overall sample, the non-adopters of the IFRS group, and the adopters of the IFRS group, the models with random intercepts and inclinations presented the best fit.
The final step consisted of the insertion of the control variables for the firm and country levels as well as the variable of interest (also the country level) in the fixed effects component, which resulted in the final test model of this study. Table 5 presents a detailed description of the control variables utilized.
The variables of interest were defined based on the World Bank’s control of corruption indicator and the corruption perceptions index emitted by transparency international. In comparing measures of corruption, Rohwer (2009) explains that the World Bank’s indicator measures the perception of corruption in both the public and private sectors, because it is based on sources that provide corruption data on the family level, while the transparency international measure captures the perception of corruption only in the public sector. Considering this, we have adopted the World Bank indicator as the main corruption measure in this study, since it is theoretically in line with this study’s objective which is to analyze companies in the private sector. An adjustment was made to facilitate the analysis of the relationship between the model’s variables, with the control of corruption indicator being multiplied by -1, which results in a variable termed Perceived Corruption (PC) in which greater values suggest a greater level of perceived corruption in these countries.
Finally, based on transparency international’s indicator we constructed the Adjusted Perceived Corruption Index (APCI), which was used in additional tests to give this study’s findings robustness. Similar to Botinha (2018), we adjusted the perceived corruption index, multiplying the indicator by -1, which resulted in the APCI variable. Thus, in this study, the indicator varies from -100 to 0 with values closer to -100 indicating a lower perception of corruption in the country.
Table 6 presents the results obtained with the univariate descriptive statistics of the study’s quantitative variables considering the entire sample.
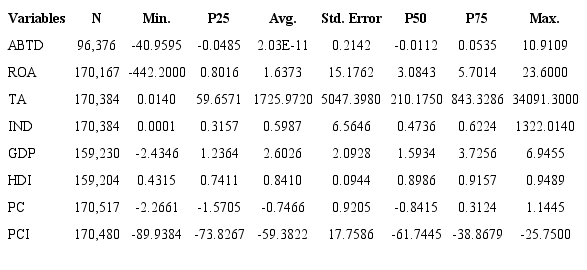
Note that within the variables at the firm level, TA stands out for its heterogeneity, because it presents elevated standard errors. It may be perceived that the average was influenced by high values in the sample, mainly in the upper quartiles. Compared to the literature, we may note that this standard error is expected for TA, because its behavior in relation to the variable’s large standard errors was also observed in the studies conducted by Šodan (2012), Koubaa and Anis (2015) and Fonseca and Costa (2017).
In terms of the country variables, we may note the presence of countries with negative GDPs, which indicates a contracting economy. The elevated values also influenced the average behavior of this variable, bearing in mind that the presented average is lower than the median, or in other words, even though the average was 2.6026, 50% of the observations refer to countries with a maximum GDP of 1.5934. For the HDI, the closer it is to 1, the better the quality of life. The behavior of the variable is homogeneous given the proximity of the average (0.8410) and the median (0.8986) and the low standard error. Note that just 25% of the observations are situated in countries which have an indicator greater than 0.9, which is considered to be a relatively high level of human development.
In terms of the corruption indicators used, we have verified that the variable emitted by the World Bank, here termed PC, is much less heterogeneous than the variable emitted by transparency international, the APCI. The CP variable measures the perception of the degree to which public power is used for private gains. Due to the sign adjustment, in this study this indicator varies between -2.5 and 2.5, where greater values represent a greater perception of corruption. It may be noted that the country that presented the lowest perception presented an indicator estimated at -2.2661, which in other words represents strong governance. On the other hand, the country with the greatest perception of corruption presented an indicator estimated to be 1.1445, which in other words represents weak governance. The APCI classifies countries based on how corrupt the country’s public sector is based on the perceptions of specialists and business executives. Due to the adjustment of this variable (it was multiplied by -1), in this study it varies from -100 to 0, where the closer it is to 0 the greater the perception of corruption is. In the sample, the country which presented an ACPI of approximately -89.94 was the one with the lowest perception of corruption in the sample, while the country with the worst index estimated at -25.75 was the closest to 0, indicating the greatest perceived corruption.
Author notes
It demonstrates to investors that the institutional context of countries can provide insights about possible levels of performance distortion due to manager discretion. Normalizers and legislators can use these results to issue norms and identify the need to revise the implementation of corruption prevention mechanisms.
Corresponding author Tel. +55 (34) 3291-5904, E-mail: jessicar@ufu.br (J. R. de M. Silva); patricia.costa@ufu.br (P. de S. Costa); marco.aurelio.santos@fgv.br (M. A. dos Santos), Universidade Federal de Uberlândia. Av. João Naves de Ávila, 2121 - Santa Mônica/MG - 38408-100, Brazil