Article
Social network analysis against corruption: a study of the public budget related to the Covid-19 pandemic
Análise de redes sociais contra a corrupção: estudo do orçamento público vinculado à pandemia do Covid-19
 Rafael Sousa Lima rafaellima1515@gmail.com
André Luiz Marques Serrano andrelms.unb@gmail.com
Rafael Sousa Lima rafaellima1515@gmail.com
André Luiz Marques Serrano andrelms.unb@gmail.com
Social network analysis against corruption: a study of the public budget related to the Covid-19 pandemic
Revista de Contabilidade e Organizações, vol. 16, e191515, 2022
University of São Paulo
Received: 15 October 2021
Accepted: 07 August 2022
Published: 23 November 2022
Abstract: The fight against the Covid-19 pandemic triggered almost immediate reactions from governments worldwide. Economic resources were requested to maintain the economy and help families and businesses, causing unprecedented changes in public budgets. However, this context opened a window of opportunity for corruption, an evil that afflicts all societies. Against this backdrop, this study captured budget data and applied social network analysis and graph mining techniques to examine the 2020 Brazilian extraordinary federal budget related to Covid-19, searching for signs of corruption in municipalities. The results indicate the potential of the graph approach to identify municipalities more susceptible to corruption since studying the relationships between companies and municipalities offers investigative insights that would probably not be achieved through traditional models. The findings are a valuable source for scholars and practitioners looking for methods to improve the work of monitoring and control agencies and law enforcement.
Keywords: Social network analysis, Graph, Corruption, Pandemic.
Resumo: O combate à pandemia desencadeou quase que imediatamente reações por parte de governos em todo o mundo. Recursos econômicos foram direcionados para manutenção da economia e auxílio a famílias e empresas, gerando alterações sem precedentes nos orçamentos públicos. Considerando que a corrupção é um mal que aflige todas as sociedades, abriu-se uma janela de oportunidade para desvios de recursos públicos. Nesse contexto, este estudo teve por objetivo analisar os créditos extraordinários abertos no orçamento federal de 2020 destinados ao enfrentamento da pandemia do Covid-19, capturando dados da execução orçamentária e promovendo análises em busca de sinalizações para atos de corrupção nos municípios. Para tanto, foram utilizados métodos quantitativos e qualitativos, suportados pela análise de redes sociais e mineração de grafos. Os resultados indicam o potencial da abordagem com grafos na identificação de localidades mais suscetíveis à existência de atos de corrupção, uma vez que o estudo das relações entre empresas e municípios oferece insights investigativos que provavelmente não seriam alcançados por meio de modelos tradicionais de investigação. Como contribuição, os achados da pesquisa podem ser úteis para pesquisadores e profissionais que buscam métodos para fortalecer as atividades dos órgãos de fiscalização e controle, contribuindo com o aperfeiçoamento da gestão pública.
Palavras-chave: Análise de redes sociais, Grafo, Corrupção, Pandemia.
1 INTRODUCTION
Social researchers claim that the unexpected addition of financial resources in periods of natural disasters increases corruption (Leeson & Sobel, 2008; Yamamura, 2014; Nikolova & Marinov, 2017), which is a conclusion that applies to the Covid-19 pandemic (Gallego et al., 2020; Payne, 2020). For Anessi-Pessina et al. (2020), Covid-19 opened the door to inefficient use of public resources and corruption. More resources were channeled to handle the emergency, governments enjoyed more discretion in the decision-making processes (particularly regarding resource allocation), and transparency and accountability mechanisms were relaxed.
Given the flexibility of control mechanisms and the inherent complexity of the pandemic, it is crucial to implement a national research agenda to offer effective responses, not only for the current emergency but for future events (Miller & Blumstein, 2020). Studies on public security policies are timely, and academics must contribute by directing the discussions (Sheptycki, 2020), focusing on empirical and non-speculative research (Fazekas & Tóth, 2016). Furthermore, Luna-pla and Nicolás-Carlock (2020) state that theory-based research alone is insufficient to understand the systemic nature of corruption in disaster environments, recommending an empirical and interdisciplinary approach.
In the fight against corruption, every effort must be directed toward capturing data to address the main question challenging academics: “What can be learned from this experience to leverage crime reduction in the future?” (Sticle & Felson, 2020, p. 527). Therefore, the importance of data mining stands out, which is an invitation to use social network analysis (SNA). This approach seeks to perceive scenarios using diagrams with sets of points and connecting lines forming networks or graphs. For Chang (2018), the SNA approach can contribute to the literature by offering a new methodology for the empirical study of corruption. Meanwhile, Morselli (2010) states that mining graphs make it possible to identify criminal organizations’ structures and not just assume group formations, which enhances academic research.
This study captures budget data and adopts graph mining techniques to analyze the provisional measures issued by the Brazilian federal executive branch that opened extraordinary credits in the 2020 budget to face the Covid-19 pandemic, searching for signs of corruption in Brazilian municipalities. To the best of our knowledge, this is the first study using such an approach for this purpose. In addition, the research focused on the systemic view of corruption, moving beyond the limits of isolated cases toward structural analyses while avoiding centralizing discussions around traditional econometric models. The results showed a network of public contracts linking municipalities and beneficiaries of public resources made available to fight the Covid-19 pandemic. Also, the analysis highlights the municipalities that, in the context of this study, were more susceptible to corruption. The findings contribute to investigating, monitoring, and controlling corruption in Brazilian municipalities and help to improve the decision-making process in public security and financial control and intelligence agencies.
2 THEORETICAL FRAMEWORK
In the last century, Becker (1968) stated that following the law is not something to be taken for granted in a society, which naturally refers to the emergence of corruption. Nye (1967) believed that corruption is related to behaviors that deviate from the expected public function, motivated by a private interest, with pecuniary gains or status. Although the term corruption has conceptual delimitations that may vary over time, the central idea remains unchanged. In general terms, corruption involves using public power to gain an unjustified private advantage (Hauser, 2018).
Some studies on corruption use the public choice theory to identify factors that prevent public managers from “always” making the best choices for the public interest. This theory analyses governmental activity by perceiving state action as a process involving individual political agents who react to the incentives they receive. Therefore, rulers do not always seek to maximize public welfare, as they may place their personal interests as a significant variable in the decision-making process in public management (Svensson, 2000; Garrett & Sobel, 2003; Yamamura, 2014; Carraro et al., 2015; Avis et al., 2018; Luna-Pla & Nicolás-Carlock, 2020).
Another way of understanding the concept of corruption is to see it as the process of capturing the state by elites and private interests (Kaufmann et al., 2010), with abusive use of the public service to obtain private advantage (Mauro et al., 2019). Fazekas and Tóth (2016) explain that state capture occurs when some members of organizations or business groups appropriate government functions and use their prerogatives to benefit their group, even if it causes damage to the res publica.
Svensson (2000) explains that the term rent-seeking is used to describe organized social groups that capture a large part of government resources, either with the direct appropriation of financial benefits or indirectly by manipulating the political system to implement actions (regulations/policies) favorable to the group. In the view of Sodré and Alves (2010), the probable action of rent-seekers seems to motivate corruption on the part of public managers.
For Svensson (2000), receiving unexpected resources after disasters is more associated with corruption in countries that suffer from the activity of competitive social groups. According to Garrett and Sobel (2003), financial support in disaster situations is more motivated by political issues than real needs, and support occurs more often in election years. In many societies, corrupt behavior is rooted in historical origins, social norms, and political culture, with solid interconnections between power, politics, and money. Entrepreneurs and political agents seek to maximize their interests, finding in the political market the opportunity to meet their demands since politicians need to obtain resources for their campaigns and thus increase the probability of being elected, while entrepreneurs need public policies aimed at objectives that allow them to maximize profits (Yamamura, 2014; Carraro et al., 2015; Santos, 2019).
Therefore, the need for governments to spend large amounts of resources to face the pandemic created opportunities for corruption in public procurement (Gallego et al., 2020; Anessi-Pessina et al., 2020). The main cause is the relaxation of protocols designed to provide security, efficiency, and transparency to public spending. For the authors, the most evident change in locations with less state capacity and high levels of corruption was the increased discretion to purchase goods and services, including circumventing bidding processes.
Furthermore, Leeson and Sobel (2008) state that the chaotic and confusing atmosphere in disaster scenarios creates opportunities for theft and increases the gains from fraud. These factors favor the practice of corruption, especially in local governments. Nikolova and Marinov (2017) understand that the unexpected increase in financial resources right after disasters increases corruption in local governments, with resources tending to be more diverted in richer municipalities and those with less informed voters.
Regarding data mining and its exploratory nature (Fayyad et al., 1996; Shafique & Qaiser, 2014; Martínez-Plumed et al., 2019), one of the lines of action involves the graph-based approach. Mining graphs consists of using algorithms to discover interesting, unexpected, and useful patterns in broad networks, which allows for a deep understanding of the data (Rehman et al., 2012; Aridhi & Nguifo, 2016). This visual technique has been convenient for capturing real-world phenomena, proving useful in detecting anomalies in large amounts of data (Troncoso & Weber, 2020).
In social sciences, some studies such as Ribeiro (2014), Fazekas and Tóth (2016), Chang (2018), Colliri and Zhao (2019), Diviák et al. (2019), Luna-pla and Nicolás-Carlock (2020), and Resende (2020) have used graph mining techniques. In accounting, studies have used graph mining to assess the influence of social capital in academic co-authorship networks (Barbosa Neto et al., 2016), the impact of social capital on the market value of listed companies (Aranha et al., 2016), the relationship between interlocking and income smoothing practices (Ribeiro & Colauto, 2016), the composition of networks of independent auditors (Kacanski & Lusher, 2017), among others. Studies have frequently used support metrics such as diameter, density, path size, centrality, clustering coefficient, modularity, network mapping, clusters, and communities.
3 METHODOLOGY
This research applied quantitative and qualitative methods integrated through the SNA approach. The qualitative nature is observed in the efforts to understand the meaning of the entities that make up the budget network. The quantitative aspect refers to examining the relationships between variables using statistical procedures and mathematical algorithms, making it possible to replicate the results.
3.1 Data collection and treatment
The first step of data collection consisted of studying the budget law. In 2020, 39 provisional measures were issued to provide extraordinary credits related to the pandemic, totaling BRL 630 billion. The budget actions indicated in the provisional measures made it possible to compose the budget of the extraordinary credits for 2020. As this study investigates the use of resources at the municipal level, it was necessary to find where the funding commitment was allocated. The commitments included the name of the location where resources were allocated. However, either the location referred to the Brazilian state, or the funding commitment was labeled as “national”.
Nevertheless, the third largest budget action (21C0 - addressing the public health emergency of international importance resulting from the Coronavirus) had funding commitments with data on the benefited municipalities, indicating the place of resource application, which constituted the database budget. Budget execution in this action was carried out by 59 budget units, issuing 73,929 funding commitments, most of which were issued by the National Health Fund (36,723 | 50%) and by the Ministry of Defense (19,517 | 27%), in addition to 36 universities (2,326 | 3%), and 18 other institutions (15,363 | 20%).
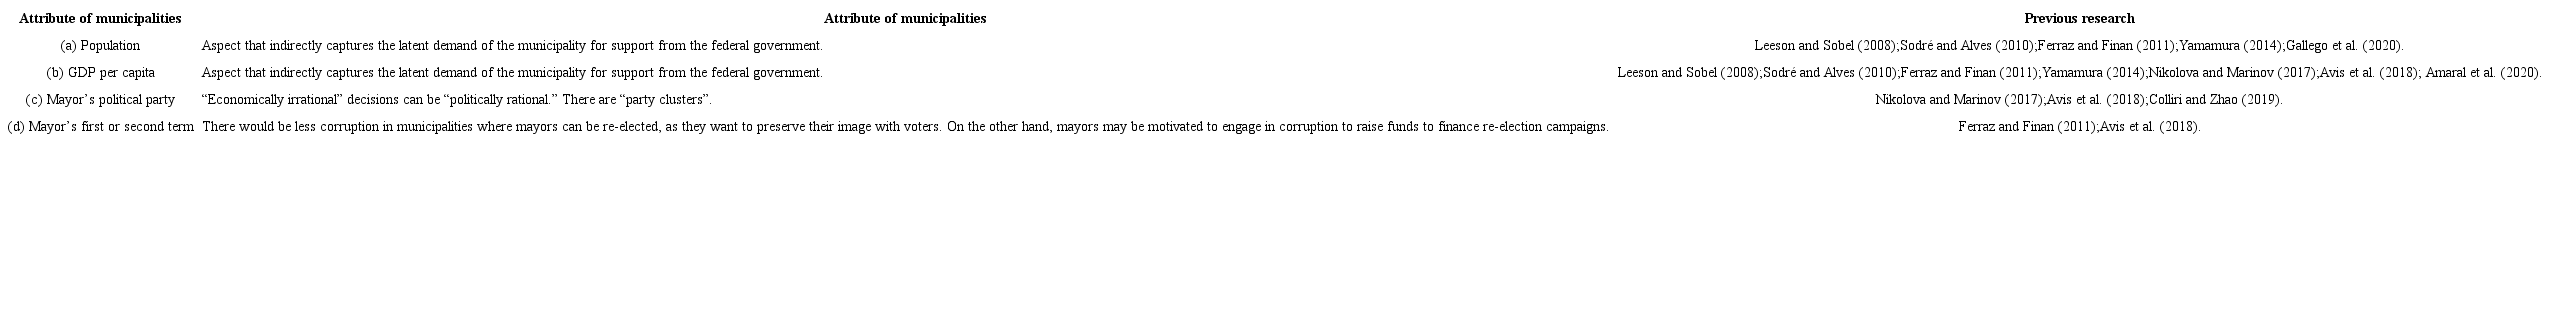
Once the database was captured for budget analysis, information that could indicate municipalities more susceptible to corruption was collected. Four objective municipal variables were chosen, described in Table 1.
Data were also collected on people infected and killed due to the pandemic to strengthen the analyses. Although there is no consensus on these numbers, the data available on the Ministry of Health website, known as the “panel of disease cases in Brazil”, was chosen. The data used are numbers accumulated up to September 01, 2020, when the “first wave” of the pandemic began to reduce. Although this choice of date is arbitrary, it is believed that this data possibly influenced the execution of the budget in the last quarter of 2020 and reflects, to some extent, the initial impacts of the pandemic.
Database preparation is often neglected in social research (Amani & Fadlalla, 2017), highlighting that the data collected and processed were considered adequate for the purpose of this study, concerning aspects of accuracy, validity, reliability, and measurement error (Wasserman & Faust, 1994; Robins, 2015).
3.2 Data analysis
The analysis was supported by IBM i2 Analyst’s Notebook and Gephi tools (Bastian et al., 2009). Following Barabási (2016), preference was given to the terms network, node, and link, which is the recommended terminology for studying real systems. Other terms, such as graph, entity, and relationship, were used.
A network was built with two types of nodes: municipalities and beneficiaries of funding commitments. They were identified by the name of the beneficiaries informed in the commitments. As for the municipalities, the IBGE code was adopted, including in the network all Brazilian cities with population attributes, GDP per capita, mayor’s party, and whether the mayor was re-elected.
The link between municipalities and beneficiaries of the funding commitments was established based on the location of the beneficiaries. Considering that some of the beneficiaries appeared in two or more locations, the “presumed” network was expected to materialize during the analysis. The result can be seen in Figure 1, visually highlighting the 10 municipalities with the most relationships.

Figure 1
Network based on data from the budget action 21C0
Source: Elaborated by the authors.
The network is divided into a connected and a disconnected subgraph. The disconnected subgraph comprises hundreds of smaller components; for most components, there is no connection between municipalities. In turn, the connected graph is known as a “giant component”, with at least one connection between every pair of nodes. This division into subgraphs can be considered normal, as many real networks have numerous isolated components that coexist with a giant component (Barabási, 2016). Altogether, the network has 18,307 nodes, of which 5,570 are municipalities, and 12,737 are favored and can be classified as a static network of great size and complexity. It was observed that 3,053 municipalities (more than half of the cities) did not receive funds from the 21C0 budget action; thus, these locations did not have links with beneficiaries of funding commitments to combat the pandemic.
The methods used by the SNA were developed to investigate patterns of interactions between social actors, which is why the approach focuses on relationships established between actors, not the actors themselves. This argument explains the in-depth discussion around the giant component presented in the next section. The study followed the script suggested by Cherven (2015), including, not necessarily in this order, three aspects: concepts, centrality, and clusters.
4 RESULTS AND DISCUSSION
Of the 73,929 funding commitments linked to the 21C0 budget action, almost 30,000 were directed to the Executive Board of the National Health Fund, located in Brasília, representing just over BRL 30 billion or 65%. This entity was excluded from the giant component analysis as it could greatly influence the results. Also excluded were around 3000 funding commitments with a value of zero.
As a result, the giant component included 5,816 nodes (representing 31% of the entire network), with 136 municipalities and 5,723 beneficiaries, linked by 5,853 links representing 25,106 grouped funding commitments, totaling around BRL 12 billion or 25% of the total value of 21C0.
Several visualizations were tested for the giant component with the help of algorithms that seek to identify groups in larger networks. A visual pattern was established to facilitate comparative analyses using the Force Atlas 2 algorithm, which allows defining, among other settings, repulsion (greater spacing between nodes), attraction (greater approximation of clusters), and gravity (highest concentration of nodes at the center of the graph). Thus, Figure 2 aids the discussion of the results.
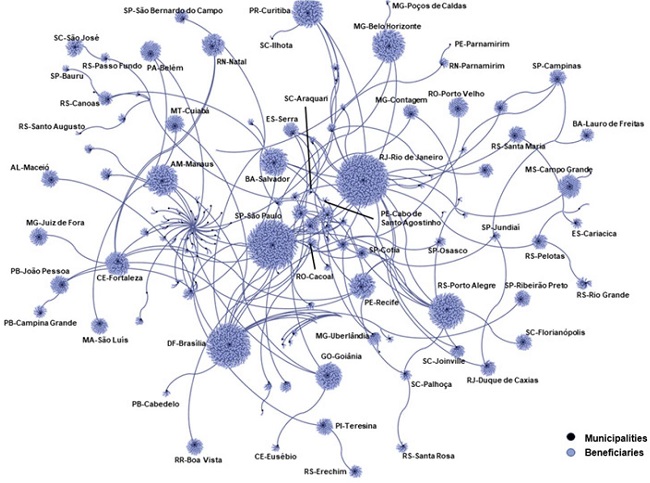
Figure 2
Giant component of the budget action 21C0
Source: Elaborated by the authors.
For Barabási (2016), regardless of which network property is of interest, the giant component must be analyzed in light of the degree distribution. In this sense, there is a significant difference in degrees between the nodes, as some municipalities appear as hubs (São Paulo, Rio de Janeiro, and Brasília are the largest). The average degree is 2.013, which means that the vast majority of nodes connect to only two other nodes, confirming the prominence of hubs. The average path between two nodes is 6.409, and the network diameter is 18. It is important to clarify that in every giant component, there are one or more beneficiaries in common between two or more municipalities, with no direct connection between municipalities or beneficiaries, forming a bipartite network. Thus, the clustering coefficient is zero, making it impossible to have closed triangles. Homophily is observed as the groups are more connected internally, with the clear presence of hubs, but with little connectivity between them. Homophily can restrict the flow of information, with the entities that connect these groups gaining relevance (in this case, the beneficiaries of funding commitments).
Although establishing direct causal relationships for corruption is practically impossible (Luna-Pla & Nicolás-Carlock, 2020), the analysis was deepened based on variables that could indicate a greater probability of corruption in the municipalities. We tried to employ the intelligent use of filters, sizes, and colors in the graphs, as these techniques help reduce the networks’ complexity, focus on the most relevant relationships, and allow a clearer view of the set of relationships.
Thus, the giant component was first manipulated based on the variables political party (3.a) and whether or not the mayor was re-elected in 2016 (3.b). Such a measure is justified since Brazil has a persistent system of corruption (that has been observed for decades) involving political actors and could be captured in the graphs.

Figure 3
Political networks in the giant component
Source: Elaborated by the authors.
In Figure 3.a, two groups were observed in the giant component, both with 27 municipal managers linked to the same party. The political bias of financial support in disaster situations makes the distribution of resources susceptible to being more influenced by political issues than necessity (Garrett & Sobel, 2003). Furthermore, political groupings may be associated with the so-called “corruption neighborhoods”, a scenario in which entities that engage in political corruption are more likely to relate to other entities also involved in corruption (Colliri & Zhao, 2019).
From the perspective of re-election (Figure 3.b), the giant component is dominated by first-term mayors, which, in theory, suggests a lower probability of corruption in the network, given the reducing factor “re-election”, i.e., the possibility of re-election may motivate mayors to avoid corruption since it can damage their image with voters (Ferraz & Finan, 2011). However, it is noteworthy that re-election may be a factor triggering corruption since mayors may engage in wrongdoings to raise funds to finance the electoral campaign (Avis et al., 2018).
As for mayors in their second term, it is observed that they have more relationships with each other, with a specific concentration on the left of the network. Considering the longer term of office and the impossibility of another re-election, the greater relationship between them may have some relation to the rent-seeker groups, as manipulations of the political system require more time to establish trust and implementation.
The analysis continued with the variables population and GDP per capita. The node size representing the municipalities was established based on the population of the locality (scale of 1 and 15 points, the larger the population, the larger the node). The node color was adjusted considering GDP per capita (the darker the gray hue, the greater the GDP per capita). This color was reflected in the links of each municipality. In turn, for the nodes that represent beneficiaries of the funding commitments, purple and size 1 were attributed, favoring the informative power of the image without diverting the focus from the municipalities.
For links, a filter was established based on values, excluding those less than BRL 10,000 from the network. Three approaches were tested for the maximum limit: no limit, BRL 10 million, and BRL 1 million. As this adjustment was for the link’s value to be reflected by its width, the maximum limit of BRL 1 million was used, with 53% of the giant component remaining in the network. The result is shown in Figure 4.
The three main hubs appear in dark colors due to the higher GDP per capita compared to the other municipalities, especially Brasília. The broad and clear links are noteworthy, which means high values of funding commitments by municipalities with low GDP per capita, some with a small population compared to the others. Considering that the variables population and GDP per capita indirectly capture the latent demand of the municipality for support from the federal government, the analysis of the network as a whole suggests that funding commitments were larger than expected in some locations. Part of these resources was directed to the most common beneficiaries indicating that the distribution of resources may have been influenced by political and private issues rather than by necessity, leading to a greater probability of corruption in these locations.
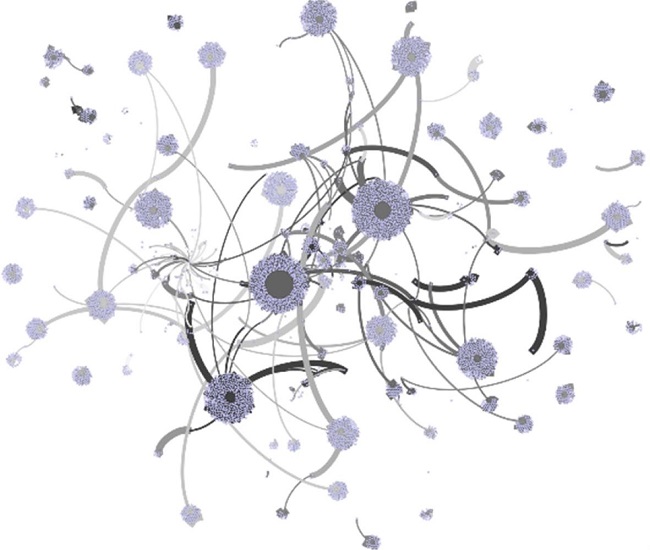
Figure 4
Population and municipal GDP per capita in the giant component
Note: Only links with values between BRL 10,000 and BRL 1 million are presented.Source: Elaborated by the authors.
After analyzing the giant component based on political and socioeconomic variables, it was investigated how the pandemic numbers influenced the execution of the extraordinary budget. The range of value of links (BRL 10,000 to 1 million) was maintained, with its width proportional to the amount committed. This time, all the links have the same shade of black. The size of the nodes representing the municipalities was established based on the accumulated number of new cases of Covid-19 (scale of 1 and 15 points, the higher the number of new cases, the larger the node). The color of these nodes was adjusted based on the cumulative number of deaths in the locality (the more Covid-19 deaths in the municipality, the darker the gray hue). We chose not to use relative values (for example, deaths per thousand inhabitants) since locations with the same indicators would probably not receive the same amount of resources, favoring the one with the highest absolute values. For the nodes that represent those favored by the funding commitments, blue and size 1 were attributed. The result is shown in Figure 5.

Figure 5
COVID-19 new cases and deaths in the giant component
Note: Only links with values between BRL 10,000 and BRL 1 million are presented.Source: Elaborated by the authors.
As expected, the São Paulo hub appears as the largest and darkest node, as it is the largest Brazilian city, naturally with more cases and, consequently, more deaths. However, the Brasília hub appears as the second largest node, but with a light color, indicating fewer deaths than, for example, the Rio de Janeiro hub, the second largest city. Once again, high commitment values (wide links) on the part of municipalities with a low number of cases and deaths by Covid-19 (small and clear nodes) compared to other locations in the network are noteworthy.
The results presented so far show that the study of corruption is a challenging process, which is aggravated when considering that, in general, criminals actively try to hide their activities (Gregori & Merlone, 2020) and that the network they form is not usually explicit (Troncoso & Weber, 2020). Thus, it was decided to segregate the graph using community detection techniques, adjusting the resolution to force the detection of larger communities. Although this process has side effects on modularity, the objective was to find significant interactions in the context under study. After some tests, the adjusted algorithm detected 12 communities with modularity of 0.900, which was considered adequate for the study.
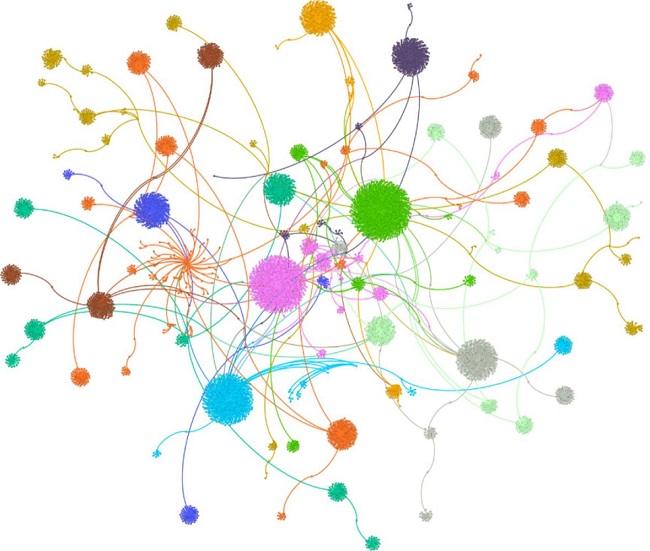
Figure 6
Communities in the giant component
Note: Each community is identified by the color of its nodes and links.Source: Elaborated by the authors.
Once the communities were delimited, the centrality of the nodes within each cluster was calculated. Morselli (2010) and Diviák et al. (2019) clarify that degree and intermediation express the concept of centrality differently and are not necessarily correlated. The authors explain that leaders of criminal networks, when presenting a low degree, tend to hide in the background since having many relationships can be reflected in exposure and vulnerability. In contrast, leaders adopt a position with a high intermediation score. According to Tabassum et al. (2018), nodes with high intermediation scores end up occupying critical roles in a network structure, as they usually hold a position that allows them to function as an interface between groups, being vital elements of interaction.
The 12 communities detected in the giant component can be observed separately in Figure 7, containing the diameter of each community and the degree and centrality of inter1mediation of the key entity of each set (pointed out by the arrows). The key entities are strategically positioned, so they are important channels for the flow of communications in the communities, functioning as “bridges” of information. Furthermore, these entities could connect and mobilize resources from different locations. In addition, these beneficiaries could be considered the most likely points of action for rent-seekers, as such groups act in an organized and simultaneous manner in different locations, often operating as channels for the transfer of material and/or immaterial resources, controlling the flow of information and processes. This hypothesis was not rejected after verifying that many community nodes had zero centrality.
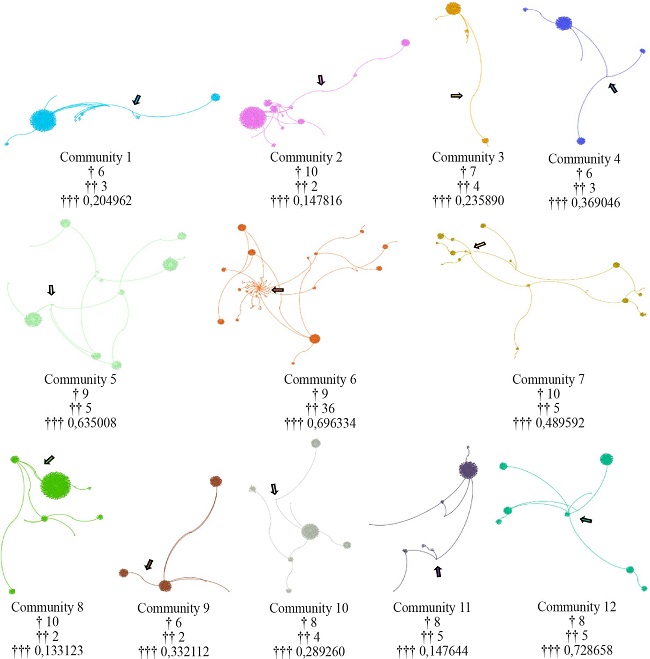
Figure 7
Details of the communities in the giant component
Note: (†) Community diameter. (††), degree and (†††) centrality of intermediation, with values normalized between 0 and 1, of the benefitted with the highest centrality in its community (pointed out by the arrows).Source: Elaborated by the authors
Finally, it was essential to link the results to verify the feasibility of suggesting municipalities that would be more susceptible to corruption and action of rent-seekers during the pandemic. For example, Figure 8 presents an area of the giant component under the different prisms studied. It is possible to notice the existence of two municipalities with mayors from the same party (8.a), both in the second term (8.b). Compared to the other municipalities in the network, a high value of commitment was observed given the reduced GDP per capita (8.c) and the low number of cases and deaths resulting from Covid-19 (8.d). In addition, these two municipalities are part of the same community (8.e), showing the strength of their relationships.
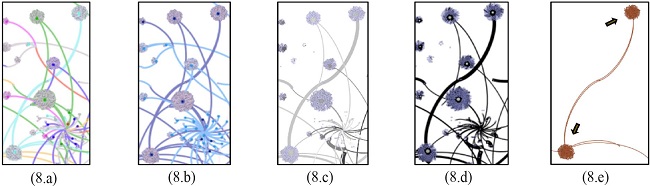
Figure 8
Subgroup with a higher likelihood of corruption acts and operation of rent-seekers
Source: Elaborated by the authors.
The approach adopted proved to be a tool capable of contributing to the identification of municipalities most susceptible to corruption and action of rent-seekers. The initial intuition that each relationship constitutes a single piece of information in a larger system was confirmed. The diagramming of budget data in graphs revealed a little-explored version of public procurement linked to coping with the pandemic. Furthermore, by allowing the user to decide which perspective best describes their problems, the SNA helped to reveal connections that would likely go unnoticed in traditional analyses, reflecting this technique’s potential in creating insights for investigating, monitoring, and controlling municipal corruption.
5 FINAL CONSIDERATIONS
Through Social Network Analysis, this study aimed to study the provisional measures issued by the Brazilian federal executive branch that opened extraordinary credits in the 2020 budget to face the Covid-19 pandemic. The research processed and analyzed budget execution data to find possible signs of corruption in Brazilian municipalities. It was concluded that the social network technique could help forensic investigations related to corruption and actions of rent-seekers, including during emergencies such as the Covid-19 pandemic. This technique offers relational perspectives that lead to investigative insights that traditional research models probably cannot achieve.
Several questions remain, which is a characteristic of exploratory studies. These questions help to clarify some of the limitations of this research. First, data from budget action 21C0 were used, which represents only part of the resources destined to combat the pandemic. Second, four variables were used to analyze corruption that can be considered “suggestive” (Gallego et al., 2020) since only the judicial system would, in theory, be able to unequivocally establish the practice of corruption (Nikolova & Marinov, 2017). Third, the number of new cases and deaths from Covid-19 is the subject of constant questioning by society, whether data comes from official sources or not. Fourth, using data from all Brazilian municipalities led to great variability, making it difficult to standardize and visualize the networks. Fifth, part of the SNA is visual, and the findings presented here are biased by the authors’ interpretation. The authors sought to associate the method, the literature on corruption, and the budgetary context.
These limitations do not lead to the devaluation of the SNA as a paradigm for studying criminal networks. On the contrary, they offer suggestions for future research that may include data from the 2021 budget execution and add analysis of dynamic networks, realizing how nodes and links arise, which can enhance the findings. It is almost certain that the network has reorganized itself with the entry and exit of municipalities and beneficiaries, possibly expanding the role of rent-seeker groups. The temporal factor related to new Covid-19 cases and deaths can also be explored to isolate this effect. Another suggestion is to incorporate traditional mathematical approaches that can be confronted with the findings. Finally, the conclusions of this research can be compared with the results of future inspections to be carried out by control agencies to confirm or refute the SNA’s performance in detecting signs of corruption.
As a contribution, the effort to bring theory and practice stands out since concepts and techniques were discussed in a real and timely scenario. In addition, software for data analysis and computerized systems are usually within reach of researchers. However, the greatest difficulty is not in how to use them but for what purpose to use them, i.e., what is the research contribution.
Finally, guiding actions in the area of public security through decision-making systems that indicate the most likely scenarios for the occurrence of crimes can help to allocate public resources more efficiently. Understanding public procurement networks and studying the structure of corruption can open new horizons for public policies in favor of society. Although there is extensive literature on policies in the area of public security, this research sought to expand empirical analyses in a time of pandemic, collaborating with a current theme and encouraging the search for answers to the scenario that afflicts everyone and is likely to occur in the future.
REFERENCES
Amani, F. A., & Fadlalla, A. M. (2017). Data mining applications in accounting: A review of the literature and organizing framework. International Journal of Accounting Information Systems, 24, 32-58. https://doi.org/10.1016/j.accinf.2016.12.004
Amaral, L. S., Gomes, D. A., Oliveira, A. C. F. M., Oliveira, M. G. F. M., Nunes, J. E. O., Silva, M. M. L., Cordeiro, N. M., Santiago, E. J. P., Santos, A. L. P., & Moreira, G. R. (2020). Cluster analysis involving the world corruption perception index: An approach applied to South America. Research, Society and Development, 9(7). https://doi.org/10.33448/rsd-v9i7.4471
Anessi-Pessina, E., Barbera, C., Langella, C., Manes-Rossi, F., Sancino, A., Sicilia, M., & Steccolini, I. (2020). Reconsidering public budgeting after the Covid-19 outbreak: key lessons and future challenges. Journal of Public Budgeting, Accounting & Financial Management, 32(5), 957-965. https://doi.org/10.1108/JPBAFM-07-2020-0115
Aranha, C. E., Rossoni, L. & Silva, W. M. (2016). Capital Social do Conselho de Administração e desempenho de empresas de capital aberto brasileiras. Revista de Administração Mackenzie, 17(1), 15-39. https://doi.org/10.1590/1678-69712016/administracao.v17n1p15-39
Aridhi, S., & Nguifo, E. M. (2016). Big Graph Mining, Frameworks and Techniques. Big Data Research, 6, 1-10. https://doi.org/10.1016/j.bdr.2016.07.002
Avis, E., Ferraz, C., & Finan, F. (2018). Do Government Audits Reduce Corruption? Estimating the Impacts of Exposing Corrupt Politicians. Journal of Political Economy, 126(5), 1912-1964. https://doi.org/10.1086/699209
Barabási, A-L. (2016). Network Science. Cambridge University Press.
Barbosa Neto, J. E., Higgins, S. S. S., Cunha, J. V. A. & Ribeiro, A. C. (2016). Capital Social e seletividade em redes de coautoria acadêmica: o caso das ciências contábeis no Brasil. Brazilian Business Review, 13(6), 239-269. https://doi.org/10.15728/bbr.2016.13.6.4
Bastian, M., Heymann, S., & Jacomy, M. (2009). Gephi: an open source software for exploring and manipulating networks. International AAAI Conference on Weblogs and Social Media. Retrieved from: https://gephi.org/publications/gephi-bastian-feb09.pdf
Becker, G. S. (1968). Crime and Punishment: An Economic Approach. Journal of Political Economy, 76(2), 169-217. Retrieved from: http://www.jstor.org/stable/1830482
Carraro, A., Machado, Isis B., Canever, Mário D., & Boll, José L. S. (2015). Proposta para a estimação da corrupção regional no Brasil. Política & Sociedade, 14(31), 326-352. https://dx.doi.org/10.5007/2175-7984.2015v14n31p326
Chang, Z. (2018). Understanding the Corruption Networks Revealed in the Current Chinese Anti-corruption Campaign: A Social Network Approach. Journal of Contemporary China, 27(113), 735-747. https://doi.org/10.1080/10670564.2018.1458060
Cherven, K. (2015). Mastering Gephi Network Visualization: produce advanced network graphs in Gephi and gain valuable insights into your network datasets. Packt Publishing Ltd.
Colliri, T., & Zhao, L. (2019). Analyzing the Bills-Voting Dynamics and Predicting Corruption-Convictions Among Brazilian Congressmen Through Temporal Networks. Scientific Reports, 9. https://doi.org/10.1038/s41598-019-53252-9
Diviák, T., Dijkstra, J. K., Snijders, T. A. B. (2019). Structure, multiplexity, and centrality in a corruption network: the Czech Rath affair. Trends in Organized Crime, 22, 274-297. https://doi.org/10.1007/s12117-018-9334-y
Fayyad, U., Piatetsky-Shapiro, G., & Smyth, P. (1996). From Data Mining to Knowledge Discovery in Databases. AI Magazine, 17(3), 37-54. https://doi.org/10.1609/aimag.v17i3.1230
Fazekas, M., & Tóth, István J. (2016). From Corruption to State Capture: A New Analytical Framework with Empirical Applications from Hungary. Political Research Quartely, 69(2), 320-334. https://doi.org/10.1177/1065912916639137
Ferraz, C., & Finan, F. (2011). Electoral accountability and corruption: evidence from the audits of local governments. American Economic Review, 101, 1274-1311. https://doi.org/10.1257/aer.101.4.1274
Gallego, J., Prem, M., & Vargas, J. F. (2020). Corruption in the Times of Pandemia. https://papers.ssrn.com/sol3/papers.cfm?abstract_id=3600572
Garrett, T. A., & Sobel, R. S. (2003), The Political Economy of FEMA Disaster Payments. Economic Inquiry, 41(3), 496-509. https://doi.org/10.1093/ei/cbg023
Gregori, M., & Merlone, U. (2020). Comparing operational terrorist networks. Trends in Organized Crime. https://doi.org/10.1007/s12117-020-09381-z
Hauser, C. (2018). Fighting Against Corruption: Does anti-corruption Training Make Any Difference? Journal of Business Ethics, 159, 281-299. https://doi.org/10.1007/s10551-018-3808-3
Kacanski, S. & Lusher, D. (2017). The Application of Social Network Analysis to Accounting and Auditing. International Journal of Academic Research in Accounting, Finance and Management Sciences, 7(3), 182-197. https://doi.org/10.6007/IJARAFMS/v7-i3/3286
Kaufmann, D., Kraay, A., & Mastruzzi, M. (2010). The worldwide governance indicators: methodology and analytical issues. World Bank Policy Research Working Paper No. 5430. http://documents1.worldbank.org/curated/ar/630421468336563314/pdf/WPS5430.pdf
Leeson, P. T., & Sobel, R. S. (2008). Weathering Corruption. The Journal of Law & Economics, 51(4), 667-681. https://doi.org/10.1086/590129
Luna-Pla, I., & Nicolás-Carlock, J. R. (2020). Corruption and complexity: a scientific framework for the analysis of corruption networks. Applied Network Science, 5(13), 1-18. https://doi.org/10.1007/s41109-020-00258-2
Mauro, P., Medas, P., & Fournier, J. (2019). The cost of corruption. Finance & Development, 56(3), 26-29. https://www.imf.org/external/pubs/ft/fandd/2019/09/the-true-cost-of-global-corruption-mauro.htm
Martínez-Plumed, F., Contreras-Ochando, L., Ferri, C., Hernández Orallo, J., Kull, M., Lachiche, N., & Flach, P. A. (2019). CRISP-DM Twenty Years Later: From Data Mining Processes to Data Science Trajectories. IEEE Transactions on Knowledge and Data Engineering. https://doi.org/10.1109/TKDE.2019.2962680
Miller, J. M., & Blumstein, A. (2020). Crime, Justice & the Covid-19 Pandemic: Toward a National Research Agenda. American Journal of Criminal Justice, 45, 515-524. https://doi.org/10.1007/s12103-020-09555-z
Morselli, Carlo (2010). Assessing Vulnerable and Strategic Positions in a Criminal Network. Journal of Contemporary Criminal Justice, 26(4), 382-392. https://doi.org/10.1177/1043986210377105
Nikolova, E., & Marinov, N. (2017). Do Public Fund Windfalls Increase Corruption? Evidence From a Natural Disaster. Comparative Political Studies, 50(11), 1455-1488. https://doi.org/10.1177/0010414016679109
Nye, J. S. (1967). Corruption and Political Development: a cost-benefit analysis. The American Political Science Review, 61(2), 417-427. https://doi.org/10.2307/1953254
Payne, B. K. (2020). Criminals Work from Home during Pandemics Too: a Public Health Approach to Respond to Fraud and Crimes against those 50 and above. American Journal of Criminal Justice. https://doi.org/10.1007/s12103-020-09532-6
Rehman, S. U., Khan, A. U., & Fong, S. (2012). Graph mining: A survey of graph mining techniques. Seventh International Conference on Digital Information Management (ICDIM 2012), 88-92. https://doi.org/10.1109/ICDIM.2012.6360146
Resende, C. A. S. (2020). Análise de redes sociais: o método e sua utilização nas Ciências Sociais brasileiras. Ciências Sociais Unisinos, 56(1), 94-103. https://doi.org/10.4013/csu.2020.56.1.09
Ribeiro, H. C. M. (2014). Corporate governance versus corporate governance: an international review: uma análise comparativa da produção acadêmica do tema governança corporativa. Revista Contemporânea de Contabilidade, 11(23), 95-116. https://doi.org/10.5007/2175-8069.2014v11n23p95
Ribeiro, F., & Colauto, R. D. (2016). A Relação entre Board Interlocking e as Práticas de Suavização de Resultados. Revista Contabilidade & Finanças, 27(70), 55-66. https://doi.org/10.1590/1808-057x201501320
Robins, G. (2015). Doing Social Network Research: network-based research design for social scientists. Sage.
Santos, Marlon O. C. (2019). Corrupção política: a possibilidade de enquadramento da mercancia da influência política nos crimes de corrupção passiva e ativa. Revista Brasileira de Ciências Policiais, 10(1), 171-212. http://dx.doi.org/10.31412%2Frbcp.v10i1.630
Shafique, U., & Qaiser, H. (2014). A comparative study of data mining process models (KDD, CRISP-DM and SEMMA). International Journal of Innovation and Scientific Research, 12(1), 217-222.
Sheptycki, J. (2020). The politics of policing a pandemic panic. Australian & New Zealand Journal of Criminology, 53(2), 157-173. https://doi.org/10.1177/0004865820925861
Sodré, A., & Alves, M. (2010). Relação entre emendas parlamentares e corrupção municipal no Brasil: estudo dos relatórios do Programa de Fiscalização da Controladoria-Geral da União. Revista de Administração Contemporânea, 14(3), 414-433. https://doi.org/10.1590/S1415-65552010000300003
Stickle, B., & Felson, M. (2020). Crime Rates in a Pandemic: The Largest Criminological Experiment in History. American Journal of Criminal Justice, 45, 525-536. https://doi.org/10.1007/s12103-020-09546-0
Svensson, J. (2000). Foreign aid and rent-seeking. Journal of International Economics, 51(2), 437-461. https://doi.org/10.1016/S0022-1996(99)00014-8
Tabassum, S., Pereira, F., Fernandes, S., & Gama, J. (2018). Social network analysis: An overview. Wiley Interdisciplinary Reviews: Data Mining and Knowledge Discovery, 8, 1-21. https://doi.org/10.1002/widm.1256
Troncoso, F., & Weber, R. (2020). A novel approach to detect associations in criminal networks. Decision Support Systems, 128, 1-10. https://doi.org/10.1016/j.dss.2019.113159
Yamamura, E. (2014). Impact of natural disaster on public sector corruption. Public Choice, 161, 385-405. https://doi.org/10.1007/s11127-014-0154-6
Wasserman, S., & Faust, K. (1994). Social network analysis: methods and applications. Cambridge University Press.
Notes
Author notes
The findings reveal investigative insights that can contribute to the identification of municipalities most susceptible to corruption. They may guide monitoring and control activities and improve the decision-making process in public security and financial intelligence agencies.
Corresponding author: Tel. +55 (61) 2024-9766, E-mail: rafaellima1515@gmail.com (R. S. Lima); andrelms.unb@gmail.com (A. L. M. Serrano), Universidade de Brasília. Campus Universitário Darcy Ribeiro - Brasília/DF - 70910-900, Brazil