Article
Do politics and administration affect innovation performance? A comparative analysis
¿La política y la administración afectan el desempeño de la innovación? Un análisis comparativo
A política e a administração afetam o desempenho da inovação? Uma análise comparativa
 Pedro Luiz Costa Cavalcante cavalcante.pedro@gmail.com
Do politics and administration affect innovation performance? A comparative analysis
Revista de Administração Pública, vol. 57, no. 2, e2022-0204, 2023
Fundação Getulio Vargas
Received: 05 July 2022
Accepted: 24 January 2023
Abstract: The paper’s primary goal is to analyze the effects of politics and administrative capacity on countries’ innovative performance. The inquiry comparatively examines possible correlations between democracy, political competition, income inequality, bureaucratic capacity, and corruption/transparency with countries’ innovation results. The dependent variables are three performance indicators of the Global Innovation Indexes (GII). After presenting the theory and the descriptive data analysis on the research variables, the paper runs multivariate regression models to test the hypotheses. The empirical analysis reinforced that political and administrative dimensions are relevant to understanding the national innovation systems’ achievements. However, democracy, bureaucracy quality and corruption/transparency are not influential factors in countries’ innovative results as the normative assumptions would suppose. On the contrary, political competition and inequality considerably impact how economies innovate. In conclusion, the paper brought original and intriguing findings that put in perspective the claim that there is a unique path or rule of thumb for innovation growth. Consequently, the inferences provide insights to scholars and stakeholders, public and private, to improve the debates and decisions regarding the priorities for government actions in times of evidence-based policymaking.
Keywords: Political system, administrative capacity, inequality, innovation performance, comparative analysis.
Resumen: El objetivo principal del documento es analizar los efectos de la política y la capacidad administrativa en el desempeño innovador de los países. La investigación examina comparativamente las posibles correlaciones entre democracia, competencia política, desigualdad de ingresos, capacidad burocrática y corrupción/transparencia con los resultados de innovación de los países. Las variables dependientes son tres indicadores de desempeño de los Índices Globales de Innovación (GII). Después de presentar la teoría y el análisis descriptivo de los datos sobre las variables de investigación, el documento ejecuta modelos de regresión multivariados para probar las hipótesis. El análisis empírico reforzó que las dimensiones política y administrativa son relevantes para comprender los logros de los sistemas nacionales de innovación. Sin embargo, la democracia, la calidad de la burocracia y la corrupción/transparencia no son factores influyentes en los resultados innovadores de los países como lo supondrían los supuestos normativos. Por el contrario, la competencia política y la desigualdad afectan considerablemente la forma en que las economías están innovando. En conclusión, el documento presentó hallazgos originales e interesantes que pusieron en perspectiva la afirmación de que existe un camino único o regla general para el crecimiento de la innovación. En consecuencia, las inferencias brindan información a académicos y partes interesadas, públicas y privadas, para mejorar los debates y las decisiones sobre las prioridades de las acciones gubernamentales en tiempos de formulación de políticas basadas en evidencia.
Palabras clave: Sistema político, capacidad administrativa, desigualdad, rendimiento de la innovación, análisis comparativo.
Resumo: O objetivo principal do artigo é analisar os efeitos da política e da capacidade administrativa sobre o desempenho inovador dos países. A pesquisa examina comparativamente possíveis correlações entre democracia, competição política, desigualdade de renda, capacidade burocrática e corrupção/transparência com os resultados de inovação dos países. As variáveis dependentes são três indicadores de desempenho dos Índices de Inovação Global (GII). Após apresentar a teoria e a análise descritiva dos dados das variáveis da pesquisa, o trabalho emprega modelos de regressão multivariada para testar as hipóteses. A análise empírica reforçou que as dimensões política e administrativa são relevantes para entender as realizações dos sistemas nacionais de inovação. No entanto, democracia, qualidade da burocracia e corrupção/transparência não são fatores influentes nas performances inovadoras dos países como supõem os pressupostos normativos. Por outro lado, a competição política e a desigualdade impactam consideravelmente a forma como as economias estão inovando. Em conclusão, o artigo trouxe descobertas originais e interessantes que colocam em perspectiva a afirmação de que existe um caminho único ou regra geral para o crescimento da inovação. Consequentemente, as inferências fornecem subsídios para acadêmicos e atores envolvidos, públicos e privados, para melhorar os debates e decisões sobre as prioridades das ações governamentais em tempos de formulação de políticas baseadas em evidências.
Palavras-chave: Sistema político, capacidade administrativa, desigualdade, desempenho de inovação, análise comparativa.
1. INTRODUCTION
Innovation growth, meaning the capacity of a country or region to progressively develop new products, services, processes, or business models put into use, commercially or non-commercially (Edler & Fagerberg, 2017), is considered an economic driver to prosperity and to improve citizen’s welfare (Castellacci & Natera, 2013; Cirera & Maloney, 2017; Kattel & Mazzucatto, 2018; World Bank, 2010). Thus, innovation has been increasingly part of the public sector’s priority agenda to achieve economic growth and competitiveness and to address societal challenges, for instance, the unprecedented COVID-19 pandemic and its several implications.
Another consensus resides in the fact that building a national innovation system (NIS) capable of producing and commercializing a flow of innovative technology over the long term is a challenging task (Castellacci & Natera, 2013). A comprehensive and accurate understanding of how countries structure their NIS encompasses key dimensions of analysis, such as the labor market, education system, financial institutions, regulatory structures, and other institutions that constantly shape the economic dynamics. In short, the National Innovation System is multidimensional in which innovation capabilities are structured, and the level of accomplishment may be influenced by a variety of other factors, such as historical experience, geopolitical position, language, and culture (Iootty, 2019; Lundvall, 2016; Lundvall, Joseph, Chaminade, & Vang, 2009).
In this context, the bulk of the literature focuses on the study of the effects of innovation on development (Cimoli, Dosi, Nelson, & Stiglitz, 2009; Lin, 2012) or the description of the innovation systems and the explanation of their achievement based on economic and technological factors (Castellacci & Natera, 2013; Edler & Fagerberg, 2017; Lundvall, 2010; Lundvall et al., 2009; Radosevic & Yoruk, 2017). On the other hand, less attention has been paid to the nation’s political and administrative characteristics that also can affect their innovation performance, despite the consensus regarding the multidimensionality of NIS.
It seems essential to comprehend why few economies worldwide have better results in the innovation field than the majority. Why were some nations able to structure a mature governance arrangement with well-functioning institutions, policies, and actors’ interactions, while in most countries, systemic failure prevails? In other words, the situation in which the economy lacks the fundamental building blocks that can support the creation, absorption, use, and dissemination of valuable knowledge through interactive learning (Lundvall et al., 2009). In this sense, despite the well-known potential returns to innovation, most governments in emerging nations cannot formulate and implement policies properly and build an institutional environment to reach high-tech or industrial economic development, which is called the innovation paradox (Cirera, Frías, Justin, & Yanchao, 2020; Cirera & Maloney, 2017).
So, if policies are essential to building economies’ innovation growth and dependent on political and administrative arrangements (Cirera et al., 2020; Cirera & Maloney, 2017; Kattel & Mazucatto, 2018; Organisation for Economic Cooperation and Development [OECD], 2015; World Bank, 2010), the research problem is what are the effects of these dimensions on nation’s innovative performance. Then, some crucial questions emerge. Does the democracy level affect countries’ innovation outputs? Can a high level of political competition or income inequality affect how the economy achieves innovation growth? Does bureaucratic capacity reflect better innovative results? Are corruption and transparency in the public administration influential in improving economies’ innovation performance? To address these questions, the paper’s main goal is to analyze the effects of politics and administrative capacity on countries’ innovative performance.
To do so, the inquiry comparatively analyzes these possible correlations encompassing countries from every region. The dependent variables are the Global Innovation Indexes (GII), composite indicators that rank how the countries produce innovative knowledge and creative outputs (Dutta, Lanvin, & Wunsch-Vincent, 2020). First, descriptive data analysis on the independent variables is presented. Then, the paper runs multivariate regression models to test how politics and administrative variables affect the economies’ performance.
The research contributes to the innovation and political economy fields of study by presenting original and intriguing insights regarding why some economies overcame structural barriers to improve their innovation outputs. At the same time, most still struggle with underperformance issues. In short, empirical analysis reinforced that political and administrative dimensions are relevant to understanding national innovation system achievements; however, democracy and bureaucracy quality are not influential factors on countries’ innovative results as the normative assumption would suppose. In contrast, political competition and inequality considerably impact how economies are innovating.
Besides this introduction, the paper has three other sections. The next briefly reviews the theoretical grounds regarding innovation performance and some of its determinants. The third section discusses how the dependent and exploratory variables were measured, the research hypotheses, and the empirical results were analyzed. Lastly, conclusions, research limitations, and future agenda are presented.
2. THEORETICAL DISCUSSION
The National Innovation System (NIS) literature is openly skeptical, with government interference restricted to market failure. The innovation ecosystem is an arrangement of interactions between firms and entrepreneurs with bounded rationality and institutions in constant evolution. In this approach, as public policies and programs are not only an essential part of the engine but inevitably (Mazzucato, 2013; Nelson, 2016), governments must plan, design, and implement innovation initiatives systematically and dynamically (Cirera & Maloney, 2017).
Mature innovation systems rely on the capacity to build an institutional framework for innovation encompassing government and policy coordination, ST&I strategies and national plans, public/private and university/business relations, and promotion of private entrepreneurship (Lundvall et al., 2010). Governments, therefore, are key players in nurturing the necessary institutions, monitoring the interactive process, and intervening to redress systemic failures where necessary (Word Bank, 2010). Cirera and Maloney (2017) explore the innovation paradox present in most developing countries in this context. In a nutshell, it is the situation in nations with great market failures to be faced a variety of missing complementary factors and institutions that increase the complexity of innovation policy. Meanwhile, governments have weak capabilities to design, implement, and coordinate a robust policy mix to deal with it. In fact, it is not restricted to some irrationality of firms and governments but due to structural factors that provoke this innovation policy dilemma.
There is no simple solution to this governance dilemma in this scenario of high levels of complexity and weak government capabilities to cope with it. It is increasing consensus on the limits of importing good practices from abroad; however, it is possible to extract some policy design lessons that may result in successful government interventions. The path is to improve the diagnostic, design, and execution capabilities of the government (Cirera et al., 2020; Cirera & Maloney, 2017), focusing on four critical dimensions of sound innovation policymaking: rationale and design of policy; efficacy of implementation; the coherence of policies across the NIS and policy consistency and predictability over time.
In this sense, considering the roles of the public sector and policies to the national systems to comprehend their structure or governance arrangement, deepening the political and administrative effects on the NIS’s performance is a fertile and promising field of study. In addition, this approach is relevant because innovation is a multifaceted process that depends not only on epochs but also on various factors, including nations’ particularities (Cozzens & Kaplinsky, 2009).
One political dimension is democracy, which has been vastly analyzed as an influential factor in explaining economic growth, development, welfare, etc. (Haggard & Kaufman, 2008; Przeworski, Alvarez, Cheibub, & Limongi, 2000), although the focus on innovation performance is still scarce (Gao, Zang, Roth, & Wang, 2017). The assumption behind this relation is that in democratic systems, information tends to flow freely, leading to a more dynamic interaction of knowledge and the learning process, which is vital for the innovation system to prosper (Lundvall, 2010). A vibrant representative democracy seems even more important in the increasing context of collaborative governance. Public leaders and entrepreneurs may foster universities, government, and industry networks, well known triple helix model, to boost innovation capacity in the economy (Etzkowitz, 2008).
On the other hand, in a pluralistic democracy context, corporations and businesses can be influential in electoral financing and, subsequently, in lobbying for government decisions on investments and tax incentives, leading to rent-seeking policies, which were very recurrent in the old Latin American experience of import substitution development model (Cimoli et al., 2009). Some qualitative and historical studies found a connection between democracy, innovation, and favorable policies to increase the success rate of innovation (Lundvall & Borrás, 2006; Ober, 2008). However, this correlation is not unanimous. Gao et al. (2017) tested the effects of democracy on innovation, using the difference-in-differences method on panel data from over one hundred countries, and concluded that there was no direct positive impact. However, as the authors claim, the finding must be taken with caution because countries’ innovation performance was restricted to patent applications.
Another political variable commonly used to measure its efforts on policy outputs, economic growth, and government performance, among others, is political competition. Besley, Persson, and Sturm (2010) found evidence that a lack of political competition in a state is associated with anti-growth policies. In contrast, Pinto and Timmons (2005) focused on the political competition effects on the sources of growth and demonstrated that it impacts the rate of human capital accumulation and productivity change. In the innovation field of study, Paik, Kang, and Seamans (2017) showed that political competition could pressure regulators to weigh the public welfare more heavily and undertake measures that facilitate entrepreneurial entry in the ridesharing business. Lastly, Deng, You, and Wang (2019) argue that competition in politics impacts enterprises’ optimal level of green technology innovation and indirectly affects it by influencing the optimal investment ratio of environmental governance.
In sum, the core premise is that elected officials dealing with or expecting to face high political competition levels would have incentives to work harder in policymaking to build a reputation for themselves or the party to secure votes to continue in office (Besley & Case, 1995). Therefore, political competition functions as an accountability mechanism. In some sense, how threatened and worried the incumbent party should feel about losing the next election tends to influence their willingness to build state capacity to design, implement, and coordinate a compelling innovation policy mix.
The third political variable affecting innovation performance is inequality, which is usually analyzed in development studies but seldom in the innovation literature (Cozzens, 2008; Tselios, 2011). Despite the common sense that associate’s wealth and income inequality as a restricted economic issue, it is worth mentioning that it is also a political problem in nature (Piketty, 2014). Nonetheless, there is yet to be a consensus since it also depends on how inequality and innovation are measured, and the theoretical mechanisms employed in the analysis. For instance, if the focus is on household income, high inequality may negatively affect consumption and, consequently, the demand for innovative products and services. At the same time, the uneven distribution of skilled workers can imply a concentration of innovation capabilities in a country or region that can foster its firms’ innovative performance (Cozzens & Kaplinsky, 2009). Finally, Tselios (2011), based on panel data to test the relationship between patents (a proxy for innovation) and income inequality in European Union (EU), finds that given existing levels of income inequality, an increase in a region’s inequality favors innovation. In short, this paper will explore whether inequality can benefit innovation or harm it.
The second dimension involves countries’ administrative features. Building an accurate diagnosis of market failures and designing and implementing coherent and effective innovation policy mixes (instruments and funding) on different fronts of the NIS are pivotal to achieving better innovative performance (Cirera et al., 2020; Cirera & Maloney, 2017; Kattel & Mazucatto, 2018; OECD, 2015; World Bank, 2010). The quality of the bureaucracy or the bureaucratic capacity stands out as a key factor in this causal mechanism. It is worth mentioning that the word bureaucracy has different means. In this paper, bureaucracy refers to the state’s permanent personnel, namely non-elected government agents, career members, or not. It is one of the institutional pillars for the efficient functioning of public services, the democratic system, and the rule of law enforcement. It enables continuity, coherence, and relevance in policies and reassures greater impartiality and objectivity to a public authority (Stein, Tommasi, Echebarria, Lora, & Payne, 2006). On the other hand, its fragility may lead to government failures, such as ineffectiveness and misuse of public resources.
In a seminal work, Evans and Rauch (1999) analyze bureaucratic professionalization and the economic growth of 35 developing nations between 1970 and 1990. The results indicate a strong correlation between bureaucracy’s capacity and higher Gross Domestic Product (GDP) growth rates, especially in the so-called Asian Tiger nations and a few Latin American countries, e.g., Brazil and Chile. The assumption is that public careers grounded in autonomy and meritocratic procedures adopt impersonal and inflexible career admission and advancement rules. Stability, continued training, and adequate wage tend to reflect on a public service capable of diagnosing societal problems and framing policy alternatives to deal with them, with lower chances of rent-seeking, capture, or clientelism (Skocpol, 1985).
Regarding the innovation system, Kattel and Mazzucato (2018) support the need for dynamic administrative capacities. They rely on the public bureaucracy’s diversity of expertise and skills to change from the existing and limited support-and-measure approach to the lead-and-learn approach of innovation policymaking. Suzuki and Demircioglu (2019) tested the effects of bureaucracy’s professionalization and impartially on national levels of innovative activity worldwide and found positive results. Nonetheless, the administrative designs in samples restricted to OECD member countries don’t matter to these nations’ innovation performance.
Another aspect of countries’ administrative dimension is transparency, a broad and diversified term known as a catchword in the economic-political debate (Forssbæck & Oxelheim, 2015). In short, transparency means the degree of openness, clarity and accessibility, and communication of credible information that governments provide in their decision-making processes and policy outcomes. The rationale is that countries with more transparency tend to be held more accountable, and predictable to society and economic agents. Consequently, generate efficient policies and institutions with positive effects, for instance, on economic growth. Focusing on analyzing the open government data (OGD), Reggi and Dawes (2016) highlighted the expectation that transparency will result in multiple public benefits: economic and social innovation, civic participation, and public-private collaboration. However, it is not always the case. Deogirikar (2014) tested if participation in the Open Government Partnership (OGP) would positively affect countries’ innovation (measured by the number of annual patents), but the statistical results refuted the hypothesis. On the contrary, Brown and Martinsson (2018) found that a more transparent information environment is associated with higher R&D investments and patents.
Transparency can be analyzed with corruption, a notorious factor that may affect both private and public sectors. However, there is also no consensus in the literature; while some argue that corruption can boost innovation, others see it as a barrier (Acemoglu & Verdier, 2000; Mahagaonkar, 2008; Veracierto, 2008). In the former view, corruption may increase transaction costs, investment barriers, and uncertainty, which hinder entrepreneurs from engaging in innovative activities and, subsequently, impact lower growth for the whole economy. The facilitator’s perspective supports that corruption may contribute to innovation by allowing enterprise initiatives to bypass dysfunctional institutional systems, characterized bureaucratic obstacles, inefficient public administrative procedures, and legislation rigidity. Wen, Zheng, Feng, Chen, and Chang (2020) investigated this relation, using annual data for 29 OECD countries from 1996-2013, and demonstrated that a nation less corrupt tends to have a better innovation performance (also measured by Patent and Trademark Applications). Nonetheless, the finding only fits those with low corruption levels and high-standard anti-corruption policies. The correlation is not significant in nations with corrupt governments with low bureaucratic quality.
More recently, a new field of study has focused on how political uncertainty affects the innovation system differently. Atanassov, Julio, and Leng (2015) analyzed the relationship between political uncertainty in the US gubernatorial elections and R&D investment and found that uncertainty is only effective in hotly contested elections, politically sensitive, and hard-to-innovate industries. Regarding China, Sun, Zeng, Zhang, Wu, and Shi (2022) confirms a positive correlation between mayors’ replacement and firm innovation, while Jiang, Wang, Feng, and Yi (2021) reveal that local officials’ turnover has a direct negative effect on both R&D investment leap and corporate innovation performance. Other sources of uncertainty - leaders’ education levels and political regimes (i.e., presidential vs. parliamentary), are also tested on patent applications by Pertuze, Reyes, Vassolo, and Olivares (2019), and the empirical results indicate that both factors have a significant impact on innovation.
3. DO POLITICS AND ADMINISTRATION AFFECT INNOVATION PERFORMANCE?
3.1. Data, hypotheses, and methods
The correlation between countries’ political-administrative characteristics and their innovation systems’ performance is still a fertile field, aiming for robust empirical evidence and valid inferences. One way of reaching them is by comparing a considerable number of observations and using quantitative variables that precisely depict how countries are in these analytical dimensions. According to David Collier (1993, p. 5), “comparison is a fundamental instrument of analysis, as it expands our power of description and plays a central role in the conceptual formation, bringing the focus on suggested similarities and contrasts between cases.” The nation’s selection criteria fit within a homogeneity space that can be considered constant in the analysis (Mahoney & Goertz, 2006). The countries from all five continents have different stages of development that are measured by a distinguished set of indicators regarding their political and administrative features and indexes of their economies’ innovation performance, this paper’s dependent variable.
To portray innovative performance, the inquiry uses the Global Innovation Index (GII), a joint partnership led by Cornell University, Institut Européen d’Administration des Affaires (INSEAD), and the World Intellectual Property Organization (WIPO), which, since 2013, published an annual ranking with around 130 countries/economies. The GII encompasses eighty (80) single and composite indicators from different sources1. The following figuredepicts the index, sub-indexes, and main indicators.
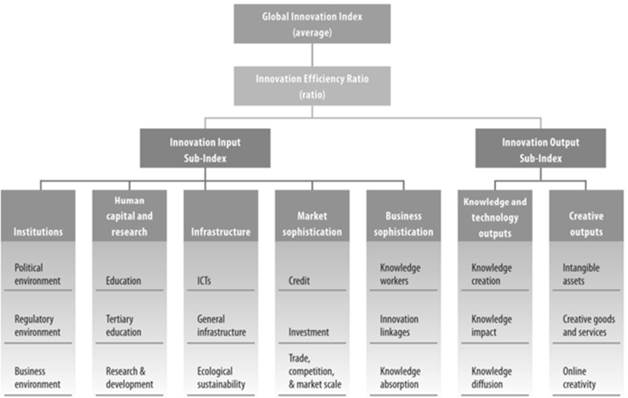
Countries’ innovation performance consists of the Innovation Output Sub-Index, meaning the results from the innovation activities within the economy (Innovation Input Sub-indexes) and is calculated based on the average of the following two pillars or indicators (Dutta et al., 2020):
-
. Knowledge and technology outputs (KTO): covering variables that are results of inventions and innovations, including the sub-pillars of knowledge creation, knowledge impact, and knowledge diffusion.
-
. Creative outputs (CO): to encompass the NIS’s dimension of creativity, the pillar has three sub-pillars: intangible assets, creative goods and services, and online creativity.
It is worth mentioning that the GII output and its two pillars include a much broader measure of how the economies achieve innovative results than simply focusing on R&D investments or patent applications, the commonly used variables in the literature. In short, KTO and CTO encompass almost twenty-seven (27) different variables from different well-known international sources2.
How the countries performed in the innovation field is shown in Figure 2. The distribution is based on the economies’ average of the GII outputs indexes from 2019 to 2021. For illustration purposes, the four groups were divided based on ½ of their standard deviation: the darker the country’s color, the poorest its performance.
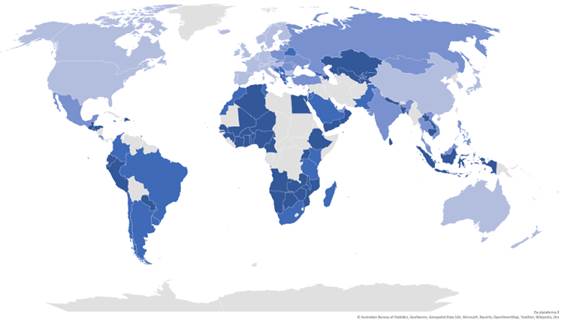
Figure 2
The GII output index distribution (2019-2021)
Source: Dutta et al. (2019, 2020) and Dutta, Lanvin, León, and Wunsch-Vincent (2021).
Undoubtedly, the heterogeneity among the economies is the rule, and the regional cohort does not seem to be a consistent factor in explaining these different patterns. Europe, North America, Oceania, the so-called Asian Tigers (Hong Kong, Singapore, and South Korea), and China are the top innovators.3. The second group of countries (Mid to Top) are composed of former communist countries in Eastern Europe and emerging Southeast Asia (Vietnam, Malaysia, and the Philippines). The following (Lower to Mid) are mainly from Latin America, the Middle East, and the Balkans, especially from the former Yugoslavia4. Finally, the ones at the bottom in this ranking are the major group of countries and are spread all over the planet. Nonetheless, most come from Africa and Latin America5. European (Albania) and Asian (Cambodia, Lao, and Indonesia) also share poor performances.
Drawing from the theoretical discussion of the previous section, now the inquiry presents the six variables to be considered as explanatory factors of economies’ innovative results: i) democratization degree; ii) political competition; iii) income inequality; iv) bureaucratic professionalism; v) bureaucratic impartiality capacity; vi) transparency and corruption level. Considering that these factors are dynamic and tend to affect a country’s innovation performance in a long-term perspective, the variables were built based on their average over the previous two decades, whenever the data allowed. The next step is to present and describe how they are measured.
Notorious, democracy is a complex multidimensional concept that may be analyzed and assessed from different perspectives. One well-known indicator is the democracy score from the Freedom House, which since the 1970s annually assesses the condition of political rights and civil liberties worldwide. The survey encompasses the electoral process, political pluralism and participation, the functioning of the government, freedom of expression and belief, associational and organizational rights, the rule of law, and personal autonomy and individual rights. Grounded in these data and information, the ranking is highly correlated with other democracy indicators frequently used by researchers (Casper & Tufis, 2003) and classifies the countries on a scale from 1 (most free) to 7 (least free)6. Considering the dynamic and long-term perspectives of nations’ democracy, the variable consists of the average scores from 1991 to 2020. So, the hypothesis to be tested is that the lowest the democracy index, the more prone the national innovation system to prosper.
Regarding political competition, the research uses electoral competition from the Polity V project. This variable assesses the features of the Chief executive’s selection processes in parliamentary or presidential elections, including the three dimensions: recruitment regulation, competitiveness, and openness. The index also varies from 1 to 10, and the average score covers the period from 1991 to 2018. Thus, it is expected that the higher the level of political competition, the better the economy’s innovation performance.
Income Inequality is also a concept that can be defined and operationalized in various ways. However, the Gini Index was chosen due to the need for comparability among several countries and a considerable range of years. This traditional indicator measures the extent to which income distribution within an economy deviates from a perfectly equal distribution, varying from 0 (perfect equality) to 100 (perfect inequality)7. The variable covers the average of countries’ indexes available from 1991 to 2020. As the variable is based on household income data, the theoretical expectation is that the lower the inequality level in the country, the higher the innovative performance.
In the administrative dimension the first two variables come from the research project of Quality of Government based on a survey of experts about their perception of the current status and characteristics of a nation’s public bureaucracy (Nistotskaya et al., 2021). The 2020 edition of the survey covers more than 100 countries, is reliable and widely used by several studies in the social science field (Sundell, 2014). Bureaucratic professionalism includes the dimensions of merit, patronage, and tenure in the public service, and the nations’ scores vary from -2.4 (less professional) to 4.4 (more professional). At the same time, the second administrative variable is bureaucratic impartiality, which measures the degree of impartiality and reliability of bureaucracies in decision-making. The countries’ scores vary from -1.1 (less impartial) to 1.6 (more impartial). Therefore, the hypothesis is that the higher the bureaucratic quality, the better the economies’ innovation outputs.
Finally, the Corruption Perceptions Index is employed to cope with countries’ corruption and transparency effects. This variable, published by Transparency International since 1995, ranks over a hundred nations by their perceived levels of public sector corruption, grounded in expert assessments and opinion surveys. The scores vary from 0 (highly corrupt) to 100 (very clean)8. It is expected that the less corrupted the nation is, the higher the innovation scores.
Besides these political and administrative variables, the regression models also include a control for the gross domestic product (GDP) per capita since several studies have shown that this economic factor can be correlated to innovation outputs at the national level (Cirera & Maloney, 2017; Dutta et al., 2020; Lundvall, 2016). Table 1 displays the independent variables’ criteria, descriptive statistics, and coefficient signs theoretical expected:
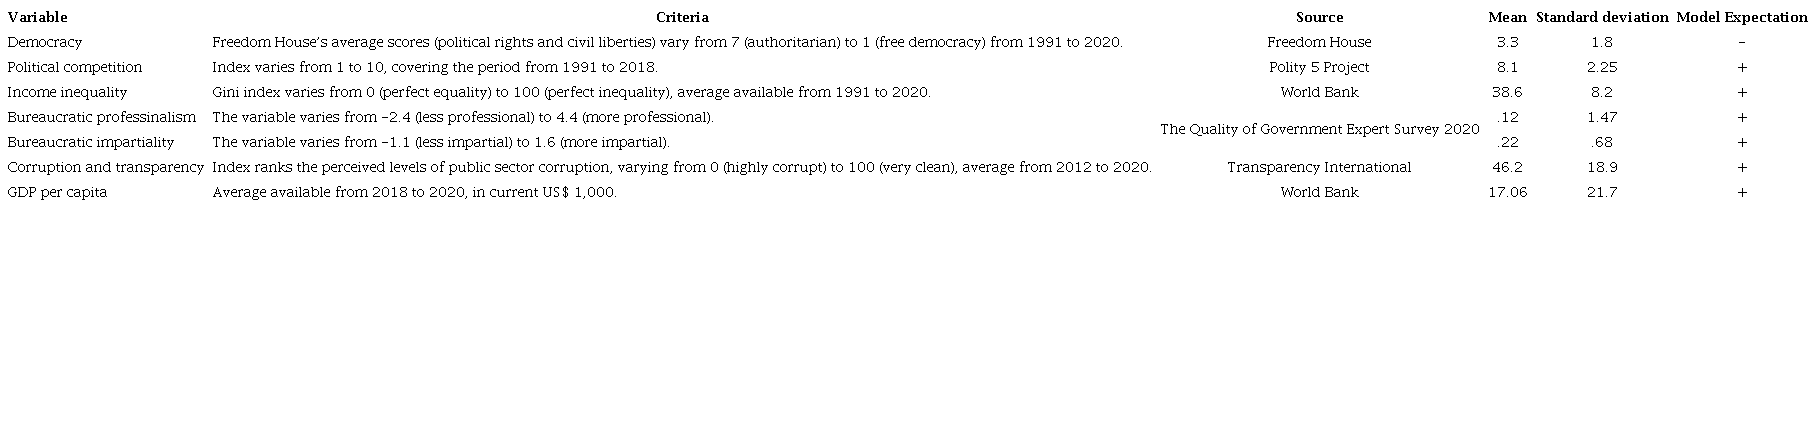
Source: Elaborated by the author.
In short, to analyze the effects of countries’ political-administrative features on their levels of innovation performance, multivariate regression models empirically test this possible correlation for the GII sub-index of outputs and its two sub-pillars (KTO and CO). Therefore, the basic statistic model is defined as follows:
Innovation Performancei= β0 + β1Democracyi + β2Political Competitioni + β3Income Inequalityi + β4Bureaucracy Professionalismi + β5Bureaucracy Impartialityi + β6Corruptioni + β7GDP per capita+ui
3.2. Results and discussion
The models’ results from Ordinary Least Square regression (OLS) using cross-sectional data have interesting findings in different ways. Table 1 presents the estimated coefficients, standard errors in parentheses, and the models’ coefficients of determination for all three dependent variables.
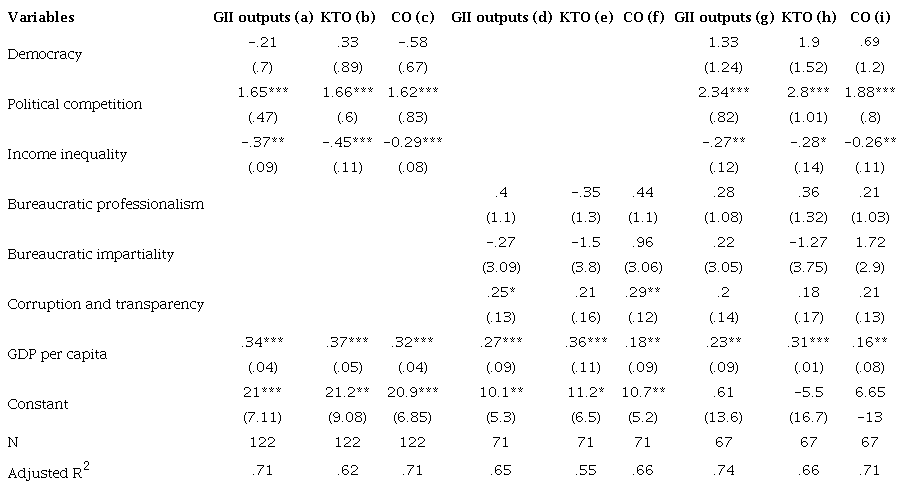
Note: Standard errors in parentheses * p<0.05, ** p<0.01, *** p<0.001. Source: Elaborated by the author.
The first three models (a to c) include only the political variables and control. The d follows the same logic as the f models focused on the administrative dimension. The last three encompass all independent and control variables of this research. The observations reduce because the administrative variables do not cover the equivalent number of countries as the political ones and the GII.
Importantly, T-test and F-test are valid asymptotically. Although some variables are not statistically significant, overall, the significance of the regressions is confirmed (Wooldridge, 2006). After the regression, a check for multicollinearity was carried out, and the results proved that the degree of collinearity among the independent variables is not problematic. Initially, the coefficients of determination (R2) in all nine models are relatively expressive, considering that the independent variables together explain from 55% to 74% of the economies’ innovation performance. Secondly, it is also noticeable that half of the independent variables affect the performance indexes with different patterns and intensities.
In theory, democracy allows information flow, the key to the dynamic interaction of knowledge and the collaborative learning process and promotes a positive collaborative environment to foster innovation (Lundvall, 2010). However, the models’ regression estimates indicate no statically significant impact. In other words, the democratic level, measured by political rights and civil liberties conditions, does not seem to matter in a country’s innovative performance, which refutes this research hypothesis. It also converges with Gao et al.’s (2010) findings, but in the present paper’s analysis, the results are based on a more comprehensive approach to the nations’ innovation performance. In this sense, the results offer some insights into why democratic nations, such as Brazil and Uruguay, have mediocre performance in innovation. In contrast, others are considered more authoritarian, e.g., China and Singapore are leaders in the GII ranking.
Conversely, political competition goes in a different direction in all six models. The estimated coefficients are even higher with all political and administrative variables included (models g to i). Therefore, the result suggests that increasing the degree of electoral competition in the political system tends to pressure and influence the politicians to build state capacity for an effective innovation policy mix, as the literature indicates (Deng et al., 2019; Paik et al., 2017; Pinto & Timmons, 2005) and, consequently positively affecting knowledge and creative outputs.
The third political variable, income inequality, also shows stubborn and statistically significant estimates. Although there is no consensus in the field if the countries’ inequality can benefit or harm innovation performance (Cozzens & Kaplinsky, 2009; Tselios, 2011), the regression model indicates the latter correlation. In other words, the higher the income inequality in the economy, the worse it tends to be its achievement in terms of knowledge creation, impact and diffusion, intangible assets, creative goods and services, and online creativity. This finding raises a relevant concern because income inequality within and among nations has increased in recent decades. Besides, they have been exacerbated after the financial crisis of 2008 and especially during the COVID-19 pandemic (Chancel, Piketty, Saez, & Zucman, 2021). So, it adds another complex barrier to the catching-up and technological upgrading challenges in most countries on the planet (Castellacci & Natera, 2013; Radosevic & Yoruk, 2017).
In the administrative dimension, the assumption that sustains the analysis relies on the expected relation between greater bureaucracy capacity, especially regarding designing and implementing policy mixes (instruments and funding) to nurture a dynamic NIS and to accomplish innovative standards (Cirera et al., 2020; OECD, 2015; World Bank, 2010). Nevertheless, the empirical results do not confirm this premise and refute the respective hypothesis. The coefficients of bureaucratic professionalism and impartiality were not statistically significant in any model, which indicates that dynamic administrative capacities seem not so relevant to performance, putting in perspective part of the literature (Cirera & Maloney, 2017; Kattel & Mazucatto, 2018). The results also diverge from the findings of Suzuki and Demircioglu (2019), that used the same variables to test this correlation, indicating that government quality can affect innovation performance only in a specific group of primarily developed countries, such as the OECD’s members, but not the rest of nations worldwide.
Nevertheless, transparency and corruption do not share the same theoretical convergence as the previous variables. Despite the normative assumption related to these factors, scholars diverge on the benefits of a high degree of public transparency and a low level of corruption in innovation (Brown & Martinsson, 2018; Deogirikar, 2014; Reggi & Dawes, 2016; Veracierto, 2008; Wen et al., 2020). As the independent variable used involves these two features, based on the regression model estimates, it is not possible to confirm that more transparent countries and cleaner tend to produce more creative assets and then, to better perform in the innovation field because the coefficients are not statistically significant when the political variables are included (models g to i).
Lastly, as expected, the control variable GDP per capita shows positive and statistically significant effects on innovation outputs in all regression models, as the studies in the field support (Cirera & Maloney, 2017; Dutta et al., 2020; Lundvall, 2016).
4. FINAL REMARKS
The primary purpose of this paper was to advance the analysis of why some economies could overcome structural barriers to innovation growth. The bulk of the literature has emphasized efforts to describe the innovation systems (Edler & Fagerberg, 2017; Lundvall, 2010) and explain their achievement grounded in economic and technological influential factors (Castellacci & Natera, 2013; Lundvall et al., 2009; Radosevic & Yoruk, 2017). Nonetheless, less attention has been given to the investigation of countries’ political and administrative features that notoriously affect how policies are designed and formulated and, consequently, influence the nations’ innovation performance (Cirera et al., 2020; Cirera & Maloney, 2017; Dutta et al., 2020; Lundvall, 2010; World Bank, 2010).
In order to advance in the analysis of how a nation’s political and administrative features affect its innovative performance, the inquiry selected several countries in all five continents with different institutional characteristics and levels of innovation outputs and tested hypotheses that politics and public management matter. In short, the empirical results demonstrated that democracy does not affect the NIS performance. This is unexpected due to the normative assumption that higher political rights and civil liberties would be the best developmental path. On the contrary, political competition and inequality are influential factors as well. The former showed positive effects on the GII’s index of outputs, while the latter’s estimates indicate that income concentration can be a barrier to innovation growth. Overall, these two hypotheses supporting the politics’ influence on countries’ innovation capacity and accomplishment were confirmed.
In the administrative dimension, the positive correlation between bureaucratic capacity or transparency and a low level of corruption with greater performance in the innovation field can only partially be sustained. While the quality of state apparatus was not statistically significant in any model, the results for transparency/corruption were only substantial for the creative outputs and the innovation performance sub-indexes without the political variables in the models. These results put into perspective part of the innovation paradox’s argument (Cirera et al., 2020; Cirera & Maloney, 2017), i.e., the lack of government capabilities in policymaking could explain countries’ poor innovative performance.
In sum, the paper brought original and intriguing findings to innovation, public administration, and political economy debates. In practical terms, the inferences provide insights to public and private stakeholders to improve the discussions and decisions regarding the priorities for government actions in times of evidence-based policymaking. Due to the complexity of this type of cross-nation comparison, the results must be analyzed with caution, especially due to the methodological and theoretical limitations of composite indicators, such as the GII, Freedom House index, and Quality of Government (Andrews, 2008). Nevertheless, it does not harm the scientific validity of this inquiry. Conversely, mapping shortcomings highlight the need for complementary approaches to complicated and dynamic phenomena.
To advance this research agenda, focused on understanding the paths some countries have paved to innovation growth and development, the studies can amplify the timeframe in the comparative analyses or address the interactions among the independent variables employed to explain innovation performance, such as GDP per capita and electoral competition. It may also include different approaches, such as the decolonial studies, or new variables to test other possible explanations, for instance, the relationship between the degree of political-cultural autonomy, or electoral cycles with countries’ innovation outputs. In terms of methods, an alternative is to employ different methodological approaches, such as qualitative comparative analysis (QCA) and in-depth case studies, which could complement the article’s findings and make them even more relevant to the field of study. Finally, another promising research agenda is to test the political uncertainty effects on the innovation system by using a more comprehensive measure, such as the Global Innovation Index, and amplifying the analysis from specific countries to a worldwide approach.
REFERENCES
Acemoglu, D., & Verdier, T. (2000). The choice between market failures and corruption. American Economic Review, 90(1), 194-211. Retrieved from https://doi.org/10.1257/aer.90.1.194
Andrews, M. (2008). The good governance agenda: beyond indicators without theory. Oxford Development Studies, 36(4), 379-407. Retrieved from https://doi.org/10.1080/13600810802455120
Atanassov, J., Julio, B., & Leng, T. (2015). The bright side of political uncertainty: the case of R&D. Retrieved from https://ink.library.smu.edu.sg/lkcsb_research/6421
Besley, T., & Case, A. (1995, August). Does electoral accountability affect economic policy choices? Evidence from gubernatorial term limits. The Quarterly Journal of Economics, 110(3), 769-798. Retrieved from https://doi.org/10.2307/2946699
Besley, T., Persson, T., & Sturm, D. M. (2010). Political competition, policy and growth: theory and evidence from the US. The Review of Economic Studies, 77(4), 1329-1352. Retrieved from https://doi.org/10.1111/j.1467-937X.2010.00606.x
Brown, J., & Martinsson, G. (2018). Does transparency stifle or facilitate innovation? Management Science, 65(4), 1600-1623. Retrieved from https://doi.org/10.1287/mnsc.2017.3002
Casper, G., & Tufis, C. (2003). Correlation versus interchangeability: the limited robustness of empirical findings on democracy using highly correlated data sets. Political Analysis, 11(2), 196-203. Retrieved from https://doi.org/10.1093/pan/mpg009
Castellacci, F., & Natera, J. M. (2013). The dynamics of national innovation systems: a panel cointegration analysis of the coevolution between innovative capability and absorptive capacity. Research Policy, 42(3), 579-594. Retrieved from https://doi.org/10.1016/j.respol.2012.10.006
Chancel, L., Piketty, T., Saez, E., & Zucman, G. (2021). World inequality report 2022. Paris, France: World Inequality Lab.
Cimoli, M., Dosi, G., Nelson, R. R., & Stiglitz, J. (2009). Institutions and policies shaping industrial development: an introductory note. In M. Cimoli, G. Dosi, & J. E. Stiglitz (Eds.), Industrial policy and development: the political economy of capabilities accumulation (The initiative for policy dialogue series, pp. 19-37). Oxford, UK: Oxford Press.
Cirera, X., Frías, J., Justin, H., & Yanchao, L. (2020). A practitioner’s guide to innovation policy. Instruments to build firm capabilities and accelerate technological catch-up in developing countries. Washington, DC: World Bank.
Cirera, X., & Maloney, W. F. (2017). The innovation paradox: developing-country capabilities and the unrealized promise of technological catch-up. Washington, DC: The World Bank.
Collier, D. (1993). The comparative method. In A. W. Finifter (Ed.), Political science: the state of discipline II. Washington, DC: American Political Science Association.
Cozzens, S. (2008). Equality as an issue in designing science, technology, and innovation policies and programs. In W. Ostreng (Ed.), Confluence (pp. 94-97). Oslo, Norway: Centre for Advanced Study at the Norwegian Academy of Science and Letters.
Cozzens, S., & Kaplinsky, R. (2009). Innovation, poverty and inequality: cause, coincidence, or co-evolution? In B. A. Lundvall (Ed.), Handbook of innovation systems and developing countries (Chap. 3). Cheltenham, UK: Edward Elgar Publishing.
Deng, Y., You, D., & Wang, J. (2019, October). Optimal strategy for enterprises’ green technology innovation from the perspective of political competition. Journal of Cleaner Production, 235, 930-942. Retrieved from https://doi.org/10.1016/j.jclepro.2019.06.248
Deogirikar, A. (2014). The impact of open government on innovation: does government transparency drive innovation? (Master Thesis). Georgetown University, Washington, DC.
Dutta, S., Lanvin, B., León, L. R., & Wunsch-Vincent, S. (2021). Global innovation index 2021: tracking innovation through the COVID-19 crisis. Retrieved from https://www.wipo.int/edocs/pubdocs/en/wipo_pub_gii_2021.pdf
Dutta, S., Lanvin, B., & Wunsch-Vincent, S. (2019). Global innovation index 2019: Creating healthy lives - the future of medical innovation. Retrieved from https://www.wipo.int/edocs/pubdocs/en/wipo_pub_gii_2019.pdf
Dutta, S., Lanvin, B., & Wunsch-Vincent, S. (2020). Global innovation index 2020: who will finance innovation? Retrieved from https://www.wipo.int/edocs/pubdocs/en/wipo_pub_gii_2020.pdf
Edler, J., & Fagerberg, J. (2017). Innovation policy: what, why, and how. Oxford Review of Economic Policy, 33(1), 2-23. Retrieved from https://doi.org/10.1093/oxrep/grx001
Etzkowitz, H. (2008). The triple helix: university-industry-government innovation in action. New York, NY: Routledge.
Evans, P., & Rauch, J. E. (1999). Bureaucracy and growth: a cross-national analysis of the effects of “Weberian” state structures on economic growth. American Sociological Review, 64(5), 748-765. Retrieved from https://doi.org/10.2307/2657374
Forssbæck, J., & Oxelheim, L. (2015). The multi-faceted concept of transparency. In J. Forssbæck, & L. Oxelheim(Eds.), The Oxford Handbook of Economic and Institutional Transparency. New York, NY: Oxford University Press.
Gao, Y., Zang, L., Roth, A., & Wang, P. (2017). Does democracy cause innovation? An empirical test of the popper hypothesis. Research Policy, 46(7), 272-1283. Retrieved from https://doi.org/10.1016/j.respol.2017.05.014
Haggard, S., & Kaufman, R. R. (2008). Development, democracy, and welfare states: Latin America, East Asia, and Eastern Europe. Princeton, NJ: Princeton University Press.
Iootty, M. (2019). Assessing innovation patterns and constraints in developing East Asia: an introductory analysis. Washington, DC: World Bank.
Jiang, Z., Wang, Z., Feng, C., & Yi, L. (2022). Local political turnover, R&D investment leap and corporate innovation performance: evidence from China. Science and Public Policy, 49(2), 347-364. Retrieved from https://doi.org/10.1093/scipol/scab090
Kattel, R., & Mazzucato, M. (2018). Mission-oriented innovation policy and dynamic capabilities in the public sector. Industrial and Corporate Change, 27(5), 787-801. Retrieved from https://doi.org/10.1093/icc/dty032
Lin, J. Y. (2012). From flying geese to leading dragons: new opportunities and strategies for structural transformation in developing countries. Global Policy, 3(4), 397-409. Retrieved from https://doi.org/10.1111/j.1758-5899.2012.00172.x
Lundvall, B. Å. (2016). Innovation systems and development: history, theory, and challenges. In E. S. Reinert, J. Ghosh, & R. Kattel (Eds.), Handbook of Alternative Theories of Economic Development (pp. 594-612). Cheltenham, UK: Edward Elgar Publishing.
Lundvall, B. Å., & Borrás, S. (2006). Science, Technology, and Innovation Policy. In J. Fagerberg, & D. C. Mowery (Eds.), Oxford Handbook of Innovation (pp. 599-631). Oxford, UK: Oxford University Press.
Lundvall, B. Å., Joseph, K. J., Chaminade, C., & Vang, J. (2009). Handbook of innovation systems and developing countries: building domestic capabilities in a global setting. Cheltenham, UK: Edward Elgar Publishing.
Mahagaonkar, P. (2008, March). Corruption and innovation: a grease or sand relationship? (Jena Economic Research Papers, Nº 2008-017). Jena, Germany: Friedrich Schiller University and the Max Planck Institute of Economics.
Mahoney, J., & Goertz, G. (2006). A tale of two cultures: contrasting quantitative and qualitative research. Political Analysis, 14(3), 227-249. Retrieved from https://doi.org/10.1093/pan/mpj017
Marshall, M., & Elzinga-Marshall, G. (2017). Global report 2017: conflict, governance and state fragility. Vienna, VA: Center for Systemic Peace.
Mazzucato, M. (2013). The entrepreneurial State. London, UK: Anthem Press.
Nelson, R. R. (2016). Economic development as an evolutionary process. In E. S. Reinert, J. Ghosh, & R. Kattel(Eds.), Handbook of alternative theories of economic development(pp. 323-335). Cheltenham, UK: Edward Elgar Publishing.
Nistotskaya, M., Dahlberg, S., Dahlström, C., Sundström, A., Axelsson, S., Dalli, C., Pachon, N. (2021). The quality of government expert survey 2020 dataset: Wave III. Gothenburg, Sweden: University of Gothenburg.
Ober, J. (2008). Democracy and knowledge: innovation and learning in classical Athens. Princeton, NY: Princeton University Press.
Organisation for Economic Cooperation and Development. (2015). The innovation imperative: contributing to productivity, growth and well-being. Paris, France: Author. Retrieved from https://doi.org/10.1787/9789264239814-en
Paik, Y., Kang, S., & Seamans, R. (2018). Entrepreneurship, innovation, and political competition: how the public sector helps the sharing economy create value. Strategic Management Journal, 40(4), 503-532. Retrieved from https://doi.org/10.1002/smj.2937
Pertuze, J. A., Reyes, T., Vassolo, R. S., & Olivares, N. (2019). Political uncertainty and innovation: the relative effects of national leaders’ education levels and regime systems on firm-level patent applications. Research Policy, 48(9), 103808. Retrieved from https://doi.org/10.1016/j.respol.2019.103808
Piketty, T. (2014). Capital in the twenty-first century. Cambridge, MA: Harvard University Press.
Pinto, P., & Timmons, J. (2005). The political determinants of economic performance: political competition and the sources of growth. Comparative Political Studies, 38(1), 26-50. Retrieved from https://doi.org/10.1177/0010414004270886
Przeworski, A., Alvarez, M., Cheibub, J. A., & Limongi, F. (2000). Democracy and development. Cambridge, MA: Cambridge University Press.
Radosevic, S., & Yoruk, E. (2018, April). Technology upgrading of middle-income economies: a new approach and results. Technological Forecasting and Social Change, 129, 56-75. Retrieved from https://doi.org/10.1016/j.techfore.2017.12.002
Reggi L., & Dawes S. (2016). Open government data ecosystems: linking transparency for innovation with transparency for participation and accountability. In Proceedings of the5ºInternational Conference on Electronic Government and the Information Systems Perspective, Porto, Portugal. Retrieved from https://dx.doi.org/10.1007/978-3-319-44421-56
Stein, E., Tommasi, M., Echebarria, K., Lora, E., & Payne, M. (2006). The politics of policies: economic and social progress in Latin America. Washington, DC: Inter-American Development Bank.
Sun, D., Zeng, S., Zhang, Y., Wu, C., & Shi, J.(2022). The art of adversity thinking: political turnover and firm innovation. IEEE Transactions on Engineering Management. Retrieved from https://doi.org/10.1109/TEM.2022.3144573
Sundell, A. (2014). Are formal civil service examinations the most meritocratic way to recruit civil servants? Not in all countries. Public Administration, 92(2), 440-457. Retrieved from https://doi.org/10.1111/padm.12077
Suzuki, K. M., & Demircioglu, M. (2019). The association between administrative characteristics and national level innovative activity: findings from a cross-national study. Public Performance & Management Review, 42(4), 755-782. Retrieved from https://doi.org/10.1080/15309576.2018.1519449
Tselios, V. (2010). Is inequality good for innovation? International Regional Science Review, 34(1), 75-101. Retrieved from https://doi.org/10.1177/0160017610383278
Veracierto, M. (2008). Corruption and innovation. Economic Perspectives, 32(1), 29-39. Retrieved from https://www.chicagofed.org/publications/economic-perspectives/2008/1qtr2008-part3-veracierto
Wen, J., Zheng, M., Feng, G., Chen, S. W., & Chang, C. (2020). Corruption and innovation: linear and nonlinear investigations of OECD Countries. The Singapore Economic Review, 65(1), 103-129. Retrieved from https://doi.org/10.1142/S0217590818500273
Wooldridge, J. M. (2006). Introductory econometrics: a modern approach(3a ed.). Mason, OH: South-Western.
World Bank. (2010). Innovation policy a guide for developing countries. Washington, DC: Author.
Notes
Author notes