Research Article
Canonical correlation between vegetative and productive traits in sweet corn genotypes1
Correlação canônica entre características vegetativas e produtivas em genótipos de milho-verde
 Eluana Domingues Gonçalves elodominguesg@gmail.com
Eloisa Borchardt de Araújo eloisaborchardt2@gmail.com
Lucas Felipe Alves de Araújo lucasfelipe.lf08@gmail.com
Juliana de Nazaré Campus Curitiba jucamposjipa@gmail.com
Luma Fernanda Ferreira luma.ferreira2909@gmail.com
Idelfonso Leandro Bezerra idelfonsobezerra@unir.br
Lucas da Silva Santos lucasmelhorista@gmail.com
Eluana Domingues Gonçalves elodominguesg@gmail.com
Eloisa Borchardt de Araújo eloisaborchardt2@gmail.com
Lucas Felipe Alves de Araújo lucasfelipe.lf08@gmail.com
Juliana de Nazaré Campus Curitiba jucamposjipa@gmail.com
Luma Fernanda Ferreira luma.ferreira2909@gmail.com
Idelfonso Leandro Bezerra idelfonsobezerra@unir.br
Lucas da Silva Santos lucasmelhorista@gmail.com
Canonical correlation between vegetative and productive traits in sweet corn genotypes1
Pesquisa Agropecuária Tropical, vol. 54, e79943, 2024
Escola de Agronomia/UFG
Received: 17 July 2024
Accepted: 11 October 2024
Published: 07 November 2024
ABSTRACT: Associations between different groups of sweet corn traits enable both the direct and indirect selection of plants, thus increasing the chances of success in breeding programs. This study aimed to estimate the relationships between vegetative and productive traits, as well as genotypic values, using canonical correlations and mixed models. The experiment was carried out in a randomized block design, with ten genotypes and four replications. The following traits were assessed: plant height, main ear insertion height, yield of ears with and without straw, grain mass, ear length, ear diameter and percentage of commercial ears. The significant correlations obtained in the first canonical pair indicate that an increase in height and main ear insertion height result in a decrease in the percentage of commercial ears and yield of ears without straw, being necessary to select plants with plant height values of less than 2.0 m and first ear insertion height of less than 1.0 m to increase them. It was observed that the plant height and main ear insertion height have the highest heritability, indicating the possibility of genetic gain from the artificial selection.
KEYWORDS: Zea mays, genotypic selection, genetic breeding.
RESUMO: As associações entre diferentes grupos de características do milho-verde possibilitam tanto a seleção direta como indireta, aumentando as chances de sucesso em programas de melhoramento. Objetivou-se estimar as relações entre características vegetativas e produtivas, bem como os valores genotípicos, por meio de correlações canônicas e modelos mistos. O experimento foi conduzido em blocos casualizados, com 10 genótipos e quatro repetições. Foram avaliados a altura de planta, altura de inserção da espiga principal, produtividade de espigas com e sem palha, massa de grãos, comprimento de espiga, diâmetro de espiga e porcentagem de espigas comerciais. As correlações significativas obtidas no primeiro par canônico indicam que o aumento da altura e altura de inserção da espiga resultam na diminuição da porcentagem de espigas comerciais e produtividade de espigas sem palha, sendo necessária, para aumentá-las, a seleção de plantas que apresentem valores inferiores a 2,0 m para altura de planta e a 1,0 m para altura de inserção da espiga principal. Verificou-se que a altura de planta e altura de inserção da espiga principal possuem maior herdabilidade, indicando possibilidade de ganho genético com a seleção artificial.
PALAVRAS-CHAVE: Zea mays, seleção genotípica, melhoramento genético.
INTRODUCTION
In Brazil, approximately 72 % of the national production of maize (Zea mays) is destined for industrialization, 15 % for human consumption, and only 13 % for fresh consumption in the form of sweet corn (Abimilho 2019). In 2006, the production of sweet corn in the Rondônia state was 1,047 tons (IBGE 2006), whereas, in 2017, it increased to 1,510 tons (IBGE 2017).
According to the 2017 agricultural census (IBGE 2017), agriculture in Rondônia predominantly comprises family farms. Of the 91,438 farms, around 74,329 (81.3 %) are classified as family farms. As such, the state has a potential to expand and improve sweet corn production. In this sense, in the 2020/2021 crop season, there was an increase of 7.5 % in the area destined for growing second crop maize (Conab 2021). Following the growth trend, in the 2022/2023 crop season, the area planted with this crop expanded from 239.8 to 288.7 thousand hectares (Conab 2023).
For the sweet corn production, the market demands ears with a larger diameter and length, yellow toothed grains, large, well-stuffed ears and a good grain size (Embrapa 2020). Thus, in breeding programs, the simultaneous selection of several agronomic traits offers greater chances of success, allowing the selection of promising genotypes for the market (Rodrigues et al. 2011, Crevelari et al. 2018). Therefore, selection based on just one or a few traits may be inadequate, since negative correlations among the traits of interest may negatively affect the desired goal (Silva & Viana 2012).
In this context, canonical correlations make it possible to group the variables of interest and identify the contributions that each studied variable has on the main variable, providing advantageous information when selecting superior genotypes (Carvalho et al. 2015). The canonical correlation approach makes it possible to determine the relationships between groups of traits, not restricting itself to the analysis of just two traits and making it possible to select groups of variables, thus facilitating the process of selecting superior individuals, especially when many traits are used (Lopes et al. 2022).
Another efficient selection strategy is the best linear unbiased prediction (BLUP) method, which has been used to predict genetic values, eliminating environmental effects. This approach can predict the average genotypic performance of the next generation according to the heritability of the analyzed variables, allowing only the most relevant traits to be selected (Silva et al. 2022).
The use of variance components estimated by restricted maximum likelihood (REML) and genetic or genotypic values predicted by BLUP has become a widely used approach in selection processes, mainly due to its high accuracy in selecting superior genotypes (Candido et al. 2020). Oliveira et al. (2017) and Santos et al. (2021) have already used this technique to select maize cultivars capable of simultaneously combining adaptability, stability and high grain yield. In addition, Almeida et al. (2024) used the REML technique also to estimate genetic gains in the selection of maize populations derived from commercial hybrids.
In this context, this study aimed to estimate the interrelationship between the vegetative and yield traits of sweet corn genotypes using canonical correlations and select the genotypes with the best predicted genetic gains in the traits of interest via the REML/BLUP approach.
MATERIAL AND METHODS
The study was conducted at the experimental farm of the Universidade Federal de Rondônia, in Rolim de Moura, Rondônia state, Brazil (11º43´36.27"S, 61º51´14.47"W and altitude of 236 m), from November 2021 to February 2022. The soil of the region is classified as Latossolo Vermelho-Amarelo (Santos et al. 2018) or Ferralsol (FAO 2015), which is highly weathered.
The experimental area was prepared using conventional tillage, with two harrowings, and the experiment set up in a randomized block design, with four replications. Ten treatments were used, nine of which were hybrids: NTX303 VIP3 (G1), 41N545 (G3), 47BM970 (G4), ADV9621 (G5), AG7088 PRO3 (G6), AG1051 (G7), GNZ7280 PRO2 (G8), AG8061 PRO2 (G9), BRS3046 (G10) and Population R (population of half-sib; G2). The experimental plot comprised five 5-m long rows, with 1.0 m between the rows and 0.28 m between the plants, with a total population of 35,714 plants ha-1.
Planting took place on November 20, 2021, by hand, when the crop nutritional requirements were met according to the results of the soil chemical analysis in the 0-20 cm layer (pH in water: 5.4; organic matter: 38 g kg-1; phosphorus: 37.6 mg dm-3; potassium: 65 mg dm-3; calcium: 2 cmolc dm-3; magnesium: 1.1 cmolc dm-3; hydrogen + aluminum: 5.3 cmolc dm-3; sand: 364 g kg-1; silt: 50 g kg-1; clay: 586 g kg-1). According to the soil analysis, fertilization was conducted with 112 kg of N, 32 kg of P2O5 and 40 kg of K2O. At the sowing furrow, 71 kg ha-1 of triple superphosphate and 50 kg ha-1 of urea were applied; at 15 days after emergence (DAE), in the first topdressing, 100 kg ha-1 of urea and 67 kg ha-1 of potassium chloride were applied; in the second top dressing, at 25 DAE, 100 kg ha-1 of urea were applied. All fertilizations were conducted manually.
Weed control was performed at the V4 phenological stage (four fully expanded leaves), with a mixture of 2 L ha-1 of atrazine and 1.25 L ha-1 of nicosulfuron. Two applications of an insecticide based on acetamiprid and bifenthrin were conducted, with 250 g ha-1 being the dose applied to control maize aphid (Rhopalosiphum maidis Fitch, 1856), green-bellied stink bug (Dichelops melacanthus Dallas, 1851) and maize leafhopper (Dalbulus maidis DeLong & Wolcott, 1923). The first application was made at the V4 stage and the second at 7 days after the first one, as recommended by the manufacturer. The insecticide and herbicide applications were made using a knapsack sprayer with capacity of 20 liters.
The ears were harvested at the milky stage (R3), with 70 to 80 % of moisture. The assessed traits were: plant height (cm); main ear insertion height (cm); ear yield with straw (t ha-1); ear yield without straw (t ha-1); mass of grains per ear (kg), obtained from the average of the grains cut from ten ears; ear length (cm); ear diameter (cm); percentage of commercial ears, considering ears with a diameter equal to or greater than 3 cm and a length equal to or greater than 15 cm (Oliveira Junior et al. 2006).
Canonical correlation analysis was used to assess the correlation between the studied variables, using the Candisc (Friendly & Fox 2021) and CCA (González & Déjean 2021) packages. The canonical groups were established based on the vegetative traits (group 1) and yield components (group 2). Group 1 comprised plant height and main ear insertion height, whereas group 2 comprised ear yield with straw, ear yield without straw, ear length, mass of grains per ear, ear diameter and percentage of commercial ears.
The BLUP of the i-th genotype was obtained by BLUP = µ + i, where µ is the overall mean and i the genotypic effect, considering the balanced data and genotype as a random effect and estimated by i = hg2 ( i. - ..), where hg2 is the genotypic heritability and ( i. - ..) the effect of genotype minus the overall mean. The confidence intervals for the BLUPs were estimated according to Resende (2022), following the equation: CI = Gv ± t[(1 - r2 x à 2 )]0.5, where CI is the confidence interval, Gv the genotypic value, t the Student t distribution value associated with the two-tailed test and significance level (± = 0.05), r2 the selective accuracy and à 2 the genotypic variance. The genotypic values (REML/BLUP) were analyzed using the metan package (Olivoto & Lúcio 2020). All analyses were conducted using the R software (R Core Team 2023).
RESULTS AND DISCUSSION
By analyzing the canonical correlations, the first canonical pair was significant between the traits of groups 1 and 2 (p < 0.001) and explained 83.55 % of the variability in the data, while the second canonical pair explained 16.45 % of this variation, but showed no significant variation between the groups (Table 1).

According to Rencher (2005), at least 70 % of the total variance in the data must be explained by the first two canonical pairs. In this way, the total variance explained by the first canonical pair shows the significant association between the two groups of studied variables, allowing inferences about the interdependence between the two groups of traits.
The first canonical pair was statistically significant and showed a correlation of r = 0.73 between the vegetative and yield traits (Table 1). Plant height (r = 0.99) and main ear insertion height (r = 0.95) (group 1) were inversely related to the yield of ears without straw (r = -0.47) and percentage of commercial ears (r = -0.33) (group 2).
The correlation observed for the two groups of variables in the second canonical pair was low (r = 0.43) and not significant (Table 1). These results indicate that only the first canonical pair captured much variation and associations among the studied variables.
Figure 1 shows how the groups 1 and 2 were divided, with plant height and main ear insertion height in the last circle of the biplot making up the first group, and ear diameter, ear length, mass of grains per ear, percentage of commercial ears, ear yield without straw and ear yield with straw forming the second group in the smaller circle of the biplot.
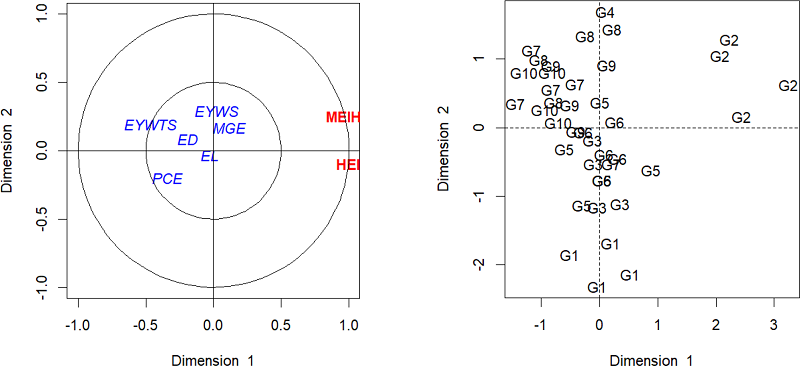
Figure 1
Graphical representation of the canonical correlation analysis (CCA; A) of the analyzed variables and graph of the scores obtained from all the studied genotypes (B). G1: NTX303 VIP3; G2: Population R; G3: 41N545; G4: ADV9621; G5: 46BM970; G6: AG7088 PRO3; G7: AG1051; G8: GNZ7280 PRO2; G9: AG8061 PRO2; G10: BRS3046.
Variables in opposite directions behave inversely, characterizing a negative correlation (Moura et al. 2020). In this way, an increase in one variable is directly related to a proportional decrease in the other, so an increase in plant height and main ear insertion height are associated with a decrease in the percentage of commercial ears, ear length, ear diameter and ear yield without straw (Figure 1).
The closer the variables are, the greater their correlation (Baretta et al. 2016). In this context, variables in the same direction show a positive correlation, as can be seen between plant height and main ear insertion height (Figure 1A). The greater the plant height, the greater the main ear insertion height, and the reverse is true (Campos et al. 2010).
For the suitability of sweet corn, the distance between the ground and the insertion of the main ear should be smaller, as this will contribute to a better balance of the plant, minimizing stalk breakage and ear loss, resulting in a higher percentage of commercial ears (Kappes et al. 2011).
The yield of ears without straw and the percentage of commercial ears also had a high correlation. As they are in the same direction, they have a positive correlation with each other and a negative correlation with plant height and main ear insertion height. The projection on the biplot of the groups of variables confirms that an increase in plant height and main ear insertion height cause a reduction in the percentage of commercial ears and ear yield without straw.
Figure 1B shows the dispersion of the genotypes and the association between the two groups of variables under study. Thus, the half-sib population (G2) showed the highest average plant height and main ear insertion height, and the lowest average percentage of commercial ears and yield of ears without straw, since they are on opposite sides of the biplot. The ear yield without straw variable had a direct influence on the genotypes G9 (AG8061 PRO2), G10 (BRS3046), G7 (AG1051) and G8 (GNZ7280 PRO2), directly affecting their yield performance. The analyzed variables did not significantly influence the NTX303 VIP3 genotype (G1) to make it stand out.
Table 2 shows that the range of variation in height was from 1.76 (AG1051; G7) to 2.76 (Population R; G2). This means that medium sized plants had higher yields (Table 2). Similar results were found by Santos et al. (2015), where plants with medium height (< 2.00 m) also had the highest yield.
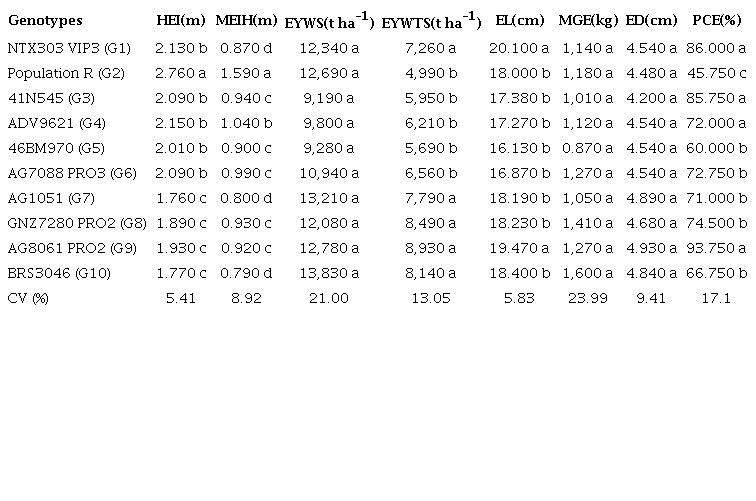
* Means followed by the same letter in the column belong to the same group by the Scott-Knott test at 5 % of probability.
Based on the premise that taller plants led to a reduction in the yield of ears without straw, the genotypes NTX303 VIP3 (G1), AG1051 (G9), GNZ7280 PRO2 (G8), AG8061 PRO2 (G9) and BRS3046 (G10) had the lowest values for main ear insertion height, but higher yields of ears without straw and a good percentage of commercial ears (Table 2).
The Population R (G2) differed significantly from the other genotypes, according to the Scott-Knott test (Table 2), regarding plant height and main ear insertion height, with higher means than the others: 2.76 and 1.59 m, respectively. However, the plants of this genotype showed a lower yield potential than the other genotypes, particularly for ear yield without straw, ear length and percentage of commercial ears. Based on the canonical correlations (Table 1), it is possible to observe a negative correlation among these traits, suggesting that plants taller than 2.0 m tend to yield less. The plants should be medium height in cultivars for growing sweet corn (< 1.90 m). Similar results were observed by Lima et al. (2019), with taller plants (> 2.00 m) showing lower yields of ears without straw.
All the genotypes had ear diameter and ear length higher than the values required by the market (ear diameter greater than 3 cm and ear length greater than or equal to 15 cm) (Rodrigues et al. 2011), a fundamental trait for a fast acceptance in the consumer market (Rodrigues et al. 2018). This variable had no significant correlation with the evaluated vegetative traits (Table 1).
The yield of ears with straw is an important trait, because the straw protects the grains and reduces the damage caused by transporting the ears from the field to the market (Lima et al. 2019). The genotypes AG1051, BRS3046, AG8061 PRO2, GNZ7280 PRO2, Population R, NTX303 VIP3 and AG7088 PRO3 showed ears with excellent protection with straw, reflecting on effective ears protection during development. In addition, these genotypes have a yield of ears with straw of more than 10 t ha-1, indicating their high yield potential. This combination of traits suggests that these genotypes could be highly advantageous for optimizing agricultural production. However, it is important to note that Population R showed a lower yield of ears without straw than the other genotypes, suggesting that resources are being directed towards straw production to the detriment of grain production, what does not correspond to the desired goal.
There were significant differences for plant height, main ear insertion height, ear length, percentage of commercial ears and ear yield without straw by the likelihood-ratio test at 1 % of probability (LRT); therefore, these results indicate the significant existence of genetic variability among the maize genotypes for these variables (Table 3). Phenotypic variance values close to genotypic values indicate less environmental influence on these variables (Dudek et al. 2020).
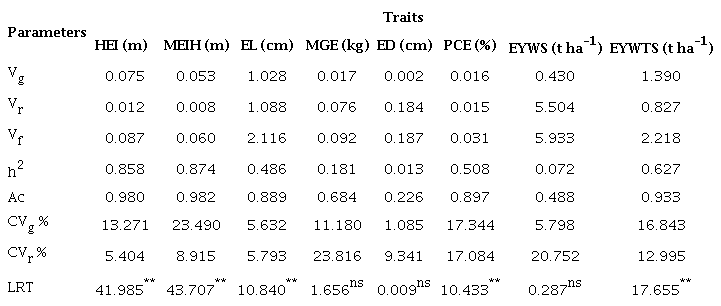
ns not significant).
The coefficient of residual variation (CVr) ranged from 5.40 % for plant height to 23.82 % for grain mass (Table 3). The lower the CV, the more homogeneous the data set. CVs below 10 % are considered low; from 10 to 20 % medium; from 20 to 30 % high; and above 30 % very high (Pimentel-Gomes 1985) (Table 3).
The highest heritability values in the broad sense (h2) occurred for first ear insertion height (0.87) and plant height (0.86). This parameter makes it possible to anticipate what proportion of the phenotypic variation has a genetic origin and will therefore be passed on to subsequent generations (Rodrigues et al. 2011). In this way, these results allow the breeder to select plants with the traits that meet market demands based on these two traits (main ear insertion height and plant height), as they have a high capacity to be passed on to the next generations and are directly correlated with the percentage of commercial ears and yield of ears without straw, which also obtained good results for this parameter (h2) with 0.51 and 0.63, respectively (Table 3).
Rodrigues et al. (2011) reported that high genotypic coefficient of variation (CVg) values are desirable for maize, generally above 7 %, as it is a parameter that quantifies the size of the genetic variation available for selection. The CVg value was higher than this for most of the evaluated traits, except for ear length, ear diameter and ear yield with straw.
Accuracy determines the degree of confidence in the selection and reflects the quality of the results, being the correlation between the predicted genetic values and the true genetic values (Meier et al. 2021). Accuracy was 0.98 for plant height, 0.98 for main ear insertion height, 0.89 for ear length, 0.68 for mass of grains per ear, 0.23 for ear diameter, 0.90 for percentage of commercial ears, 0.49 for ear yield with straw and 0.93 for ear yield without straw (Table 3). Values close to 1 are considered high (Resende & Duarte 2007). Variables with high heritability provide accuracy values of over 90 % (Krause et al. 2020), as seen for plant height, main ear insertion height and ear yield without straw (Table 3).
The genotypic effect of the variables under study is shown in Figure 2 and is observed by the difference between the point and the vertical line, which denotes the overall average of the trait.
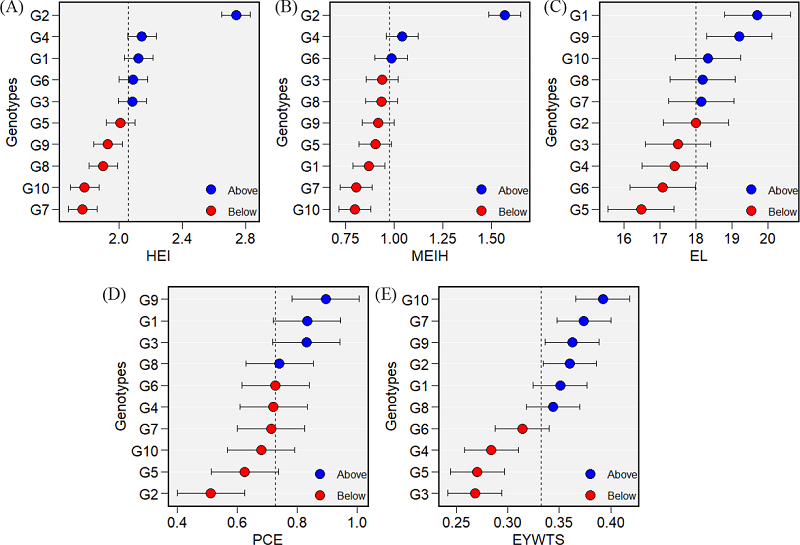
Figure 2
Predicted genetic values for plant height (HEI; m), main ear insertion height (MEIH; m), ear length (EL; cm), percentage of commercial ears (PCE) and yield of ears without straw (EYWTS; t ha-1) for the studied genotypes: G1: NTX303 VIP3; G2: Population R; G3: 41N545; G4: ADV9621; G5: 46BM970; G6: AG7088 PRO3; G7: AG1051; G8: GNZ7280 PRO2; G9: AG8061 PRO2; G10: BRS3046.
For plant height, the Population R (G2) showed the greatest genotypic effect by BLUP, with a significant difference in the BLUP confidence interval (Figure 2B). The genotypic effect for main ear insertion height (Figure 2B) indicated that the Population R (1.59 m) and ADV9621 (1.04 m) genotypes had higher main ear insertion heights than the other genotypes, being statistically different from each other and from the other treatments (Table 2), unlike the genotypes 41N545 (G3), 46BM970 (G5), AG7088 PRO3 (G6), GNZ7280 PRO2 (G8) and AG8061 PRO2 (G9), which showed no statistical differences, with main ear insertion height below average. By analyzing Figures 2A and 2B, it is possible to see that the highest values for main ear insertion height correspond to the tallest plants, as also reported by Campos et al. (2010).
The REML/BLUP based procedures allow a better understanding of the performance of the traits of genotypes, mainly plant height, main ear insertion height and grain yield, indicating that they are variables that do not have interference from the environment, since the environmental effects are not considered in this analysis (Olivoto et al. 2017).
Considering the BLUP for ear length (Figure 2C), the NTX303 VIP3 (G1) and AG8061 PRO2 (G9) genotypes have above-average genetic values and are superior to the others. It is worth noting that this trait showed low heritability and high residual variance (Table 3), indicating difficulty in selecting based on this trait, as well as no significant correlation with the vegetative traits (Table 3).
The results observed in the BLUPs (Figure 2D) for the percentage of commercial ears corroborate those in Table 2, where NTX303 VIP3 (G1), 41N545 (G3), ADV9621 (G4) and AG8061 PRO2 (G9) showed averages with a significant difference by the Scott-Knott test, when compared to the others.
For ear yield without straw, the genotypes NTX303 VIP3 (G1), ADV9621 (G4), AG1051 (G7), GNZ7280 PRO2 (G8), AG8061 PRO2 (G9) and BRS3046 (G10) showed a significant genotypic effect that was higher than the others, according to the confidence intervals (Figure 2E). It should be noted that these genotypes had higher averages, with a significant difference at 5 % by the Scott-Knott test, when compared to the others, except for ADV9621 (G4), confirming the genotypic performance of these genotypes.
It can be seen that the Population R had the highest plant height and main ear insertion height values (Figures 2A and 2B) and, consequently, the lowest values for percentage of commercial ears and ear yield without straw (Figures 2D and 2E). It can also be seen that the AG8061 PRO2 (G9) genotype showed average values for plant height and main ear insertion height, making it the one with the highest yield (Figure 2). Souza et al. (2014) reported that, as the plant grows in height, much of its energy gain is focused on its growth; thus, during the ear production phase, the availability of nutrients will be reduced, so that it is insufficient for the production of ears with the desired commercial traits.
The REML/BLUP analysis aligned with the results found in the canonical correlation analysis (Table 1) and shows the negative correlation between the vegetative variables and yield components (percentage of commercial ears and ear yield without straw). Therefore, to increase the percentage of commercial ears, it is necessary to select plants that do not have above-average plant height and main ear insertion height.
CONCLUSIONS
-
1. Canonical correlations among groups of vegetative traits, such as plant height and main ear insertion height, can be used in direct and indirect selection to indicate plants with higher yields and percentage of commercial ears;
-
2. The selected hybrids with the highest genetic values for percentage of commercial ears are the 41N545 and AG8061 PRO2 genotypes;
-
3. Based on the association of vegetative and yield traits, the AG8061 PRO2 hybrid and BRS3046 have potential to be part of a population-based genetic breeding program for sweet corn.
REFERENCES
ALMEIDA, P. H. S.; VILELA, V. J. V.; TORRES, I. Y.; UBERTI, U.; DELIMA, R. O.; REIS, E. F. dos. Genetic potential of maize populations derived from commercial hybrids for interpopulation breeding. Revista Caatinga, v. 37, e11736, 2024.
ASSOCIAÇÃO BRASILEIRA DAS INDÚSTRIAS DO MILHO (Abimilho). Consumo de milho humano e industrial do Brasil. 2019. Available at: https://www.abimilho.com.br/estatisticas/consumo. Access on: Oct. 14, 2024.
BARETTA, D.; NARDINO, M.; CARVALHO, I. R.; DANIELOWSKI, R.; LUCHE, H. S.; OLIVEIRA, V. F.; SOUZA, V. Q.; OLIVEIRA, A. C.; MAIA, L. C. Characterization of dissimilarity among varieties in Brazilian maize germplasm. Australian Journal of Crop Science, v. 10, n. 12, p. 1601-1607, 2016.
CAMPOS, M. C. C.; SILVA, V. A.; CAVLCANTE, I. H. L.; BECKMANN, M. Z. Produtividade e características agronômicas de cultivares de milho safrinha sob plantio direto no estado de Goiás. Revista Acadêmica de Ciências Agrárias e Ambiental, v. 8, n. 1, p. 77-84, 2010.
CANDIDO, W. dos S.; SILVA, C. M. e; COSTA, M. L.; SILVA, B. E. de A.; MIRANDA, B. L. de; PINTO, J. F. N.; REIS, E. F. dos. Selection indexes in simultaneous increment of yield components in topcross hybrids of green maize. Pesquisa Agropecuária Brasileira, v. 55, e01206, 2020.
CARVALHO, I. R.; SOUZA, V. Q.; NARDINO, M.; FOLLMANN, D. N.; SCHMIDT, D.; BARETTA, D. Correlações canônicas entre características morfológicas e componentes de produção em trigo de duplo propósito. Pesquisa Agropecuária Brasileira, v. 50, n. 8, p. 690-697, 2015.
COMPANHIA NACIONAL DE ABASTECIMENTO (Conab). Acompanhamento da safra brasileira. 2021. Available at: https://www.conab.gov.br/info-agro/safras/graos/boletim-da-safra-de-graos?start=30. Access on: Oct. 14, 2023.
COMPANHIA NACIONAL DE ABASTECIMENTO (Conab). Tabela de dados: produção e balanço de oferta e demanda de grãos: 12º levantamento. 2023. Available at: https://www.conab.gov.br/info-agro/safras/graos/boletim-da-safra-de-graos?start=10. Access on: Oct. 14, 2023.
CREVELARI, J. A.; DURÃES, N. N. L.; BENDIA, L. C. R.; VETTORAZZI, J. C. F.; ENTRINGER, G. C.; FERREIRA JÚNIOR, J. A.; PEREIRA, M. G. Correlations between agronomic traits and path analysis for silage production in maize hybrids. Bragantia, v. 77, n. 2, p. 243-252, 2018.
DUDEK, G.; CHAVES, M. H. M.; LIMA, B. C. de; MARTINS, A. G.; MISSIO, V. C.; MISSIO, R. F. Estimativa de parâmetros genéticos e ganho com seleção em acessos de milho crioulo. Brazilian Journal of Development, v. 6, n. 10, p. 82741-82755, 2020.
EMPRESA BRASILEIRA DE PESQUISA AGROPECUÁRIA (Embrapa). Cultivo do milho-verde irrigado na Baixada Maranhense. 21. ed. Teresina: Embrapa Meio-Norte, 2020.
FOOD AND AGRICULURE ORGANIZATION OF THE UNITED NATIONS (FAO). Internacional soil classification system of naming soils and creating legends for soil maps. Rome: FAO, 2015.
FRIENDLY, M.; FOX, J. Candisc: visualizing generalized canonical discriminant and canonical correlation analysis: R package, version 0.8-6. 2021. Available at: https://CRAN.R-project.org/package=heplots. Access on: Oct. 04, 2024.
GONZÁLEZ, I.; DÉJEAN, S. CCA: canonical correlation analysis: R package, version 1.2.1. 2021. Available at: https://CRAN.R-project.org/package=CCA. Access on: Oct. 04, 2024.
INSTITUTO BRASILEIRO DE GEOGRAFIA E ESTATÍSTICA (IBGE). Censo agropecuário 2017. 2017. Available at: https://sidra.ibge.gov.br/Tabela/9289#resultado. Access on: Oct. 14, 2024.
INSTITUTO BRASILEIRO DE GEOGRAFIA E ESTATÍSTICA (IBGE). Censo Agropecuário 2006. 2006. Available at: https://sidra.ibge.gov.br/Tabela/818#resultado. Access on: Oct. 14, 2024.
KAPPES, C.; ANDRADE, J. A. C.; ARF, O.; OLIVEIRA, A. C. de; ARF, M. V.; FERREIRA, J. P. Desempenho de híbridos de milho em diferentes arranjos espaciais de plantas. Bragantia, v. 70, n. 2, p. 334-343, 2011.
KRAUSE, D. P.; FACHI, L. R.; DALBOSCO, E. Z.; CAMPOS, T. N. V.; FREITAS, A. P.; LIMA, K. S.; KRAUSE, W. Estimativas de parâmetros genéticos e ganhos de seleção em progênies de maracujazeiro via metodologia REML/BLUP. Scientific Electronic Archives, v. 14, n. 5, p. 42-48, 2020.
LIMA, N. G.; MOTA, J. H.; RESENDE, G. M. de; YURI, J. E.; TEIXEIRA, I. R. Avaliação de cultivares de milho para consumo in natura em Jataí - GO. Caderno de Ciências Agrárias, v. 11, p. 1-7, 2019.
LOPES, B. G.; OTOBONI, M. E. F.; VARGAS, P. F.; PAVAN, B. E. Correlação canônica e efeito direto e indireto na seleção de acessos de batata-doce coletados no Vale do Ribeira. Research, Society and Development, v. 11, n. 11, e493111134022, 2022.
MEIER, C.; MARCHIORO, V. S.; MEIRA, D.; OLIVOTO, T.; KLEIN, L. A. Genetic parameters and multiple-trait selection in wheat genotypes. Pesquisa Agropecuária Tropical, v. 51, e67996, 2021.
MOURA, G. B. A.; BRITO, J. I. B.; SOUSA, F. A. S.; CAVALCANTI, E. P.; SILVA, J. L. B.; NASCIMENTO, C. R.; LOPES, P. M. O. Identificação de preditores para as chuvas do setor leste do Nordeste do Brasil utilizando análise de correlação canônica. Revista Brasileira de Geografia Física, v. 13, n. 4, p. 1463-1482, 2020.
OLIVEIRA JUNIOR, L. F. G.; DELIZA, R.; BRESSAN-SMITH, R.; PEREIRA, M. G.; CHIQUIERE, T. B. Seleção de genótipos de milho mais promissores para o consumo in natura. Ciência e Tecnologia de Alimentos, v. 26, n. 1, p. 159-165, 2006.
OLIVEIRA, I. J. de; ATROCH, A. L.; DIAS, M. C.; GUIMARÃES, L. J.; GUIMARÃES, P. E. de O. Seleção de cultivares de milho quanto à produtividade, estabilidade e adaptabilidade no Amazonas. Pesquisa Agropecuária Brasileira, v. 52, n. 6, p. 455-463, 2017.
OLIVOTO, T.; LÚCIO, A. D. Metan: an R package for multi-environment trial analysis. Methods in Ecology and Evolution, v. 11, n. 6, p. 783-789, 2020.
OLIVOTO, T.; NARDINO, M.; CARVALHO, I. R.; FOLLMANN, D. N.; FERRARI, M.; SZARESKI, V. J.; PELEGRIN, A. J.; SOUZA, V. Q. de. REML/BLUP and sequential path analysis in estimating genotypic values and interrelationships among simple maize grain yield-related traits. Genetics and Molecular Research, v 16, n. 1, e28340272, 2017.
PIMENTEL-GOMES, F. Curso de estatística experimental. São Paulo: Nobel, 1985.
R CORE TEAM. R: a language and environment for statistical computing. 2023. Available at: https://www.R-project.org/. Access on: Oct. 04, 2024.
RENCHER, A. C. A review of "Methods of multivariate analysis, second edition". Iie Transactions, v. 37, n. 11, p. 1083-1085, 2005.
RESENDE, M. D. V. de; DUARTE, J. B. Precisão e controle de qualidade em experimentos de avaliação de cultivares. Pesquisa Agropecuária Tropical, v. 37, n. 3, p. 182-194, 2007.
RODRIGUES, F.; MELO, P. G. S.; RESENDE, C. L. P.; MROJINSKI, F.; MENDES, R. C.; SILVA, M. A. Aptidão de híbridos de milho para o consumo in natura. Revista Ciências Agrárias, v. 41, n. 2, p. 484-492, 2018.
RODRIGUES, F.; VON PINHO, R. G.; ALBUQUERQUE, C. J. B.; VON PINHO, E. V. R. Índice de seleção e estimativa de parâmetros genéticos e fenotípicos para características relacionadas com a produção de milho-verde. Ciência e Agrotecnologia, v. 35, n. 2, p. 278-286, 2011.
SANTOS, H. D.; JACOMINE, P.; ANJOS, L.; OLIVEIRA, V.; LUMBRERAS, J.; COELHO, M.; OLIVEIRA, J. Sistema brasileiro de classificação de solos. Brasília, DF: Embrapa, 2018.
SANTOS, N. C. B. dos; CARMO, S. A.; PAVAN, G. M.; KOMURO, L. K.; PEREIRA, L. B.; SOUZA, L. C. D. de. Características agronômicas e de desempenho produtivo de cultivares de milho-verde em sistema orgânico e convencional. Ciências Agrárias, v. 36, n. 3, p. 1807-1822, 2015.
SANTOS, V. B.; LIMA, S. R.; MESQUITA, A. G. G.; FRANKE, I. L.; NEGREIROS, J. R. S.; BEBER, P. M. Seleção genotípica de variedades de milho via metodologia de modelos mistos. Scientia Naturalis, v. 3, n. 1, p. 133-147, 2021.
SILVA, E. H. C.; CANDIDO, W. S.; SANTOS, L. S. Identifying cotton genotypes resistant to Meloidogyne incognita race 3 using Blup. Pesquisa Agropecuária Tropical, v. 52, n. 26, e70515, 2022.
SILVA, M. G. de M.; VIANA, A. P. Alternativas de seleção em população de maracujazeiro-azedo sob seleção recorrente intrapopulacional. Revista Brasileira de Fruticultura, v. 34, n. 2, p. 525-531, 2012.
SOUZA, T. V.; RIBEIRO, C. M.; SCALON, J. D.; GUEDES, F. L. Relações entre componentes de rendimento e características morfológicas de milho. Magistra, v. 26, n. 4, p. 495-506, 2014.