Scientific Note
Received: 23 December 2024
Accepted: 09 April 2025
Published: 26 June 2025
DOI: https://doi.org/10.1590/1983-40632025v5581329
ABSTRACT: The coffee quality has been threatened by phytosanitary and nutritional problems, which have significantly reduced its production and yield. This study aimed to develop a mobile application that allows to create and manage plots using platforms such as Flutter for the front-end and Flask for the back-end, combined with geostatistical techniques to generate semivariograms, kriging and density maps, in order to estimate the spatial distribution and behaviour of a pest, as well as the spatial distribution of the primary macronutrients NPK, so that corrective actions can be taken at the right time, covering specific areas, and reducing environmental impacts, investment costs in fertilizers and pesticides, and helping to increase the coffee yield and quality.
KEYWORDS: Coffea arabica, geostatistical techniques, pest control, density maps.
RESUMO: A qualidade do café tem sido ameaçada por problemas fitossanitários e nutricionais, reduzindo significativamente a sua produção e produtividade. Objetivou-se desenvolver um aplicativo móvel que permita criar e gerir parcelas utilizando plataformas como o Flutter para o front-end e o Flask para o back-end, combinadas com técnicas geoestatísticas para gerar semivariogramas, krigagem e mapas de densidade, com o objetivo de estimar a distribuição espacial e o comportamento de pragas, bem como a distribuição espacial dos macronutrientes primários NPK, a fim de que ações corretivas possam ser tomadas no momento certo, visando áreas específicas, bem como reduzindo impactos ambientais, custos de investimento em fertilizantes e pesticidas, e ajudando a aumentar a produtividade e a qualidade do café.
PALAVRAS-CHAVE: Coffea arabica, técnicas geoestatísticas, controle de pragas, mapas de densidade.
Coffee (Coffea arabica) is crucial to the economy and politics of many developing countries. In Mexico, for example, its cultivation employs more than 500,000 producers in 15 states and 480 municipalities (Mexico 2022).
Despite the adaptive capacity of coffee plants, their cultivation faces many phytosanitary and nutritional threats, with a higher incidence of insect pests, diseases and inadequate use of chemical fertilizers, which affect the profitability of this crop.
Concerning the agricultural sector, mobile applications offer various types of services, such as weather forecast (Romani et al. 2015), which allow technicians and farmers to keep track of their crops by monitoring the lack of water and fertilizers, creating high-resolution images and locating pest insects and diseases. Methodologies have also been used to determine the behaviour and spatial distribution of insect pests and diseases, as well as the spatial distribution of nutrients in the soil by using geostatistics. For example, Ramirez-Dávila et al. (2023) determined the spatial distribution of thrips (Thysanoptera) in avocado (Scirtothrips perseae) by mapping, using geostatistical tools to find the location and mobility patterns of the pest, what resulted in a reduction in the use of agrochemicals and a timely integrated pest management. However, these softwares were only used in laboratories of academic institutions.
In this regard, this study aimed to develop an intuitive and accessible mobile application, called Café VarioApp, for the sustainable management of coffee cultivation.
The implementation of the Café VarioApp mobile application helps coffee producers, technicians and researchers in the timely detection of phytosanitary and nutritional problems, through data collection and accurate analysis, to optimize the production process of orchards in all stages. It ranges from the recording of climatic conditions, general control of pests and diseases, and the creation of density maps for the timely management and nutrition of the crop, optimizing the use of agrochemicals, thus promoting economic savings in inputs and in environmental impact. On the other hand, it is also useful in the diagnosis of phytosanitary problems to carry out a more in-depth investigation, since the application also stores substantial information to analyse soil and climatic factors, based on the influence they have on the epidemiological triangle of a pathogen, which, according to Mora et al. (2021), is composed of three factors: susceptible host; pathogen; and favourable conditions, which are the abiotic factors (variety, management, climate, soil, humidity and temperature). This tells us in which phenological stage of the crop a pathogen can be distributed and what are the multifactorial phenomena attributed by the foci of infection or aggregation centres in specific areas that are shown in the density maps.
The VarioApp allows coffee farmers to monitor and analyse pest incidence and nutrient distribution in their plots. Using modern technologies such as Flutter (Dart) and Flask (Python), combined with geostatistical techniques such as semivariograms, krigeado and density maps, it provides a useful tool for coffee plantation management.
It was developed using an agile methodology that allowed for an iterative process of continuous improvement. By using Flutter for the front-end and Flask for the back-end, an efficient integration was achieved, which made it possible to meet the functional and non-functional requirements of the project, offering a fluid user experience, a robust infrastructure in the back-end, and, therefore, an accessible and easy-to-use interface, since it allows farmers, technicians and researchers, through density maps, to identify, in a timely manner, the incidence of pest insects and diseases, as well as the spatial distributions of primary macronutrients (NPK) in the soil, also forming a complementary tool with the use of soil analysis. In this way, corrective actions can be taken at the right time, reducing investment costs in agrochemicals and environmental impact.
The mobile application represents a feasible platform to establish management strategies for production systems, since it collects, processes and analyses temporal and spatial data, adjusting them with the information collected from data to support management decision-making, considering the variability of the soil and climatic conditions of the area, thus improving the efficiency in the use of resources, as well as the yield, quality, safety and sustainability of coffee production.
To test the application, ten samples were taken per plot, each marked and georeferenced using the geolocation function. The samples were taken in a distributed manner, each one marked and georeferenced with the mobile application (GPS) on a 5,000 m2 plot, in Amatepec, state of Mexico, Mexico. The amounts of macronutrients available in the soil were analysed for N (Semimicro-Kjeldahl), P (Bray & Kurtz) and K (Serrato-Cuevas & Landeros-Flores 2001).
The results of the mobile application were compared with a conventional software, obtaining the values from the databases of the spatial behaviour of coffee rust (Hemileia vastatrix) in Amatepec (Pérez et al. 2023).
The sampling methodology by Moral-García (2004) was used, in which the plot is divided into 10 x 10 m quadrants to have 50 quadrants, and 4 trees are marked and georeferenced in each quadrant for a total of 200 trees per plot.
The estimation of experimental semivariograms was performed with data acquired from databases of georeferenced edaphic samples and pest populations (Journel & Huijbregts 1978, Isaaks & Srivastava 1989).
The experimental semivariogram must be fitted to the theoretical semivariogram, since it is necessary to fit a function to quantify the degree and scale of spatial variation. There are models used in geostatistics, being the most common the spherical, the exponential and the Gaussian models, which have three common parameters that serve to adjust and validate the semivariogram: nugget effect, plateau and range.
Once the experimental semivariogram has been adjusted to one of the described models, it is necessary to validate them. The validation of the model was carried out with the procedure called cross-validation (Isaaks & Srivastava 1989). This method is used to evaluate the degree of goodness of fit among the data.
The level of spatial dependence was calculated by dividing the nugget effect by the plateau, with the result expressed as percentage, to know the degree of relationship among the data (Cambardella et al. 1994). If the result is less than 25 %, the level of spatial dependence is high; if it is between 26 and 75 %, the level of dependence is moderate; and if it is greater than 76 %, the level of spatial dependence is low.
Once the semi-variogram model is validated, the interpolation method called ordinary kriging is used to produce density maps. This interpolation method allows for the unbiased estimation of points where no sampling was performed.
The mobile application, developed with Flutter for the front-end and Flask for the back-end, allows users to create and manage coffee plots. Users can associate studies to these plots, including the location and incidence of pests or nutrient distribution. From these data, semivariograms, kriging and contour maps are generated to estimate pest behaviour and NPK macronutrient distribution in the plot.
Python library models were incorporated for the ordinary krigaedo method and visualization of the maps: ‘pykrige’ for krigaedo; ‘matplotlib’ for visualization; and ‘numpy’ for numerical calculations
Main functionalities: Parcel Creation and Management: users can create new parcels and view existing parcels. Each parcel has information such as name, location and size in m2; Survey Association: surveys contain data on the user’s location within the plot and the amount of pest or nutrient incidence. The data is stored in a database and used to generate geospatial analysis; Semivariogram Generation: semivariograms are used to analyse the spatial structure of pest incidence or nutrient distribution. Variance is calculated as a function of distance among sample points. It uses the ordinary kriging method to interpolate data and estimate values at unsampled locations, and generates a predictive map of pest or nutrient incidence in the plot. Density Maps: visualizes the results of kriging in the form of density maps. Allows users to identify areas of high and low incidence, showing the percentage of area not infested by pests, as well as the distribution of nutrients.
Additional features: Study Creation: users will have the ability to establish new studies or research within the application; Sampling by Pest: in each study and plot, users will be able to carry out specific samples of the pest of their choice; User Location: the mobile device will be used to georeference the user’s current location when entering records of pest incidence and taking soil samples; Geostatistical Calculations: the application will offer tools to calculate geostatistical data, including variance, mean and standard deviation.
Application Structure: Frontend (Flutter) Main Screens: HomeScreen: displays a summary of the parcels; ParcelDetailScreen: details of a specific parcel and its associated studies; and StudyFormScreen: form for entering new studies. Models: Parcel: a model that represents a parcel; Study: a model that represents a study; Incidence: a model that represents a location and its incidence. Services: ApiService: handles communication with the back-end; Back-end (Flask). Main Routes: /semivariogram: handles the generation of semivariograms with automatic adjustment; /custom_semivariogram: handles the generation of semi-variograms with manual adjustment; /generate_contour: generates contour maps using ordinary krigeado using matplotlib.
The spatial distribution of NPK from the values obtained from the analysis of soils sampled from a plot of coffee cultivation in Amatepec are shown on the application screens in Figure 1. The semivariograms are automatically adjusted to any of the models, obtaining nugget, plateau and range effect parameters. Density maps with north and east coordinates are displayed. By means of the scale or coloured bar, the distribution of the nutrients with the highest distribution is shown in red, moderate amounts in blue and absence of nutrients in white. At the bottom of the screen, density maps of the spatial distributions of N, P and K are generated, where it is indicated that N has a greater distribution in the plot, unlike the elements P and K. With this, it can be assumed that it is due to the stage of differentiation of the crop, since it was in the vegetative stage, with N being the macronutrient with the highest demand and, therefore, with the greatest applications made by producers. However, in some areas of the plot, as shown on the screen (blue), they contained low amounts, most likely because, in most of the sampled areas, they have a very steep slope, hence a greater leaching of nutrients.
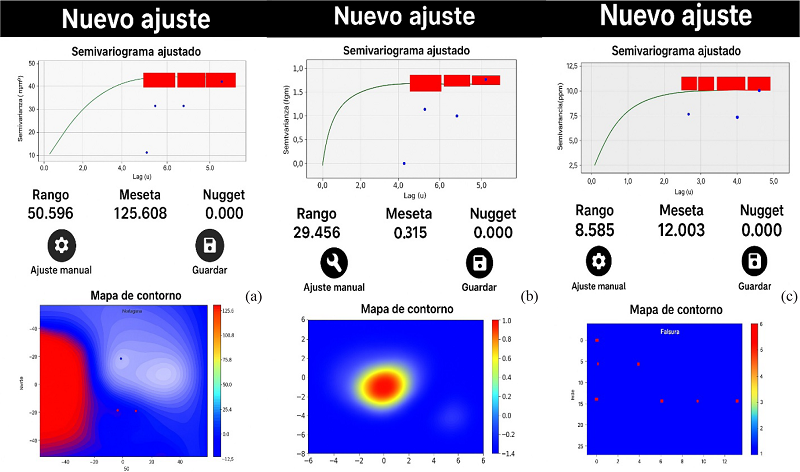
Figure 1
Semivariograms and nitrogen (a), phosphorus (b) and potassium (c) primary macronutrient density maps automatically generated by the mobile application.
Regarding the incidence of pests, the results obtained in the Variowin 2.2 and Surfer 9 softwares were compared to corroborate the efficiency and functionality of the mobile application. To this end, the database of samples of the fungus (Hemileia vastatrix) taken in the municipality of Amatepec was used. In Figure 2, the semi-variogram generated by the application and that generated by the Variowin 2.2 software are displayed, and no significant differences were found in the parameters, giving values for nugget of 0.000, range 8.056 and plateau 11.144. Once the semivariogram is created, the density map is automatically generated via the mobile application.
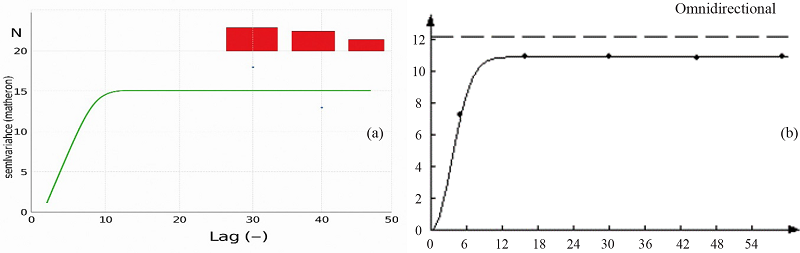
Figure 2
Comparison of the semivariograms developed from the samples of the fungus (Hemileia vastatrix). Semi-variogram automatically adjusted by the mobile application (a) and semi-variogram manually adjusted by the Variowin 2.2 software (b).
Figure 3 shows the density maps generated by the mobile application and the infestation zones, as indicated by the scale. The zones with the highest incidence of rust are shown in red, moderate in blue, and low incidence in white. In the same way, the density map created by the Surfer 9 software is shown, with the highest incidence in dark green, moderate in yellow, and low incidence in white, showing the same areas of pest aggregation as the coordinates marked in the mobile application.
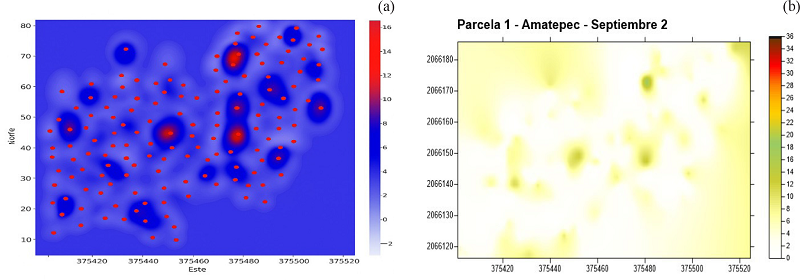
Figure 3
Comparison of density maps: map automatically generated by the mobile application and percentage of surface area not infested (a) and density map generated by the surfer 9 software (b).
The mobile application Café VarioApp can be downloaded free of charge from the Google Play Store.
REFERENCES
CAMBARDELLA, C.; MOORMAN, T.; NOVAK, J.; PARKIN, T.; KARLEN, D; TURCO, R.; KONOPKA, A. Field scale variability of soil properties in central Iwa soils. Soil Science Society of America Journal, v. 58, n. 5, p. 1501-1511, 1994.
CANSECO MARTÍNEZ, D. A.; VILLEGAS APARICIO, Y.; CASTAÑEDA HIDALGO, E.; CARRILLO RODRÍGUEZ, J. C.; ROBLES, C.; SANTIAGO MARTÍNEZ, G. M. Respuesta de Coffea arabica L. a la aplicación de abonos orgánicos y biofertilizantes. Revista Mexicana de Ciencias Agrícolas, v. 11, n. 6, p. 1285-1298, 2020.
ISAAKS, E.; SRIVASTAVA, M. Spatial continuity measures for probabilistic and deterministic geostatistics. Mathematical Geology, v. 20, n. 4, p. 313-341, 1989.
JOURNEL, A.; HUIJBREGTS, C. J. Mining geostatistics. London: Academic Press, 1978.
MEXICO. Secretaria de Agricultura y Desarrollo Rural. Cultivo de café en México. 2022. Available at: https://www.gob.mx/agricultura/articulos/cultivo-de-cafe-en-mexico#:~:text=El%20caf%C3%A9%20es%20uno%20de,de%20muchos%20pa%C3%ADses%20en%20desarrollo. Access in: Mar. 2023.
MORA, G.; ACEVEDO, G.; GUZMÁN, E.; FLORES, O. E.; CORIA, J. J.; MENDOZA, C.; MARTÍNEZ, V. I.; LÓPEZ, A.; GONZÁLEZ, R.; JAVIER, M. A. Sistemas de vigilancia epidemiológicos para interfaz web y aplicaciones en roya del cafeto. Revista Mexicana de Fitopatología, v. 39, n. 3, p. 452-492, 2021.
MORAL-GARCÍA, F. Aplicación de la geoestadística en las ciencias ambientales. Revista Ecosistemas, v. 13, n. 1, p. 78-86, 2004.
PÉREZ-CONSTANTINO, A.; RAMÍREZ-DÁVILA, J. F.; GUTIÉRREZ-RODRÍGUEZ, F.; PÉREZ-LÓPEZ, D. D. J. Comportamiento espacial de roya del cafeto en Amatepec, estado de México. Acta Universitaria, v. 33, e3870, 2023.
RAMÍREZ-DÁVILA, J. F.; ACOSTA-GUADARRAMA, A. D.; TAPIA-RODRIGUEZ, A.; FIGUEROA-FIGUEROA, D. K.; SERRATO-CUEVAS, R. Mapeo del comportamiento espacial de Scirtothrips perseae (Insecta: Thysanoptera) en huertos de aguacate mediante técnicas geoestadísticas. Gazi Entomolojik Arastirmalar Dernegi , v. 25, n. 5, p. 455-465, 2023.
ROMANI, L. A. S.; MAGALHÃES, G.; BAMBINI, M. D.; EVANGELISTA, S. R. M.; Improving digital ecosystems for agriculture. In: INTERNATIONAL CONFERENCE ON MANAGEMENT OF COMPUTATIONAL AND COLLECTIVE INTELLIGENCE IN DIGITAL ECOSYSTEMS, 7., 2015, Caraguatatuba. Proceedings… New York: Association for Computing Machinery, 2015. p. 234-241.
SERRATO-CUEVAS, R.; LANDEROS-FLORES, V. Instructivo para análisis de suelos: propiedades químicas. Toluca de Lerdo: Universidad Autónoma del Estado de México, 2001.
Author notes
