Artículos
Enhancing the repeatability quality of feature detector in epipolar geometry
Mejora de la calidad de repetibilidad del detector de características en geometría epipolar
 A. KUSNADI adhi.kusnadi@umn.ac.id
W. S. KOM wella@umn.ac.id
R. WINANTYO rangga.winantyo@umn.ac.id
I. ZUHDI PANE izpane@gmail.com
A. KUSNADI adhi.kusnadi@umn.ac.id
W. S. KOM wella@umn.ac.id
R. WINANTYO rangga.winantyo@umn.ac.id
I. ZUHDI PANE izpane@gmail.com
Enhancing the repeatability quality of feature detector in epipolar geometry
Utopía y Praxis Latinoamericana, vol. 24, núm. Esp.5, pp. 370-378, 2019
Universidad del Zulia

Esta obra está bajo una Licencia Creative Commons Atribución-NoComercial-CompartirIgual 3.0 Internacional.
Recepción: 01 Octubre 2019
Aprobación: 08 Noviembre 2019
Abstract: This study discusses evaluating the repeatability quality of feature detector algorithms for image key points in epipolar geometry. Although no one has been able to examine performance in this area; hence, the necessity of conducting research based on improvement. In our method, the image format is converted into YCbCr, using only the Y channel, which is then tested with a variety of threshold values, and Weiner algorithm was applied as noise removal. Therefore, to prove the effectiveness, a comparison is made with the test results before and after method implementation, thus, verifying the success of the technique applied.
Keywords: Epipolar Geometry, Feature Detector, Keypoint, Repeatability Quality.
Resumen: Este estudio analiza la evaluación de la calidad de repetibilidad de los algoritmos de detección de características para puntos clave de imagen en geometría epipolar. Aunque nadie ha podido examinar el desempeño en esta área; de ahí la necesidad de realizar investigaciones basadas en la mejora. En nuestro método, el formato de imagen se convierte en YCbCr, utilizando solo el canal Y, que luego se prueba con una variedad de valores umbral, y se aplicó el algoritmo Weiner como eliminación de ruido. Por lo tanto, para probar la efectividad, se realiza una comparación con los resultados de la prueba antes y después de la implementación del método, verificando así el éxito de la técnica aplicada.
Palabras clave: Calidad de repetibilidad, Detector de características, Geometría epipolar, Punto clave.
1.INTRODUCTION
Contemporarily, face recognition is a very common research topic (Maheshkar et al.: 2012), which applies to numerous fields, including law enforcement and physical access control, health and logical approach (Ahmad et al.: 2016). It is a field in biometric recognition that processes behavioral or physiological characteristics, which are unique, in an attempt to determine individuals’ identity (Jain et al.: 2006). There are two approaches, comprising of (1) 2D, which is influenced by environmental conditions, facial orientation, and expressions, as well as makeup. (2) 3D data that helps resolve fundamental problems inherent in the 2D approach (Bronstein et al.: 2003).
3D face recognition has been made using Tof (Time of flight) camera, although the system is unable to be used outdoor, due to backlight (Chincholkar & Bangadkar: 2007; Lietz & Eberhardt: 2017), therefore, another system was developed to overcome this problem, through the use of 2 2D cameras (Alexander et al.: 2018). Furthermore, reconstructing 3D objects requires a minimum of 2 2D images of the same object, which are needed sequentially, using the epipolar geometry method, with accuracy that is highly dependent on similar corresponding key points in both (Seong et al.: 2018). This identification involves the use of a feature detector that is capable of extracting key points from images by analyzing local characteristics centered at a point on the surface. In addition, matching them consists of establishing a set that is based on specific descriptors. Moreover, the main steps in this process are to identify the similarities and search for the most related feature descriptor pairs in two sets (Jain et al.: 2006).
Prior studies (Seong et al.: 2018) discussed this mechanism, based on its use in image recognition, and also measuring accuracy. Besides, some research focused on enhancing its quality (Kumawat & Panda: 2018), through its application to one image only. Meanwhile, a report by Mouats et al. (2018) discussed the characteristics of repeatability in detecting points on two of the same images, one of which experiences a change in angle, and but not to reconstruct the image into a 3D model on epipolar geometry.
This research, therefore, aims at testing a feature detector for the quality of repeatability on two face images of the same object, after conducting pre-processing methods on several images dataset from the database, in an attempt to improve performance. Meanwhile, on instances where face images that are taken from a database are changed to the YCbCr format, only Y channel is used because facial features are available on this channel. The unwanted characteristics are removed through the implementation of global thresholding, and subsequently, the wiener algorithm is used to make sure no more unwanted point lagging occurs. Finally, the image is tested with five popular detector features.
The method performance was successfully tested on two datasets from the database, which include (1) ORL (2) Head Posed, and the effectivity was further exhibited in terms of quality repeatability. The estimation was based on the number of correct and correspondent matches.
Recently, biometric systems have delivered a new aspect to enter control systems, widely used as a reliable and easy tool for users, and one of the most involved is a face (Joshi et al.: 2018). Besides, numerous researchers have offered methods that are capable of increasing the level of security, e.g., the use of a 3D recognition system with a 2D camera. Therefore, an algorithm with the capacity to detect key points was needed for support, and an evaluation of feature detector algorithm performance was derived from the quality of repetition (Qu et al.: 2016).
The Epipolar Geometry theory involving the use of corresponding points between two viewed images in triangulation estimation was conducted to define 3D points in coordinate XYZ. This implementation and 15 key points (Wang & Song: 2014) on database face image are shown in figure 1.
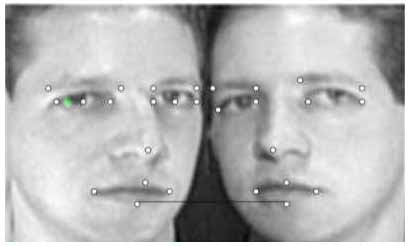
Figure 1. Illustration of Epipolar Geometry implementation and Keypoint on Face Images
It is observed that there are distinctive color formats with uncommon traits, capable of making them reasonable for diverse implementations, and a few well-known examples include RGB, YCbCr, HSV, YUV, L*a*b*. In addition, images are ordinarily portrayed in RGB color format, although in a few applications, they work in others that tend to be more appropriate (Gowda & Yuan: 2018). Furthermore, the utility of YCbCr is based on its ability to decide how the image saw shows up from a simply concentrated or color hue point of view (Zaidan et al.: 2014).
Face pixels have peculiar color characteristics; hence, utilizing color data enhances the possibility of accurately obtaining its feature area. Ordinarily, the regions are darker than other ranges within the picture; therefore, there is a need to require a color format model in order to show it better. Thus, the YCbCr color format, possessing three channels, was utilized, with diverse ranges of channels from RGB (Poynton: 1996). Fig. 2 shows the image in the YCbCr color format, while Fig. 2(b) displays it in the Y channel, and the face area appears very clear in comparison with that of Fig. 2(c) and Fig. 2(d).

Figure 2. Channels in YCbCr format, (a) Original frame, (b) Y color channel, (c) Cb color channel, (d) Cr color channel
Thresholding is a strategy that isolates images pixels into two or more values by comparing each with a predefined limit boundary (Karthick et al.: 2014). Besides, this was applied to reduce weak points through combination into key points. Furthermore, it is also useful to set the number of gray degrees existing in the image, which was determined using formula 1:
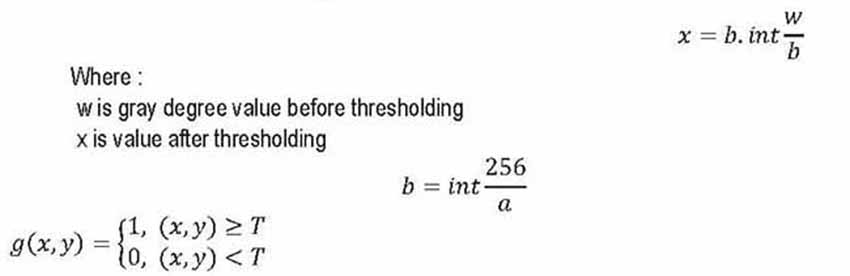
with g(x, y) as a binary image from grayscale f(x, y), while T is mentioned as values threshold, which isdetermined in 3 ways, as follows:
- 1. Global T=T{f(x,y)}, with T depending on the gray level value of a pixel at position x, y.
- 2. Local T =T {A (x, y), f(x, y)} T depends on neighbor pixel property A(x,y) states neighbor pixel value.
- 3. Dynamic T = T {x, y, A (x, y), f (x, y)} where T depends on pixel coordinates.
This study applies the global type.
The main purpose of implementing the Wiener Filtering Algorithm was to remove unwanted residual points after the thresholding process. This classifies the mean and variance around each pixel (Akintoye et al.: 2018), and five feature detectors are used to test the accuracy of key points match, which includes Harris-Stephen, SURF, FAST, Minimum Eigen Value and BRISK Detector.
2. METHODS
Images with 300 angles were accessed from the databases, as they were chosen to construct the 3D shapes in facial recognition. Besides, Matlab R2018a was used as data processing software, using the following procedure:
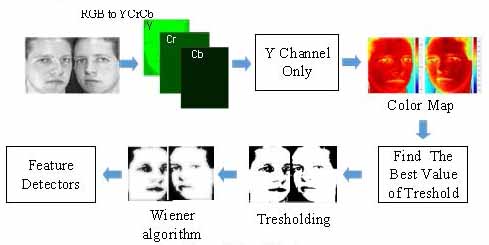
Figure 3. Flow of Method
The procedure is described as follows:
1. The change of RGB color format to YCbCr.The first step to change a red, green, and blue triple (r,g,b) to YCbCr format is to divide the intensity of each by 255, in order for the resulting triple to have values in the interval [0,1]. Furthermore, (r',g',b') = (r/255,g/255,b/255), and the YCbCr color format is then obtained with a matrix (Ban et al.: 2014, pp.1573- 1585), as seen in the equation:
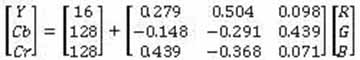
2. Access the Y channel only
This is because the Y channel represents a grayscale color format.
[𝑌] = [16] + [0.279 0.504 0.098][]
3. Image color map was applied to both side images, through the use of threshold value. Therefore, the best was obtained by testing the image result for detectable clarity.
4. Apply the thresholding method to both imagesIdentifying the best T values after testing some values, 0.2, 0.3, 0.4, and those obtained from the use of equation 1.
5. Employ wiener algorithm to remove noise (eq.2)
6. Detect both sides images, using five feature detectors
7. Done.
3.RESULTS
The repeatability quality score for a given pair of images was calculated in an attempt to evaluate the feature detectors’ performance (Hartley & Zisserman: 2000), and this was based on the number of correct, and also correspondent matches. Therefore, the recall and precision are estimated based on the key point match, as shown in the following equation (Tikkanen et al.: 2000):
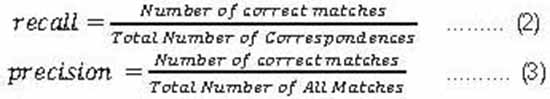
F Score is used to balance the value of Recall and Precision, as seen in the equation below (Sasaki: 2007):
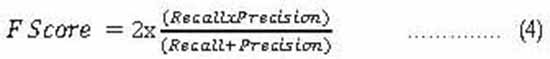
The success of this method was proven through the comparison of value for F score before and after pre-processing the image, and Table 1 contains the initial value.
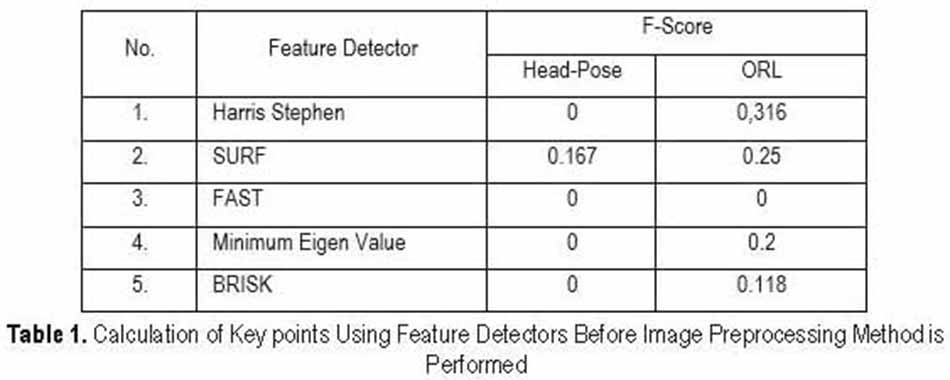
In Table 1, the best value for F score was produced by Harris Stephen Algorithm, while that for the Head- pose dataset was only generated by the SURF algorithm. This was influenced by many factors, including the characteristics of key features, which are not different from other keys on an image, and examples of calculations are explained in table 3, for the ORL dataset.
The explanations to calculations are as follows:
-
Count the number of points and key points on the right and left images after being identified by the feature detector algorithms.
-
Therefore, some images are shown in Fig 5.
-
The correspondent is the point number that aligns between the right and left images.
-
The correct match is the corresponding number of key points between the left and right images.
-
Recall, Precision and F Score are counted based on equations 2, 3 and 4.
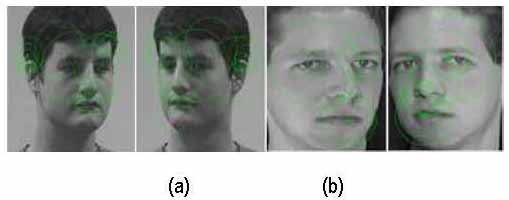
Figure 4. Example of Original Dataset Images Detected by SURF Feature Detector for both Left Image and Right Image. (a) Head Pose Dataset (b) ORL Dataset
Figure 5 shows three pairs of facial images used as a dataset, which were taken from the ORL and Head poses. Table III is, in part result of a feature detector test after the method was implemented for both databases.
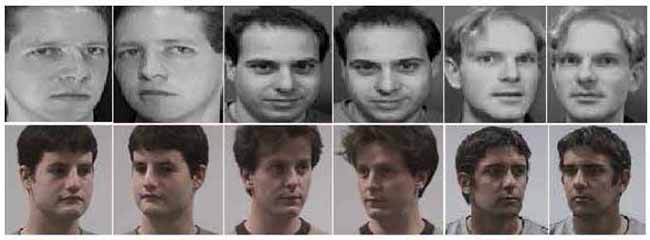
Figure 5. In the first row of face, images are from ORL Database, while the second row was from Head Pose Database
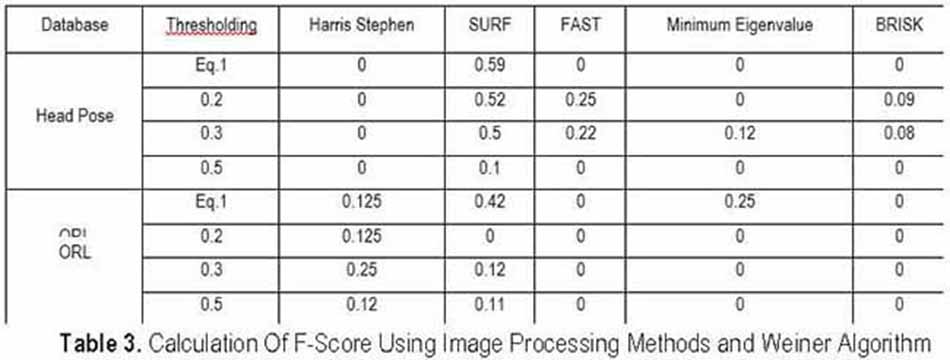
The largest F score was generated by SURF, both for ORL and head pose databases, as seen in TableMeanwhile, for the other two image pairs that produced the same result was generated by the SURF algorithm.
-
ORL Datasets Analysis
The ORL datasets made at the Olivetti Research Laboratory, Cambridge, contained 400 greyscale images for 40 subjects with 10 different images for each. Moreover, a grey level image in ORL possesses a resolution of 112 x 92 pixels, and all images were observed to be aligned in terms of geometric position, although some had an angle of +150, with varying poses, expressions, and wearing glasses or not. This study indicates that face images taken at angles -150 and 150 simulate the epipolar geometry method.
The ideal detector used exhibited 1 for F Score, while the tests performed on the original images obtained the best value at 0.316. Therefore, within the face images, after implementing the method, an increase was observed to 0.5, with the threshold being 0.3 for SUFR algorithm. Meanwhile, F score value on other algorithms indicated an increase, which was also like the FAST algorithm, but not as much increase in comparison with SURF. Furthermore, some algorithms produced value 0, among others Harris Stephen Algorithm, it causes on the fact that the detector identifies numerous non-key points, the algorithms are not able to distinguish between key and non-key points. Our method is unsuccessful in all algorithms, as it only works for the SURF. Implementing image processing methods and Weiner algorithms on the image from ORL database resulted in the increase in the value of F score; to strengthens the evidence, our method was also implemented to the Head Pose database.
-
Head Pose Datasets Analysis
This comprises of 15 sets of face images, where each contains 2 series of 93 faces of the same individual at distinctive poses. In addition, 15 within the database wore glasses, or not, and also possessing different skin coloration. The pose or head position was specified by 2 angles, which changed from -900 degrees to+900. Meanwhile, this test use 2 faces at angles 150 from the left and right. The results obtain the same result as ORL databases test, SURF algorithm gets the highest value, elevated from 0.167 to 0.56, with the use of threshold value 0.3. The explanations are the same with ORL Dataset Analysis.
4.CONCLUSION
Five feature detectors were tested based on their quality of repeatability, using two faces from the same object, which were taken from left and right, in order to simulate epipolar geometry. Furthermore, the detector capacity to recognize key points on the face was observed before and after the implementation of pre- processing, and the removal of noise algorithm. Database face image is taken from ORL and Head Pose, and our methods in proven to increase the value of F Score, with the best being generated by the SURF algorithm, occurring from 0.167 to 0.56, raised 3,6 times and the threshold value 0.3.
BIODATA
ADHI KUSNADI, S.T, M.SI: Adhi started bachelor's degree in 1991. Then in 2005, continued formal master's education at IPB, Indonesia, in the field of Computer Engineering. Currently working as an Informatic lecturer at Universitas Multimedia Nusantara, Indonesia. While being a lecturer, he has produced several publications. Published research topics include Classification and Image processing. His areas of interest are software engineering, information system development, data analytics, and artificial intelligence.
WELLA S.KOM, M.MSI: Wella started his bachelor's degree in 2009, in the field of Information Systems at Multimedia Nusantara University, Indonesia. Then in 2014, he continued his formal master's education at Bina Nusantara University, Indonesia, in the field of Information Systems Management. She is currently working as an Information Systems lecturer at Multimedia Nusantara University, Indonesia, starting from 2015 until now. When he was a lecturer, he produced several publications. Published research topics include IT Governance, Behavior, Classification, and Image Processing. Currently, she is active as a member of the ISACA Academic Advocate Faculty Advisor and managing the ISACA Student Group Universitas Multimedia Nusantara.
RANGGA WINANTYO, PH.D., M.SC, BCS: Rangga, was born in Indonesia in 1980. He received the B.C.S. degree in information technology from the Royal Melbourne Institute of Technology, Australia, in 2004, the M.Sc. degree in new media technology from from International School of New Media, Luebeck, Germany in 2009, the Ph.D. degree in advanced material engineering from the Shizuoka University, Japan, in 2014, and Ph.D. degree in electrical engineering from the Universitas Indonesia, Indonesia, in 2015. He is currently a Senior Lecturer at the Universitas Multimedia Nusantara. His main areas of research interest are augmented reality, renewable energy, and advanced material. Dr. Winantyo is first person who receives two Ph.D. degree in Indonesia.
IVRANSA ZUHDI PANE: Ivransa received Doctor of Engineering (in Electronics) from Graduate School of Information Science and Electrical Engineering, Kyushu University, Japan. He is presently working as senior lecturer in Department of Informatics, Multimedia Nusantara University, Indonesia. His areas of interest are software engineering, information system development, data analytics, and artificial intelligence.
ACKNOWLEDGMENT
The authors gratefully acknowledge the support from Universitas Multimedia Nusantara, Ristek Dikti, for grant PDUPT at the year of 2019 and the students at Universitas Multimedia Nusantara for their assistant towards the completion of the research.
BIBLIOGRAPHY
AHMAD, MI, WOO, WL, & DLAY, S (2016). “Non-stationary feature fusion of face and palmprint multimodal biometrics”, in: Neurocomputing, 177, pp.49-61.
AKINTOYE, KA, ISMIAL, NAFB, OTHMAN, NZSB, RAHIM, MSM, & ABDULLAH, AH (2018). “CompositeMedian Wiener Filter Based Technique for Image Enhancement”, in: Journal of Theoretical & Applied Information Technology, 96(15).
ALEXANDER, L, KUSNADI, A, WELLA, W, WINANTYO, R, & PANE, IZ (2018), December. AuthenticationSystem Using 3D Face With Algorithm DLT and Neural Network. In 2018 Joint 10th International Conference on Soft Computing and Intelligent Systems (SCIS) and 19th International Symposium on Advanced Intelligent Systems (ISIS) (pp. 186-189). IEEE.
BAN, Y, KIM, SK, KIM, S, TOH, KA, & LEE, S (2014). “Face detection based on skin color likelihood”, in:Pattern Recognition, 47(4), pp.1573-1585.
BRONSTEIN, AM, BRONSTEIN, MM, & KIMMEL, R (2003). June. Expression-invariant 3D face recognition. In international conference on Audio-and video-based biometric person authentication (pp. 62-70). Springer, Berlin, Heidelberg.
CHINCHOLKAR, YD, & BANGADKAR, S (2007). A Review of ToF PMD Camera. IJAREEIE, pp.2320-3765.
GOWDA, SN, & YUAN, C (2018). December. ColorNet: Investigating the importance of color spaces for image classification. In Asian Conference on Computer Vision (pp. 581-596). Springer, Cham.
HARTLEY, R, & ZISSERMAN, A (2000). Introduction—-A tour of multple view geometry. In Multiple view geometry in computer vision (Vol. 2, pp. 6-19). Cambridge Univ. Press.
JAIN, AK, ROSS, A, & PANKANTI, S (2006). “Biometrics: a tool for information security”, in: IEEE transactions on information forensics and security, 1(2), pp.125-143.
JOSHI, M, MAZUMDAR, B, & DEY, S (2018). Security vulnerabilities against fingerprint biometric system. arXiv preprint arXiv:1805.07116.
KARTHICK, S, SATHIYASEKAR, K, & PURANEESWARI, A (2014). “A survey based on region based segmentation”, in: International Journal of Engineering Trends and Technology, 7, pp.143-147.
KUMAWAT, A, & PANDA, S (2018). “Feature Detection and Description in Remote Sensing Images using a Hybrid Feature Detector”, in: Procedia computer science, 132, pp.277-287.
LIETZ, H, & EBERHARDT, J (2017). Introduction to Fourier ptychographic imaging for 3D ToF cameras. In Engineering for a Changing World: Proceedings; 59th IWK, Ilmenau Scientific Colloquium, Technische Universität Ilmenau, September 11-15, 2017 (Vol. 59, No. 1.4. 02).
MAHESHKAR, V, KAMBLE, S, AGARWAL, S, & SRIVASTAVA, VK (2012). Feature Image Generation Using Energy Distribution for Face Recognition in Transform Domain. In International Conference on Computer Science and Information Technology (pp. 644-653). Springer, Berlin, Heidelberg.
MOUATS, T, AOUF, N, NAM, D, & VIDAS, S (2018). “Performance Evaluation of Feature Detectors and Descriptors Beyond the Visible”, in: Journal of Intelligent & Robotic Systems, 92(1), pp.33-63.
POYNTON, CA (1996). A technical introduction to digital video. John Wiley & Sons, Inc.
QU, X, SOHEILIAN, B, HABETS, E, & PAPARODITIS, N (2016). EVALUATION OF SIFT AND SURF FORVISION BASED LOCALIZATION. International Archives of the Photogrammetry, Remote Sensing & Spatial Information Sciences, 41.
SASAKI, Y (2007). The truth of the F-measure. Teach Tutor mater, 1(5), pp.1-5.
SEONG, H, CHOI, H, SON, H, & KIM, C (2018). Image-based 3D Building Reconstruction Using A-KAZE Feature Extraction Algorithm. In ISARC. Proceedings of the International Symposium on Automation and Robotics in Construction (Vol. 35, pp. 1-5). IAARC Publications.
TIKKANEN, H, ALAJOUTSIJÄRVI, K, & TÄHTINEN, J (2000). “The concept of satisfaction in industrial markets: a contextual perspective and a case study from the software industry”, in: Industrial Marketing Management, 29(4), pp.373-386.
WANG, Y, & SONG, Y (2014). Facial Key points Detection.
ZAIDAN, AA, AHMAD, NN, KARIM, HA, LARBANI, M, ZAIDAN, BB, & SALI, A (2014). “Image skinsegmentation based on multi-agent learning Bayesian and neural network”, in: Engineering Applications of Artificial Intelligence, 32, pp.136-150.