Artículos
The graphical method of pauses detection in English speech signals
El método gráfico de detección de pausas en señales de habla inglesa
 E.V. MARTYNOVA katerinamarty@yandex.ru
G.R EREMEEVA guzel.ixanova@kpfu.ru
G.F VALIEVA fae_gulnara@bk.ru
E.V. MARTYNOVA katerinamarty@yandex.ru
G.R EREMEEVA guzel.ixanova@kpfu.ru
G.F VALIEVA fae_gulnara@bk.ru
The graphical method of pauses detection in English speech signals
Utopía y Praxis Latinoamericana, vol. 24, núm. Esp.6, pp. 26-31, 2019
Universidad del Zulia

Esta obra está bajo una Licencia Creative Commons Atribución-NoComercial-CompartirIgual 3.0 Internacional.
Recepción: 11 Septiembre 2019
Aprobación: 14 Noviembre 2019
Abstract: This paper is devoted to the problem of pauses detection in English speech signals. The aim of the current study is to create a new method of speech pauses detection that has no drawbacks other algorithms suffer from. The analysis of it suggests the opportunity to use the graphical method in real-time applications. The article provides a new vision and a new solution of pauses detection problem. The result of the study – the graphical method – may be applied to real-time signal processing, text-to-speech synthesis or used to enrich knowledge about the specified problems.
Keywords: English, graphical method, language, speech.
Resumen: Este artículo está dedicado al problema de la detección de pausas en las señales de habla en inglés. El objetivo del estudio es crear un nuevo método de detección de pausas del habla que no tenga inconvenientes de otros algoritmos. Su análisis sugiere la oportunidad de utilizar el método gráfico en aplicaciones en tiempo real. El artículo proporciona una nueva visión y una nueva solución del problema de detección de pausas. El resultado del estudio, el método gráfico, puede aplicarse al procesamiento de señales en tiempo real, la síntesis de texto a voz o utilizarse para enriquecer el conocimiento sobre los problemas especificados.
Palabras clave: habla, idioma, inglés, método gráfico.
1.INTRODUCTION
Every speech signal usually consists of not only speech but also of some noise parts that are no more than pauses of the speaker’s speech in terms of low-quality recording. Pauses are emphasized prolongations– a phenomenon that plays an important role in prosody. Right pausing helps to convey emotions (Cahn:1990, pp. 1-2), control the overall pace of your delivery (Lutfullina, & Makhmutova: 2017, pp. 87-97), engage the audience and make speech understandable to it (Campione, & Véronis:2002, pp. 192-212).
As reasonable pauses placement and duration provide an accurate understanding of speech by a listener,many applications require the development of a reliable model of pauses duration. For instance, in text-to- speech synthesis problems rendering fluent speech appearing realistic to the human ear can be reached only by containing natural-sounding vocal inflection, rhythm and stress placement (Wu, & Lin: 2000, pp. 541-554). The model of pauses duration is also essential for the inverse problem – speech recognition – for proper words and sentences distinction.
In order to produce a model of pauses duration, it is needed to find out how to divide the signal into speech and non-speech parts (pauses) (Bobyreva: 2018, pp. 417-420). There is a vast amount of papers on pauses detection has been published (see survey in (Moattar, & Homayounpour: 2009, pp. 2549-2553)). However, each pauses detection algorithm with its advantages has some disadvantages too. Moreover, all of them seem to be rather mathematically complex and difficult for understanding.
Thus, the aim of the current study is to create a new method of speech pauses detection that has no drawbacks other algorithms suffer from.
2.METHODS
This study considers the analysis of speech signals at the time domain, basing on an idea of visual classification of signal frames into “pause” or “speech”. The comparative research of the method quality is also proposed. It is assumed that the graphical method is not worse or even better than entropy-based algorithm («Robust entropy-based endpoint detection for speech recognition in noisy environments» (Nasibov, & Kinnunen:2012, pp. 8-11), and MULSE-based algorithm («A new robust voice activity detection method based on genetic algorithm» (Li: 2005, pp. 965-974)).
Many studies on pause detection problem have been done. The old methods were based on such features as short-term energy (Shen: 1998), zero-crossing rate (Farsinejad, & Analoui: 2008, pp. 80-84). These features were used due to their low mathematical complexity. However, they had a serious drawback: they strongly depended on a background noise level. So other methods such as spectral entropy-based algorithm (Sohn, & Sung: 1998, pp. 365-368), the method using highest-level statistics (Rabiner, & Sambur: 1975, pp. 297-315) were proposed. It is also offered to use supervised machine learning that usually takes a huge amount of computational resources: CART (Classification and Regression Tree) (Zellner: 1994, pp. 41-62), ANN (Artificial Neural-Network) (Kondrateva, &Nazarova: 2015, pp. 61-65). Besides, some algorithms are no more than the fusion of existing well-known methods (Shin: 2000, pp. 1399-1402).
As every proposed method has its own disadvantages, the current paper investigates a brand newalgorithm – the graphical method of pauses detection in speech signals. There is a need to say it is usual to process signals frame-by-frame. It means that every signal has to be divided into frames (length of the frame is chosen depending on the task). However, the graphical method is processing sample-by-sample. Obviously, it means there is no division to frames, but the signal is been processed by each time that is called sample.
The graphical method is based on a suggestion that non-speech (pauses) frames of the signal arerectangular (see Figure 1).

Fig.1. A pause frame of the signal
At the same time, speech activity frames are bodies of an irregular shape, one is illustrated in Figure 2. Speaking in mathematical terms, rectangular shape of the frame means that the envelope (marked by red at figures 1, 2) of this frame is an almost horizontal line. The derivative of such an envelope is zero or close to zero at each sample. On the contrary, the envelope of the bodies of an irregular shape (speech frames) can be whatever; consequently, generally speaking, the derivative of it is non-zero.
Thus, the graphical method is processing signals sample-by-sample at the time domain and is decidingfor each of it whether it is a speech sample or a pause. The decision rule is formulated as: “if the derivative of the envelope is zero at the current sample, then the sample is considered as a pause; else it is a speech sample”.
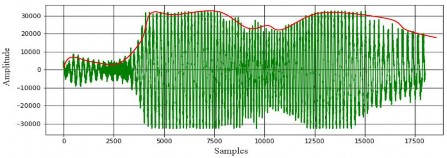
Fig.2. A speech frame of signal
3.RESULTS
The results of the study (the graphical method) may be applied to real-time signal processing, text-to- speech synthesis or used to enrich knowledge about the specified problems.
To examine the accuracy of the methods, the (α, β) values for each of them have been computed. The results obtained are shown in Table 2.
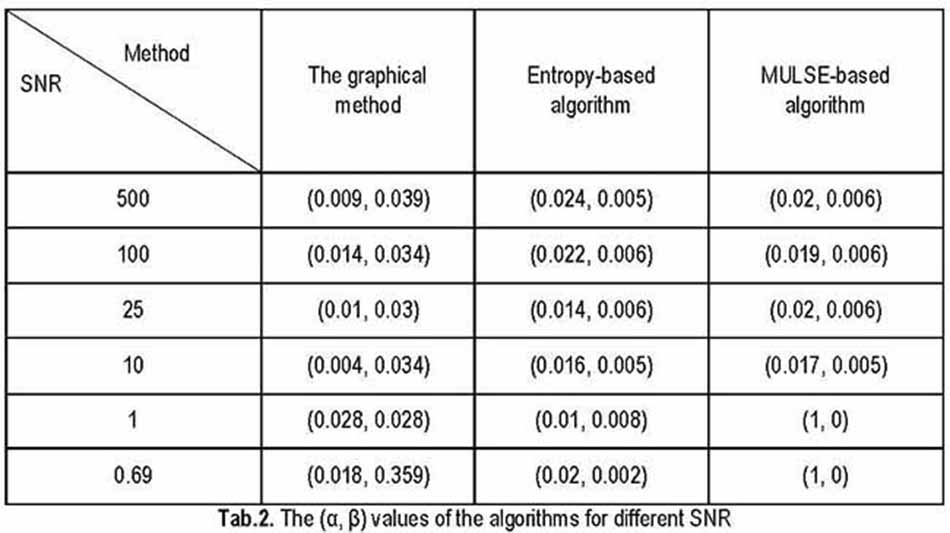
Here the α value means a Type I error (the probability of a speech sample to be mistaken for a pause sample) and the β value is a Type II error (the probability of a pause sample to be mistaken for a speech sample). SNR is the signal-to-noise ratio that is used to compare the level of a signal (actually, speech parts of it) to the level of background noise.
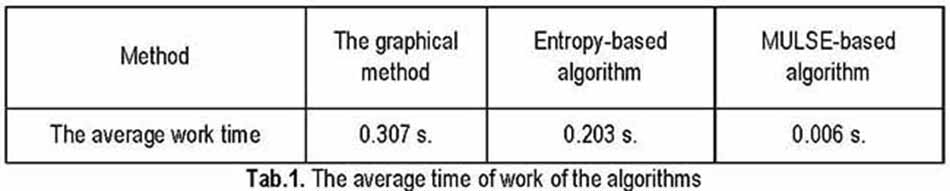
The average time of work the graphical method has is a bit more than the entropy-based algorithm and MULSE-based algorithm have. However, the proposed method is still acceptable for real-time implementation as the average time of work of it is 0.307 s.
The graphical method and the entropy-based algorithm are almost the same in terms of accuracy, i.e. judging by the (α,β)values. The graphical method is evaluated as the best on SNR 10-25. The proposed method tends to give a higher Type II error (β). At the same time, the entropy-based algorithm has a higher Type I error (α). A MULSE-based algorithm is worse in the sense of the (α,β)values. It has the αvalue equal to 1 when SNR ≤ 1, which means each sample is taken as “pause” without depending on what it actually is.
4.CONCLUSION
The results of the testing of the graphical method showed the possibility of its real-time application. In terms of quality, the proposed method is not worse than the entropy-based algorithm and the MULSE-based algorithm. Moreover, it is the best among considered algorithms in conditions of SNR 10-25. The method is still good working even in conditions of low SNR (≤1), when the MULSE-based algorithm becomes inacceptable.
Thus, the graphical method of pauses detection in English speech signals is accurate enough and robust against low SNR conditions. In this, the average time of work of the method is only 0.307 s. that makes it possible to use this algorithm in practice.
Despite the promising results obtained, there are still challenges that need to be addressed. As the time of work remains a weak spot, the reduction of the computational complexity of the method stays as a recommendation for future research. Improvement of the accuracy of the method is also expected.
BIODATA
E.V. MARTYNOVA: Ekaterina Vladimirovna Martynova. In 2006-2012 received higher education at KFU, FIA, teacher of a foreign language with an additional specialty second foreign language. Qualification is a foreign language with an additional specialty. Positions that held are Senior Lecturer, BS at KFU, Institute of International Relations, Department Higher School of Foreign Languages and Translation, Department of Foreign Languages (main employee). Knowledge of languages is English (Fluency), Spanish (Fluency).
G.R. EREMEEVA: Guzel Rinatovna Eremeeva. Born in 07/30/1980. Positions are Associate Professor (Associate Professor), Head University at Institute of International Relations, History and Oriental Studies, department Higher School of Foreign Languages and Translation, Department of Foreign Languages (main). Academic titles are Associate Professor (04/01/2019). Languages are Kazakh (Basic Speaker), English (Proficient Speaker), and Tatar (Independent Speaker).
G.F. VALIEVA: Gulnara Firdusovna Valieva. is a senior teacher of the department of foreign languages of the Institute of International Relations at Kazan Federal University. She devoted more than 8 years to work with future physicists, mathematicians and IT specialists. The author of the book "English for Information Security" and a lot of ELR’s. Certified teacher of EduScrum. Annually gives master classes in educational centers and attends workshops and webinars.
ACKNOWLEDGMENTS
The work is performed according to the Russian Government Program of Competitive Growth of Kazan Federal University.
BIBLIOGRAPHY
BOBYREVA, NN (2018). “Structure, Semantics, and Functions of Linguistic Signs in the Television Graphics of Sports Events Broadcasting”. The Journal of Social Sciences Research, pp. 417-420.
CAHN, JE (1990). "The generation of affect in synthesized speech." Journal of the American Voice I/O Society 8(1 ), pp.1-2.
CAMPIONE, E, & VÉRONIS, J (2002). “A large-scale multilingual study of silent pause duration”. In Speech prosody 2002, international conference. pp. 192-212.
FARSINEJAD, M, & ANALOUI, M (2008). “A new robust voice activity detection method based on genetic algorithm”. In 2008 Australasian Telecommunication Networks and Applications Conference, pp. 80-84.
KONDRATEVA, I, &NAZAROVA, M (2015). “Integration of science and language in teaching English”. Journal of English Language and Literature. 6(3), pp. 61-65.
LI, K, SWAMY, MNS, & AHMAD, MO (2005). “An improved voice activity detection using higher-order statistics”. IEEE Transactions on Speech and Audio Processing, 13(5), pp. 965-974.
LUTFULLINA, ANMGF, & MAKHMUTOVA, A (2017). Dependence of pragmatically implied meaning on aspectual-temporal semantics (based on the English and Russian language material). pp. 87-97.
MOATTAR, MH, & HOMAYOUNPOUR, MM (2009). “A simple but efficient real-time voice activity detection algorithm”. In the 2009 17th European Signal Processing Conference. pp. 2549-2553.
NASIBOV, Z, & KINNUNEN, T (2012). Decision fusion of voice activity detectors. pp. 8-11.
RABINER, LR, & SAMBUR, MR (1975). “An algorithm for determining the endpoints of isolated utterances”. Bell System Technical Journal, 54(2), pp.297-315.
SHEN, JL, HUNG, JW, & LEE, LS (1998). “Robust entropy-based endpoint detection for speech recognition in noisy environments”. In Fifth international conference on spoken language processing
SHIN, WH (2000). “Speech/non-speech classification using multiple features for robust endpoint detection”.Acoustics, Speech, and Signal Processing, 3, pp. 1399-1402.
SOHN, J, & SUNG, W (1998). “A voice activity detector employing soft decision-based noise spectrum adaptation”. In Proceedings of the 1998 IEEE International Conference on Acoustics, Speech and Signal Processing, ICASSP'98 (Cat. No. 98CH36181),1, pp. 365-368.
WU, GD, & LIN, CT (2000). “Word boundary detection with Mel-scale frequency bank in a noisy environment”. IEEE transactions on speech and audio processing, 8(5), pp. 541-554.
ZELLNER, B (1994).”Pauses and the temporal structure of speech”. In Zellner, B.(1994). Pauses and the temporal structure of speech, in E. Keller (Ed.) Fundamentals of speech synthesis and speech recognition. Chichester: John Wiley. pp. 41-62.