Artículos
Strategic Decisions Concerning Subsidiaries and Affiliates in a Group of Companies: Computational Analytical Tools
Decisiones estratégicas sobre subsidiarias y filiales en un grupo de empresas: herramientas analíticas computacionales
 Svetlana Valentinovna IUDINA iudina.s.v@mail.ru
Denis Vladimirovich TSOVMA tsovma.d.v@mail.ru
Svetlana Valentinovna IUDINA iudina.s.v@mail.ru
Denis Vladimirovich TSOVMA tsovma.d.v@mail.ru
Strategic Decisions Concerning Subsidiaries and Affiliates in a Group of Companies: Computational Analytical Tools
Utopía y Praxis Latinoamericana, vol. 25, no. Esp.5, pp. 63-76, 2020
Universidad del Zulia
Received: 24 June 2020
Accepted: 15 July 2020
Abstract: Methodologically, the authors and their colleagues' employ their proposed model of strategic decision- making in groups of companies, which allows one to integrate several critical managerial functions, set clear efficiency criteria for future decisions considering the static and dynamic state of a subsidiary and forecast the development of a group of companies with a view of long-term stable growth of its overall consolidated value and goodwill. This paper offers a systematisation and logical interpretation of indicators transforming the previously published theoretical model as a practical tool approbated on initial empirical evidence.
Keywords: Group of companies, strategic decision- making, subsidiaries and affiliates, corporate management.
Resumen: Metodológicamente, los autores emplean su modelo de toma de decisiones estratégicas y el de sus colegas en grupos de empresas, lo que permite integrar varias funciones gerenciales críticas, establecer criterios claros de eficiencia para decisiones futuras considerando el estado estático y dinámico de una subsidiaria y pronóstico El desarrollo de un grupo de empresas con miras a un crecimiento estable a largo plazo de su valor consolidado general y buena voluntad. Este artículo ofrece una sistematización e interpretación lógica de indicadores que transforman el modelo teórico previamente publicado como una herramienta práctica aprobada en evidencia empírica inicial.
Palabras clave: Grupo de empresas, toma de decisiones estratégicas, filiales y subsidiarias, gestión corporativa..
INTRODUCTION
The need for a balanced analytical information system in strategic decision-making is gaining unprecedented relevance now amid the pursuit of steady and focused efficiency improvement across enterprises of business groups and the focus on raising the overall business value in a stagnating or contracting economy. For a big company in the current economic environment, this may only be achieved with quality information support of strategic decision-making. Quality here implies simultaneous access, at the management level, to timely, reliable and clearly interpretable information on the current situation and the ability to analyse causative relations, draw conclusions and adopt quality strategic decisions.
Referring to the well-known concepts (the concept of strategic management) and approaches (systemic, process-oriented approaches), group management can be described (Tsovma, Iudina: 2019b) by a diverse combination of competences:
-
corporate management including management of subsidiaries through participation in generalshareholders' meetings, nominating candidates to the board, appointment of directors, development of standardised company constituent documents;
-
operational and financial enterprise analysis, including efforts to improve return on equity, return on assets and sales and to bring down operating costs and weighted average capital cost across the group;
-
enterprise value analysis with a focus on raising business valuations (doubling values by 2025 as a strategic initiative), raising EBITDA, increasing the holding's free cash flow and operational efficiency of the asset complex;
-
project management aimed to improve group management efficiency, such as consolidating coresubsidiaries and divesting non-core and non-performing assets. Holding operations are subject to ongoing restructuring, i.e., revisions and adjustments of the existing structure.
LITERATURE REVIEW
Table 1 lays out a systematisation of managerial competences by information support levels.
The purpose of a Decision Support System in a Group Company (DSSGC) is to provide support to the decision-maker in a complex (multicriterion) environment to enhance group management performance. Apart from other traditional requirements set for DSS, an information system should, in our view, meet the following criteria:
- 1. Multidimensional multiparameter analysis capabilities.
- 2. Flexible query structure and wide-ranging reporting options.
- 3. Interactive report visualisation capabilities (visualisation as an analytical instrument).
- 4. Flexible dashboards.
- 5. High data processing rates.
- 6. Forecasting capabilities.
- 7. Potential to integrate artificial intelligence.
As can be seen from Table 1, the DSSGC integrates five modules, including four dedicated to the management of individual subsidiaries or affiliates (hereinafter, S/A) and one for consolidated management of the group of S/A

Proposed by the author
SECTION TITLE
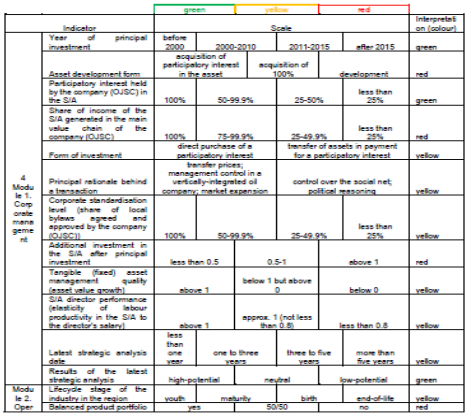
Module 1. S/A adequacy to corporate management of the groupThe subject of analysis primarily comprises qualitative indicators substantiating asset ownership by Tatneft OJSC, the history of key decisions in the S/A operation and the efficiency of its current strategy and top-level management performance. The main indicators serving as reliable gauges in this respect include the following:
1.1. Year of principal investment indicating the duration of the asset history as an S/A of the group. The logic behind tracking this indication may be described as follows. The longer the subsidiary's history and corporate relations, the stronger its economic ties with the parent company and thus distress and risks associated with its sale or liquidation. In the case of Tatneft OJSC, the following stages are proposed: before 2000; 2000 – 2010; 2011 – 2015; after 2015.
1.2. Asset development form. Building "from scratch" or acquiring an operational enterprise is always a matter of efficiency of the owner's decision. In the case of a group of companies, the matter is usually resolved in favour of acquiring a participatory interest of 100% or less in an existing business. There needs to be a convincing case for the parent company to build a new asset, with the substantiation of largely unpredictable cash flows and payback performance of long-term investment amid a largely uncertain environment and risks. Therefore, the levels of corporate management analysis at Tatneft OJSC may be as follows: development, acquisition of 100% of an asset, acquisition of a participatory interest in an asset.
1.3. Participatory interest of the company (OJSC) in the S/A (or the share of the parent company in the capital of the S/A) is calculated as a percentage. Legally and logically, the participatory interest defines the parent company's level of influence and control over the S/A stretching as long as the right of veto over decisions made by the management bodies. The relation between the participatory interest and the level of influence is positive, so the following levels may apply for this item: 100%; 50 – 99.9%; 25 – 50%; less than 25%.
1.4 Share of income of the S/A generated in the main value chain of the company (OJSC). This item serves as an indication of the subsidiary's or affiliate's integration into the main value chain of the parent company, in other words, it is a gauge of vertical integration in the group of companies. The S/A's indicator (percentage) for a period can be calculated as follows:

The following levels of values may be used: 100%; 75 – 99.9%; 25 – 49.9%; under 25%.
1.5 Form of investment. Civil laws of the Russian Federation (Civil Code of the Russian Federation) provide for the following major structures applicable in company consolidations: reorganisation in the form of a merger, setting-up by the partners of a business entity (company or partnership), charter capital increase, acquisition of a "blocking" stake in a business entity under a civil agreement. In case of a group of companies determined above (Tsovma, Iudina: 2019a) as a group of legally independent but affiliated business entities joined under a centralised control system, the most prevalent in Russian practice are the third and the fourth type. Increase of the charter capital (through an additional stock issuance in a joint-stock company, AO, or by means of a third-person capital contribution in a limited liability company, PLC). The procedure includes the management body's decision to increase the charter capital, asset transfer in payment for the respective capital interest (including registration of the title as appropriate), amendments into the articles of association and further registration with the tax authority. The fourth option is suitable for portfolio investments. For Tatneft OJSC, the following levels will be considered: direct acquisition of a participatory interest; asset transfer in payment for a participatory interest.
1.6 Principal rationale behind a transaction Potential reasons for asset development (acquisition) may be classified as market and non-market considerations. Market considerations include transfer prices, managerial control within a vertically-integrated company, market expansion. That said, control over the social net and political reasoning should be classified as non-market considerations. Dominating non-market considerations in acquiring and holding an asset are viewed as a risk factor for the strategic development of a group of companies even in the specific economic environment of modern Russia.
1.7 Corporate standardisation level measured by the share of local bylaws of the S/A agreed and approved by the parent company (as percentage). Local corporate bylaws define the individual legal status of the entity and are adopted by its management bodies. While local corporate bylaws are up to the management bodies, there is still the need to comply with statutory requirements and standards of centralised corporate regulations. In adopting local bylaws, S/As have to consider the distribution of regulatory powers between the management bodies of the parent company, if applicable. In case of Tatneft OJSC, where the level of standardisation across the company in general is quite significant, the applicable levels may be as follows: 100%; 75 – 99.9%; 25 – 49.9%; less than 25%.
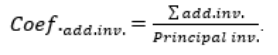
1.8 Additional investment in the S/A after principal investment. The item may be estimated both in absolute terms (which narrows the limits of comparative analyses) and as a relative score, a fraction showing in the numerator the amount of additional investment made by the company (OJSC) over the whole period of relations and in the denominator, the amount of principal investment at the moment of asset development (acquisitio
1.9 Tangible asset management performance (fixed assets less intangible assets) as measured by the index of change (growth rate) of the amount of tangible assets after the moment of principal investment (as a percentage):
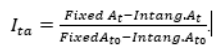
High-quality management will be considered for index readings above 1.
1.10. Director performance assessment in the S/A measured by the level of productivity growth in excess of the director's annual salary growth rate in five years serves as a gauge for the parent company's top management performance in HR decisions. High performance and decision quality are considered where outpacing growth is established (i.e., the relation of growth rates is above 1).
1.11. Latest strategic analysis date indicative of the time period expired after such analysis serves as a gauge to the parent company interest in the efficient long-term development of the asset. Determining the frequency of strategic analysis is not as plain as it may seem. Strategic analysis is necessary as the empirical basis for strategy development for the next 5, 7, 10, 20 years, etc. However, strategy performance control and adjustment are equally important in the changing organisational environment. The proposed scale for this indicator is as follows: less than a year; one to three years; three to five years; more than five years.
1.12. results of the latest strategic analysis can be viewed as the results of a portfolio analysis of the group of companies. The methods of strategic analysis are quite diverse (from BCG and McKinsey matrixes (Evans: 2015) to value chain analyses of companies or industries). Using the aggregated and slightly rephrased terms of various methods, we propose the following reference indications for strategic analysis of subsidiaries: high-potential; neutral; low-potential.
Module 2. Operational management of the S/A. The subject of analysis, again, primarily comprises qualitative indications serving as gauges to the basic aspect and fundamental driver of value generation of the subsidiary. In IFRS, operating activities are the main revenue-producing and other activities of the entity that are not investing or financing activities (IAS 7: n.d.). In the Russian Federation, specifications of the main and additional types of economic activities are based on the All-Russia Classifier of Types of Economic Activity (2014) (OKVED 2), which is part of the National standardisation system of the Russian Federation. OKVED 2 is particularly used in tasks concerned with determining the main and additional types of economic activities pursued by economic entities. An enterprise's OKVED code defines accounting policies, revenue recognition, costing, income tax base calculations and so on. However, in this discussion, the S/A's operating activities define the potential of using non-financial instruments to raise asset value: through the expansion of customer base, restoration and consolidation of production capacity, balancing and optimisation of the product portfolio, enhancement of labour productivity, etc.
2.1. Lifecycle stage of the product (industry) in the region. Determining the market development stage isimportant as a reference for comparing the individual operational performance of the organisation versus the aggregate indicators for the industry (region). In this case, overly fragmented lifecycle stages and phases may lead to inaccurate attribution and errors in perceiving certain trends as specific characteristics of stages. Thus, the recommended approach is marking only four main stages, namely: birth, youth, maturity and end-of-life.
2.2 Balanced product portfolio is understood as an indicator of positive and growing profitability of the product portfolio measured as the average profitability of products (services) weighted by monetary sales volumes of the respective products:
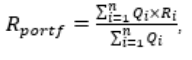
where Qi is the product volume of the i-th item in monetary terms;Ri is the profitability of the i-th product (service) calculated similarly to the return on sales:
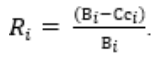
The item can be calculated as the average return on individual products (services) weighted by the respective physical sales volume. For this purpose, to obtain comparable assessments for a diverse range of products, the method of reference equivalents is used.
If the level is negative in the three previous years and shows no positive trend, the interpretation is that of an unbalanced product portfolio. If there is steady positive growth, such a case is considered as a balanced product portfolio. An interim result is considered as 50/50.
2.3. The company's pricing mechanism is assessed based on market orientation. Assume the S/A appliesprimarily market-based pricing (or based on marketing) for a majority of its products or services, i.e., the primary reference for the enterprise in setting wholesale/retail prices is competitive pricing driving the overallsituation toward market equilibrium. Then, from the group's perspective, such subsidiary is less affected by risks of political decisions and shows more independence and adaptability to changing external conditions. Thus, the following reference levels are proposed for this item: market-based (based on marketing outcomes), costs plus a profit margin and transfer pricing (to recover costs).
2.4 Production in physical terms is tracked using production rates (indices) for the main product (service) groups. A negative trend during three years is viewed as a negative.
2.5 Relative productivity measured as the ratio of productivity among the employees of the S/A in the reporting period to the respective industry average. Labour productivity is calculated according to the methodology of the Russian Federal State Statistics Service (Rosstat) (Order of the Ministry of Economic Development of the Russian Federation No. 748: 2018). It is deemed favourable if the item is above 1.
2.6. The enterprise's competitive position in the local (regional) market is one of the crucial characteristics of the organisational environment. The following indicator is proposed as a gauge:
where the first multiplier is the S/A's market share expressed as a fraction;
Nc is the number of direct competitors.
A value above 1 indicates the S/A's leading positions in the local (regional) market.
2.7. An assessment of the adequacy of the production strategy should refer to a principal methodological regulation on the subject. Some authors believe (Avdeeva: 2010), the basic principle is a balance of production capacity, labour and output. In line with the above, the following types of product strategies are distinguished:
-
the demand-following strategy ensuring appropriate levels of output for the moment (subject to stable inventories, the level of production matches demand in the market);
-
the steady production strategy focused on maintaining a stable level of output over a long period (equivalent to a long-term demand average);
-
the subcontracting strategy consisting in maintaining an acceptable minimum level of production (with subcontractors engaged to cover occasional supply deficits);
-
the hybrid strategy being a combination of the above approaches.
In our view, any of the three first production strategies may be reasonable for an S/A. The fourth strategy is not efficient for a small enterprise and is fraught with considerable risks of a deficit or inefficient operation of production capacities.
The adequacy of the S/A's production strategy to the internal or external economic conditions can be rated by experts as complete, 50/50 or absent.
2.8. Reserves for activation (expansion) of operating activities primarily refer to capabilities for scaling up and can be rated by experts as available or absent.
2.9. The enterprise's buffer zone (as a percentage of actual revenues) is relevant both as an independent gauge and in correspondence with the previous item, as it shows what sales contraction the enterprise may weather without running the risks of losses and to what extent it may be necessary for the enterprise to sustain a continued increase of fixed costs as required for production growth. The adequacy of the buffer zone depends on numerous factors, including: industry (less asset-intensive industries have to ensure wider buffer zones), lifecycle stage (young growing businesses may allow narrower buffer zones), overall enterprise strategy (aggressive strategies may justify narrower buffer zones), etc. Therefore, instead of assessing buffer zone dynamics over time, a viable approach is to focus on the divergence in buffer zone levels between the S/A and the parent company:

A negative deviation indicates relative risks of the asset. If the trend becomes even more remarkable over a three-to-five-year cycle, this should be a serious concern for the top management of the group.
Module 3. Current financial analysis of the S/A. The subject of analysis primarily comprises qualitative indications, which, cumulatively, given sufficient input, can serve for not only analytical but, beyond, forecasting purposes. Today, the methodologies of financial analysis include calculations of approximately 100 of interrelated indicators. In line with the optimum principle, the proposition is to calculate a limited number of items.
3.1. Balance sheet liquidity ratios are significant as a measure of the adequacy of the S/A's assets tocover its liabilities.
3.1.1. General liquidity of the balance sheet indicating the ratio of the total liquid assets weighted by significance to the total liabilities weighted similarly (short-term, mid-term, long-term). The traditional formula is as follows (Savitskaya: 2000). Depending on the industry, the normal value is understood to be in the range from 1.5 to 2.5.
3.1.2 Working capital ratio reflects the proportion of net working capital in all current assets. This item is indicative of the performance of financial management at the S/A, as it shows whether the enterprise has sufficient working capital to finance its current operations or may require external assistance, particularly from the parent company. The statutory norm (Regulation of the Federal Administration for Insolvencies (Bankruptcies) No. 31-r: 1994) of net working capital adequacy ratio is above 0.1.
3.2. Financial stability is viewed as a major factor of business stability in the modern theory and practice of economic analysis.
3.2.1 Financial leverage indicates the proportion of debt to equity in an organisation. In Russian practice, the optimal value of financial leverage is 1. Values up to 2 are deemed acceptable. Globally, the typical level of financial leverage is 1.5.
3.2.2. Equity ratio is significant as a measure of financial independence of the S/A. The conventionalnormal level of equity ratio in Russian practice is 0.5 or above. For developed economies, equity levels down to 30-40% are deemed acceptable.
3.3. Business activity level is a characteristic of asset performance and pace of economic operations. The proposed gauge is the asset turnover rate indicating how many complete cycles of production and exchange occur within a period. The normal rate, again, depends on the industry. Therefore, the item should be observed in dynamics and, where possible, compared between the S/A and its direct competitors.
3.4 Return on sales (ROS) as a measure of financial performance indicating the share of profit inrevenues can be calculated and analysed by various methods. For the DSSGC, the proposed option for calculations, decision-making and forecasting is to use operating margin, or, according to the Russian Accounting Standards, sales profit margin, which is based on profit on sales. This indicator allows excluding all other activities (specifically financial activities) from the factors of S/A performance. The optimal level largely depends on the industry. Therefore, as with many other examples, the proposed approach is to use dynamic observations or comparisons against industry averages.
3.5 Return on assets (ROA) is widely covered in the public domain. Note again that the DSSGC should logically emphasise return on operating assets, which are understood as assets immediately employed in the enterprise's core (operating) activities.
3.6. Cost intensity is not a common measure in global macroeconomic analysis practices. However, it may be quite efficient to use it in comparative analyses of cost levels in groups of diverse companies. It shows the proportion of total unit costs (including production and commercial costs (cost)) to the value of production in actual prices (revenue). Cost intensity measures should be at least below 1. For any S/A, any major deviation in the measure from the overall group level or any sharp increase (especially a major gap toward 1) should be closely followed by analysts and decision-makers.
Module 4. Company and business valuations. The International Valuation Standards Committee identifies(International Valuation Standard Council: 2010) three approaches to asset valuation: the direct marketcomparison approach, the income approach and the cost approach. The first approach is based on comparing the asset in question to similar assets for which reliable price data is available. The second approach measures the expected income generated as a result of asset operation. The third approach is based on the calculation of costs to be incurred for full replacement or restoration of the asset.
4.1. S/A asset performance. Asset values in the DSSGC will integrate all fixed assets of S/A (including intangible assets), inventories and cash. The measure of asset performance should be the annual total cash flow (across activity types) generated per 1 thousand roubles of asset value:
Optimal levels can be determined in approbation. However, the likely proposition is to measure the item's dynamics against the group average.
4.2. Five-year cash flow forecast. The key parameters in this forecasting model are free cash flow and the discount factor. Cash flow forecasting can be done using the linear regression method. The forecast item may be pre-tax profit or cash flow generated by net profit, depreciation and balance of investment activities, working capital and investments. The discounted cash flow method presumes that the current value of assets is equivalent to the present value of the future cash flows generated by the assets. The ultimate assessment measure is the index of growth of the annual cash flow in five years from the current moment. The scale of exact levels can be developed in approbation.
4.3. General valuation of the S/A. Given that a majority of S/As are non-public companies, any business (and enterprise) valuation methods relying primarily on market stock prices are non-applicable. The income approach seems to be the best choice for a fair valuation of a private business. Results of approbation of new valuation approaches are published from time to time, specifically, (Kozyr: 2011) the hybrid cost and income approach to enterprise valuations. The fundamental principle of the income approach is the principle of expectation: any asset acquired with the purpose of income generation will have exactly the value equivalent to the future profit it generates adjusted for the time factor.
4.4. Latest investment performance is meant to measure the S/A's success in running investment projects. The two main proposed measures are net discounted income and investment profitability index.
4.5. Growth reserves in the market (industry) of S/A operations can be determined based on market volume index:
Market volumes can be easily determined based on official GDP data by OKVED c
Module 5. Project management. The S/A development outlook depends not only on favourable external conditions and enterprise potential but also on the ability of the management to exploit available opportunities. Thus, a separate appraisal should be focused on the abilities of the management team to operate with dynamic characteristics, specifically the skills of efficient goal-setting and performance on the set objectives, team management, budget supervision, time management, etc.
5.1. The number of projects at the S/A (as of a specified date) may be indicative of both project activity and initiative levels of the management team and the levels of confidence shown by the group leadership. The absolute figure (number of projects irrespective of the budgets and timelines) can be compared with the average across all S/A. Projects run by the parent company should be excluded.
5.2. Project success rate over the past five years (as a percentage) can be determined as a proportion of complete successful projects finished on time and within budget (without additional allocations) to total projects launched by the S/A:

5.3. The impact of the S/A's running (complete) projects for the group's net profit can be measured by the percent deviation of actual net profit at the group level from the model net profit estimate without project completion in the current year.
APPROBATION OF ANALYTICAL INSTRUMENTS
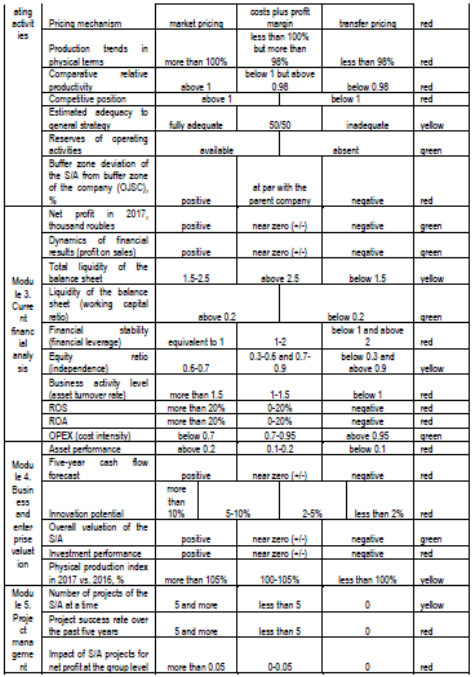
The above indicators are diverse by their nature. They include both qualitative and quantitative indicators. Some of them are measurable (i.e., they are captured and registered, e.g., year of manufacture and revenue), some are calculated in more or less sophisticated ways (e.g., financial ratios). Several indicators can be only assessed by experts (e.g., general strategic adequacy). However, there has to be a compromise between all these indicators. For that, the following scale of three levels should apply at this stage: good (green), satisfactory (yellow), bad (red).
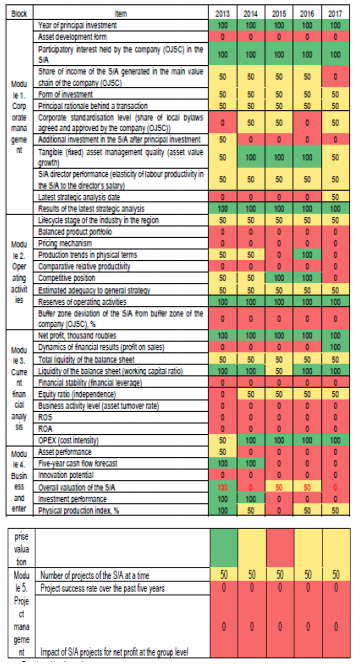
Calculations for individual cases of S/A supply more scientifically-based evidence for strategic enterprise analysis (Table 2), while continued calculations over five years help to establish stable trends in enterprise development and improve the quality of plans and forecasts (Table 3).
Calculated by the authors
The scope of approbation should be expanded to a much larger number of S/A to develop more precise scales and analytical tools to consolidate data and establish the overall impact of S/A for the valuations of the parent company. In case there is sufficient historical data, artificial intelligence can be used in forecasting.
Developed by the authors
CONCLUSION
Thus, the above operational measures of subsidiaries and affiliates from the perspective of the parent company, in our view, appear as objective gauges and, taken together, contribute to more precise appraisals of assets of a public company. These methodological principles make the foundation of research conducted now.
BIODATA
Svetlana Valentinovna IUDINA: Professor, Department of Economics of Mechanical Engineering. “Kazan National Research Technical University named after A.N. Tupolev-KAI ”(Almetyevsk branch). Scientific interests: intellectual work management.
Denis Vladimirovich TSOVMA: Deputy Head of the Asset Management Division of the Corporate Center for Integrated Business Development, TATNEFT PJSC. Scientific interests: Arts and Humanities, Sociology and Political Science.
BIBLIOGRAPHY
ALL-RUSSIA CLASSIFIER OF TYPES OF ECONOMIC ACTIVITY OK 029-2014. (2014). Available:https://www.regfile.ru/okved2.html (accessed 15.07.2019).
AVDEEVA, T.V. (2010). Razvitie proizvodstvennoi strategii promyshlennogo predpriyatiya [Production strategy development at an industrial enterprise]: Author's abstract of the dissertation in candidacy for a degree of Candidate of Economic Sciences: 08.00.05. Saratov State Socio-Economic University, Saratov, 23 p.
CIVIL CODE OF THE RUSSIAN FEDERATION (specifically, article 57).
EVANS, V. (2015). Klyuchevye strategicheskie instrumenty: 88 instrumentov, kotorye dolzhen znat menedzher [Key Strategy Tools: The 80+ Tools for Every Manager to Build a Winning Strategy (Russian transl.)]. Moscow: Binom. Laboratoriya znanii, 456 p.
IAS 7. (n.d.). Cash Flow Statements. Available: https://fin-accounting.ru/ifrs/ias7International Valuation Standard Council. (2010). Proposed New International Valuation Standards. Exposure Draft.
KOZYR, IU.V. (2011). Razvitie metodologii otsenki stoimosti biznesa i kompanii [Development of the methodology of business and enterprise valuation]: Author's abstract of the dissertation in candidacy for a degree of Doctor of Economic Sciences: 08.00.13. Institute for System Analysis, Russian Academy of Sciences, Moscow, 59 p.
ORDER OF THE MINISTRY OF ECONOMIC DEVELOPMENT OF THE RUSSIAN FEDERATION NO. 748.(December 28, 2018). “On approval of productivity calculation methodologies for enterprises, industries, federal subjects of the Russian Federation and calculation methodologies of individual indicators of the LaborProductivity and Employment Support national project”. Available: http://www.gks.ru/metod/naz- proekt/MET100005.pdf (accessed 15.07.2019).
REGULATION OF THE FEDERAL ADMINISTRATION FOR INSOLVENCIES (Bankruptcies) No. 31-r.(August 12, 1994). Methodological regulations on assessing the financial position of enterprises and establishing unsatisfactory structure of the balance sheet.
SAVITSKAYA, G.V. (2000). Analiz khozyaistvennoi deyatelnosti predpriyatiya [Economic analysis of an enterprise]. 4th edition, revised and enlarged. Minsk: Novoe znanie, PLC, 688 p.
TSOVMA, D.V., IUDINA, S.V. (2019a). K voprosu ob opredelenii gruppy kompanii kak bolshoi i slozhnoi sistemy [Revisiting the approach to a group of companies as a big and complex system]. Problemy teorii i praktiki upravleniya [Problems of theory and practice of management], 1, 81-91.
TSOVMA, D.V., IUDINA, S.V. (2019b). Strategic Decision Making in the Corporation and Its Infrastructure Provision: A System Model. International Journal of Engineering and Advanced Technology, 8(5), 1672-1676.