Artículos
Economic Development Indicators on Sharia Financial Inclusion in the OIC Countries
Indicadores de desarrollo económico para la Inclusión financiera de la sharia en los países de la OIC
 M. PUDJIHARDJO mpudjihardjoub@gmail.com
DESI TRI KURNIAWATI desirayhan@gmail.com
ANGGA ERLANDO angga.erlando@feb.unair.ac.id
M. PUDJIHARDJO mpudjihardjoub@gmail.com
DESI TRI KURNIAWATI desirayhan@gmail.com
ANGGA ERLANDO angga.erlando@feb.unair.ac.id
Economic Development Indicators on Sharia Financial Inclusion in the OIC Countries
Utopía y Praxis Latinoamericana, vol. 26, no. Esp.1, pp. 286-301, 2021
Universidad del Zulia

This work is licensed under Creative Commons Attribution-NonCommercial-ShareAlike 4.0 International.
Received: 12 December 2020
Accepted: 15 February 2021
Abstract: This study aims to analyze the determinants of economic indicators, which may influence Sharia financial inclusion through the independent calculation of the corresponding Index. Furthermore, it has two important steps of determining the Sharia Financial Inclusion Index (SFII) on each OIC countries (using 30 countries) in 2010-2019 (total 330 observations). It describes the impact of economic development indicators towards SFII and the impact of development indicators by considering different technology. The results showed that the selected economic variables have a determination towards the SFII condition on the OIC member sample countries.
Keywords: determinants, economic development, SFII, VAR panel, index, OIC.
Resumen: Este estudio tiene como objetivo analizar los determinantes de los indicadores económicos, que pueden influir en la inclusión financiera de la Sharia a través del cálculo independiente del Índice correspondiente. Además, tiene dos pasos importantes para determinar el Índice de inclusión financiera de la Sharia (SFII) en cada país de la OCI (utilizando 30 países) en 2010-2019 (un total de 330 observaciones). Describe el impacto de los indicadores de desarrollo económico hacia el SFII y el impacto de desarrollo al considerar diferentes tecnologías. Los resultados mostraron que las variables económicas seleccionadas tienen una determinación hacia la condición SFII en los países miembros de la muestra de la OCI.
Palabras clave: determinantes, desarrollo económico, SFII, panel VAR, índice, OIC.
INTRODUCTION
The evolution of time favors the position of the financial sector concerning economic development under several assumptions. There are many views that the financial sector influences economic development, such as domestic savings, capital accumulation, technological innovation, and income growth (Honohan, 2004; DFID: 2004; Levine: 2004). Unsurprisingly, development is expected to lead to a “financial inclusion” condition, which according to Kim et al. (2018, pp. 1-14) is “...ease of accessibility and availability of the formal financial services, such as bank deposit, credits, insurance, etc., for all participants in an economy.” Therefore, there is a form of easy accessibility and availability of formal financial services, such as bank deposits, credit, insurance, and others, for actors, especially the middle and lower class, to promote economic development. Schumpeter (Schumpeter: 1911), Gurley and Shaw (Gurley & Shaw: 1955, pp. 515–538), and McKinnon (McKinnon: 1973) traced the rationality behind growth since the economy works with an easily accessible capital boost. Meanwhile, Romer (Romer: 1986, pp. 1002−1037) considered this as a financial sector's role in promoting endogenous growth through the positive impact of capital accumulation, investment, and saving levels. In the future, other factors such as financial technology innovation can also develop in driving economic growth (Grossman & Helpman: 1991, pp. 43−61; Aghion & Howitt: 1992, pp. 323–351). Conversely, Robinson (Robinson: 1952) stated that when company profits grow well, it can encourage financial development conditions in society. Therefore economic development is not caused by finance but responds to demands from the real sector. Similarly, Lucas (Lucas: 1988, pp. 3-42) also stated that the contribution of financial markets to economic development is a clear proposition to discuss empirically.
Financial inclusion emerged as a difficult process for social groups and individuals to gain formal systemaccess. According to Sarma (Sarma: 2012), it is a process that ensures easy access, availability, and benefits from the system for all economic actors. Similarly, Demirguc-Kunt et al. (Demirguc-Kunt et al.: 2014) described financial inclusion as a process of ensuring that products and services are responsive to the needs of all people in general, including economically weak communities and groups.
Based on the OIC member countries' context, financial inclusion is the respective national strategy to promote economic growth through equitable income distribution, poverty reduction, and financial system stability (Hadad et al.: 2011) through the transformation of an easily accessible Islamic system. The aim is to ensure that every individual has the right to access the full range of high-quality financial services at affordable costs. In addition, it aims to pay close attention to the low-income poor, the productive poor, migrant workers, and people living in remote areas. Several existing studies have linked at least three points of financial inclusion, such as access, community groups, and the financial system (Demirgüç-Kunt et al.: 2014; Sarma & Pais: 2011; Sarma: 2012; Demirgüç-Kunt et al.: 2017). Based on these three elements, this study defines financial inclusion as a process to ensure poor people's access to various system services. Furthermore, Sarma and Pais (Sarma & Pais: 2011) found that it connects people, especially the poor and vulnerable, to the formal banking system with safe, easy, and affordable access to credit and other financial services.
Some literature tries to measure the extent of financial inclusion between countries (Sarma: 2012). Initially, the first analysis was conducted on the Global Financial Inclusion (Global Index) database, which was used in 148 economies by Demirguc-Kunt and Keppler (Demirguc-Kunt & Keppler: 2012). The results show that 50% of adults worldwide use formal financial services, and more than 2.5 billion adults do not have a formal financial services account. However, partial and incomplete information from the micro-level analysis can lead to misinterpretation about the extent from a macro perspective. Furthermore, Sarma (Sarma: 2012) developed an Index Financial Inclusion (IFI) calculation method to compare the level between countries or provinces within a country in a certain period. This method fulfills the assumptions of comparability, mathematical properties, and three dimensions (accessibility, availability, and usage of banking services).
The IFI calculation developed by Sarma (Sarma: 2012) is based on three dimensions such as banking penetration, availability of services, and usability. The World Bank established IFI as an alternative way of measuring financial inclusion using a multidimensional index based on macroeconomic data, especially on the reach of banking services. Index Financial Inclusion (IFI) measurement is an effort made to combine various indicators of the banking sector. Therefore, IFI can combine some information on various inclusive financial system dimensions, such as access, usage, and availability of banking services.
The Dimension measured the ability related to the actual usage of financial products and services,including regularity, frequency, and duration of use. The indicators used are; total accounts of Third Party Funds (DPK) consisting of deposits, current accounts, and savings per 1,000 adult population; and the number of credit accounts per 1,000 adult population. Meanwhile, the Quality Dimension is used to determine the availability of the financial product and service attributes that have fulfilled customer requirements. It is still difficult to measure this dimension, and there are currently several international institutions that deal with the development of financial inclusion and indicators of the quality dimension with the tools used. Generally, The Alliance for Financial Inclusion (AFI) has agreed on the principles used in developing indicators from the quality dimension, including conciseness, specificity, simplicity, improvement, and client perspective. In other literature, such as in Sarma (Sarma: 2012), indicators or measurement dimensions in the Index Financial Inclusion (IFI) calculation method in the form of accessibility (penetration), availability (availability), and usage of banking services were used. The penetration dimension is represented by the number of deposit accounts per 1,000 adult population. The availability dimension is represented by the number of bank outlets per 1000 population and/or the number of ATMs per 1000 population. Meanwhile, the usage dimension is represented by the volume ratio from the two basic services of the banking system, including credit and deposits from the total adult population towards the value of Gross Domestic Product (GDP). A low IFI is indicated by the low income of the middle class, while most high-income countries have high IFI.
Currently, many countries are developing Islamic banking, especially those that have joined the IslamicCooperation Organization (OIC). The results from the Pew Research Center's Forum on Religion and Public Life show that the population of OIC member countries in 2018 was around 1.8 billion (28.4% of the world's total population) with an economic size of 21% of the total world GDP. This is a great opportunity for formal sharia financial institutions to conduct their intermediation function. However, it becomes a challenge in implementing inclusive finance since it is felt by all society levels.
Muslim countries under the auspices of OIC promote inclusive sharia-based finance to suit the majority that adheres to Islamic law. This progress is manifested by investors' interest in Islamic financial products as an alternative investment vehicle, with low speculative characteristics compared to western financial services. This certainly promotes the potential demand for financial services, which also increases along with the variety of products in OIC countries.
As in various countries outside the OIC, barriers to formal Islamic financial services in terms of accesscan be easily obtained. Furthermore, it is supported by existing realities such as a lack of public knowledge towards the functions of Islamic financial institutions and the mismatch of products following the needs of low-income people. Demirguc-Kunt et al. (Demirguc-Kunt et al.: 2017) explained that barriers to banking access are caused by the business model, market position, level of competition faced by macroeconomic conditions as well as agreements and regulations implemented. In the future, the development of the Islamic banking model should lead to an inclusive aspect.
Index Financial Inclusion (IFI) could measure using the Islamic financial inclusion index or the ShariaFinancial Inclusion Index (ISFI) through the Islamic banking measurement approach. This is because many countries in the OIC have implemented a dual banking system. The dual banking system is the application of conventional and sharia banking in a country (Bacha: 2008). The ISFI calculation refers to the method of calculating financial inclusion using the IFI approach. However, there are several dimensions of adjustment in IFSI, especially in terms of banking penetration and usage dimensions adjusted to the Islamic bankingconditions. Many studies only focus on the determinant context of conventional financial inclusion from economic indicators and only focusing on one country data (Laha et al.: 2011; Pena et al.: 2014; Ana et al.: 2014; Sanderson et al.: 2018; Mindra et al.: 2017; Singh & Singh: 2011; Sahoo et al.: 2017). Therefore, this result hopes to bridge the existing study gap.
Based on the financial sector development aspect, the indicator commonly used to determine thedegree of financial deepening is the ratio of the money area towards GDP. Generally, higher ratios are associated with greater liquidity and financial depth. The average volume of money relative to OIC countries' GDP was recorded at 60.5% in 2018, compared to 137% in developing non-OIC countries and 124% of the world average. Therefore, the OIC is quite conducive to using money / controlled. However, it is not run well/ liquid when it is related to its circulation. In 2018, the average financial sector available for credit in the domestic economy was 66.7% of GDP in OIC countries. Meanwhile, in non-OIC developing countries was 141.8%. In the same year, developed countries recorded an average of 172.3%, which significantly exceeded the average of both OIC and non-OIC developing countries
This Sharia financial inclusion is now reflected in the development of Sukuk / Islamic bonds in OIC member countries. Sukuk remains attractive to issuers as well as various investors in different regions and financial centers. Total global issuance has increased by 32% in volume from USD 87.9 billion in 2016 to USD 116.7 billion in 2017. The increase in Sukuk was mainly driven by its periodic issuance in Saudi Arabia, Asia, Africa, and several other areas. Malaysia now continues to dominate the Sukuk market. However, stocks from countries such as Indonesia, the United Arab Emirates (UAE), and Turkey have also rapidly Increased.
Based on the Islamic banking sector, about 76% of total industrial assets are valued at USD 1.56 trillion in 2017. Meanwhile, Islamic banking assets are increasing in all major regions, such as the Gulf Cooperation Council, which includes: Bahrain, Kuwait, Oman, Qatar, Saudi Arabia, and the United Arab Emirates, Middle East, and North Africa, as well as countries in Asia. This condition promotes Islamic banking products, which are currently offered everywhere. It accounts for 92% of global Islamic banking assets, with only 12 countries in the OIC. With the improvement of economic development and the Islamic financial system in the OIC member countries, it is interesting to prove the impact on the conditions of Sharia financial inclusion in the OIC member countries. An interesting analysis direction gap then appears to relate current economic development towards the developing financial inclusion conditions in the financial sector, especially in the Organization of Islamic Cooperation (OIC) countries.
The direction of this study is different and more recent from previous results on financial sector inclusiveness conducted by Sarma (Sarma: 2012) in the non-sharia (conventional) context. However, there is a study by Umar (2017) that focuses on the Sharia financial inclusion context in Indonesia. The study was expected to bridge the research gap by using a more developed coverage through the study of Sharia financial inclusion in OIC member countries. Following the author's perspective, this study is quite new to measure and analyze the inclusiveness of the Islamic financial sector because first, it proves the economic development impact on financial inclusion on the sharia scope in OIC member countries. Therefore, economic development as reflected in various indicators such as socio-economic and/or infrastructure conditions should be empirically proven on the Sharia financial inclusion conditions in OIC member countries. However, many previous studies have reviewed the impact on the performance of economic development indicators, such as its effect on growth, investment, unemployment, poverty, inequality, community income, and others (Hariharan & Marktanner; 2012; Nkwede: 2015; Okoye et al.: 2017; Sethi and Acharya: 2018).
Second, this study is planned to use 30 OIC member countries with complete data from 2010 to 2019 based on the sample analysis. The initial step is to independently calculate and determine the Sharia financial inclusion index value, which was sampled based on calculations in the previous study (Sarma & Jais: 2008, Umar: 2017). Furthermore, regression analysis is conducted through the VAR panel modelapproach, using the calculation results of the Sharia financial index as the dependent variable. The independent variable reflects economic development performance. Third, the study considers the independent variables that describe industrial technology 4.0, such as the internet speed bandwidth of each country and the number of mobile phone users. Fourth, it examines the behavior of economic development indicator determinants towards Sharia financial inclusion in OIC countries based on their progress.
METHODOLOGY
Research Approach
This study uses quantitative analysis approaches to see the Sharia financial inclusion level in OIC member countries. Meanwhile, a quantitative study is used to analyze indicators on development that affect the Sharia financial inclusion level. The first stage determines the Sharia Financial Inclusion Index in each OIC member country (using 30 countries) in 2010-2019 (a total of 300 observations) with 3-dimensional aspects of Sharia Financial Inclusion including d1 accessibility, measured by the ratio of the total third party funds (TPF) in sharia banking in thousands of dollars per 1,000 adult population; d2 availability, measured by the ratio of the total Islamic banking branch offices per 100,000; d3 percentage usage of total financing in Islamic banking towards GDP. The index of each dimension is calculated by the following equation:

Where: di = the ith dimension (d1 = accessibility, d2 = availability, d3 = usage), wi = the weight given to the i-th dimension, Ai = the actual value of the i-th dimension, Mi = the maximum value of the i-th dimension, and mi = the minimum value of the ith dimension. The di values for i = 1, 2 or 3 fall between 0 and wi. Thehigher the value, the more successful a region or country is in achieving the i-th dimension. The achievement of a country's financial inclusion is indicated by point X = (d1, d2, d3). In the context of dimensions, point O = (0,0,0) represents the worst value, while pointing W = (w1, w2, w3) where w1, w2, and w3 are the weights given to each dimension. In addition, it represents the ideal and height achievement situation for all dimensions. The financial inclusion index is calculated based on the distance between the most unfavorable point and the achievement of the dimension (O-X or X1) as well as the distance between the ideal point and the dimension (W-X or X2). This was conducted by using the following formula
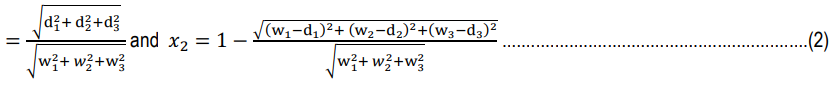
Based on Sarma (2012), the research plan assumes that all dimensions used in the formation of the financial inclusion index are equally important, therefore wi = 1 for all i values. In this case, W = (1,1,1), Sharia Financial Inclusion Index (SFII) equation is:.

The SFII equation is obtained by averaging the X1 and X2 values, which indicate the position betweenthe worst and the ideal point. According to Sarma (Sarma: 2012), the measurement results of the inclusionindex are divided into three categories of low IFI when the value is less than 0.3; medium IFI when the value is between 0.3 and 0.6 and; high IFI when the value is between 0.6 and 1.
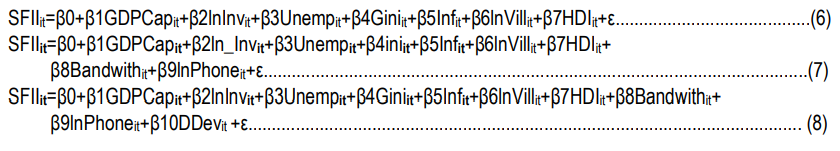
SFII is the dependent variable of the Sharia Financial Inclusion Index. Meanwhile, the independent variables consist of: GDPCap, which is GDP growth per capita based on constant 2010, Inv is a natural log form of total investment value (foreign and domestic), Unemp is the unemployment value, GINI is the Gini Index, Inf is the inflation rate, ln_PendDesa is the log natural of the total villagers, HDI (Human Development Index), bandwidth and ln_Phone become the proxies for technological development. Each of them is the average internet speed rate per year, and the log Natural of the total community that has cellphones, and Ddev is a dummy variable for developing countries (1 = developing countries, 0 = non-developing countries based on GDP per capita). Symbols such as β0 are Constants / Intercept, β1 to β9 are Coefficients / Slopes, i (country), t (year t), and ε are error terms. Then, for empirical variables the description is as follows: Sharia Financial Inclusion Index It is calculated using the Sharia Financial Inclusion Index calculation approach with an index unit of 0-1 (SFII), Growth GDP Per capita based on constant 2010 prices in percent (GDPCap), total investment is based on constant 2010 prices in usd which are converted into natural logarithms (lninv), unemployment is percentage of total unemployed (total unemployed/total population) in percentage units in each country (unemp), gini index is value (0-1) (gini), inflation is inflation value in percent (inf), villagers is the number of people in the village which is converted into natural logarithms (lnvill), human development index is value in index units 1-100 (hdi), internet speed rate is average per year is internet average speed in mbps (bandwidth), number of residents who have cellphones is number of residents who have cellphones that are converted into natural logarithms (lnphone), dummy of developing countries is dummy variable (1 = developing countries, 0 = non-developing countries based on grdp per capita).
Data Estimation Techniques
This study uses two estimation techniques approaches; where the first is the bivariate estimation technique for the Toda-Yamamoto causality model. The second is the Panel Vector Autoregression (PVAR) dynamic panel estimation technique. The Toda-Yamamoto Bivariate Model is an alternate cross-testing technique for two variables in each study, and the causality technique allows stationary data to any degree. It may be the degree of level, first, or second difference, and this differs from the Engel-Granger causality technique, which requires stationary data at a level.
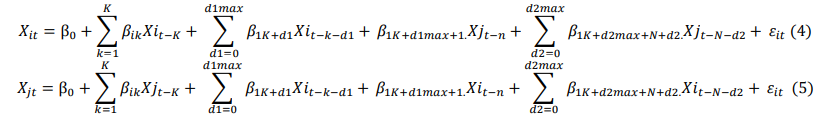
Where: k, n is the time-lapse of the VAR model; dmax is the order of integration/the level of stationarity of time series data; Xj is study variable; where j=individual; t=time; β_10 is the constant; β_ik is the coefficient; ε_it is white noise disturbance term; where E (ε_it) = 0, (i = 1,2), E (ε_1t, ε_2t) = 0.
Also, This study uses the Panel Vector Autoregression (PVAR) estimation technique. Some recent econometric applications have not provided PVAR model estimation. Therefore, this study uses programmed applications. Holtz-Eakin (Holtz-Eakin: 1988) suggests the PVAR estimator concept, which may be solved using GMM and FGLS. The PVAR method was then developed by Benes (Benes: 2014) using Matlab to process the interdependence of 3 economies of 3 countries. Furthermore, Rosen (Rosen: 1988), Love (Love: 2002), and Love (Love: 2006) have developed STATA programming for processing PVAR. The estimates for the two programs differ in all areas since the programming uses a stacked data structure, which is commonly used in STATA, while Benes (Benes: 2014) uses an unstacked structure. The parameter estimator in STATA is GMM, while in Matlab, it is FGLS. The output produced by the PVARprogram provides more information, such as the value of the impulse response function (IRF) and the Variance Decomposition.
Generally, to understand the differences between PVAR and VAR, this study describes the building of adata matrix while analyzing the impulse response function (IRF) and the value of Variance Decomposition. The general difference lies in the data structure that adopts inter-individual and dynamic behavior between variables. The PVAR used uses the estimator concept proposed by Holtz-Eakin (Holtz-Eakin: 1988), and in the panel, a data set consists of i = 1, 2… N individuals. Where each individual has t = 1, 2, 3… T period, to form the PVAR equation, an econometric function with a dynamic model Generalized Method of Moment (GMM) is initially created and may be expressed in the equation below:
The dynamic panel estimate shows the effects of key factors of financial inclusion on economic growth. Examination of dynamic causality, direction of influence, and period shows adequate information about the correlation between variables. Meanwhile, a well-known method of exploring the dynamic relationship of variables is the autoregressive vector methodology (VAR) but only applies to time series data. In using the VAR, a vector autoregressive method data is required for panel data, and this approach combines all variables for panel heterogeneity (Love and Zicchino: 2006). As presented in the GMM panel model equation, the study uses a variable with statistical significance in each Arellano-Bond estimation model.
RESULTS
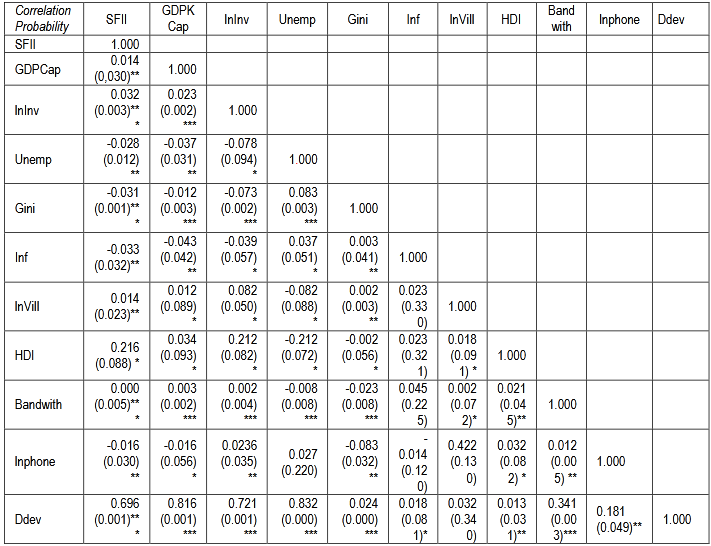
The results of the unit root panel test are adjusted to the PVAR model, where the variables involved are SFII, GDPCap, lnInv, Unemp, Gini, Inf, InVill, HDI, Bandwith, lnPhone, and DDev. They are applied to all study groups models 1, 2, and 3, and in the financial variables SFII, GDPCap, lnInv, Unemp, Gini, and Inf, all data are stationary at the level or reject H0, such as in a stationary condition. The variables lnVill, HDI, Bandwith, lnPhone, and DDev show that the data is stationary at the first derivative level (1st Difference). As stated by (Ekananda: 2014), unit root testing indicates that there is stationarity in the data in certain interconnected groups.
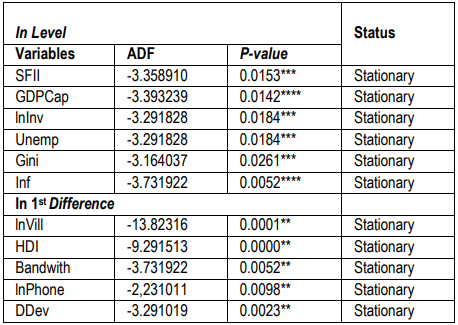
Description: ***) significant at the 1% level; *) significant at the 5% level
Source: Data processed (2020)The results of the panel data stationarity test show that some of the data in this group indicate a co- movement and a co-integration situation.
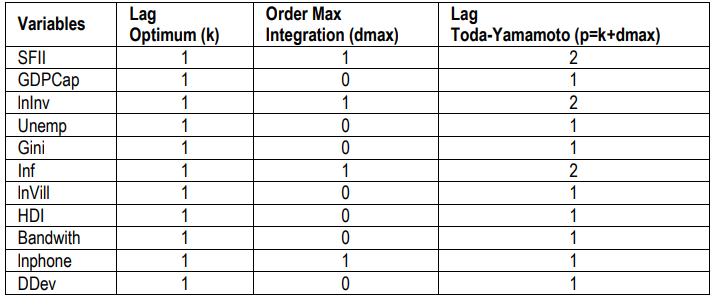
The Results of Optimum Lag and Toda-Yamamoto Bivariate Estimates
The causality test using the Toda-Yamamoto method (Toda Yamamoto Causality Test) was conducted and was preceded by the formation of a VAR model with a new optimum time interval (lag). The new lag value was obtained from the equation denoted by k, plus the maximum integration order of the data series in the model denoted by dmax. Therefore, the optimum time interval for this new VAR model is p = k + dmax. When the time series data is stationary in the first derivative (dmax = 1) and the optimum time interval for the VAR model (k) is 1, then that of Toda-Yamamoto will be 2 (p = k + dmax = 1 + 1 = 2). Testing the VAR model at this stage was conducted using the bivariate and multivariate models as described in the previous sub-chapter. The VAR system was formed to obtain the optimum lag (k) that will be used in the Toda- Yamamoto causality test after the stationarity test was conducted. In the formation of the optimum lag length of the VAR system, various available information criteria are used. In this study, the information criteria used were AIC, SIC, and HQC. The summary results of the optimum VAR lag of the bivariate and multivariate models following the optimum lag length criteria of the VAR system information are presented in the following Table 2.
Source: Processed data (2020)
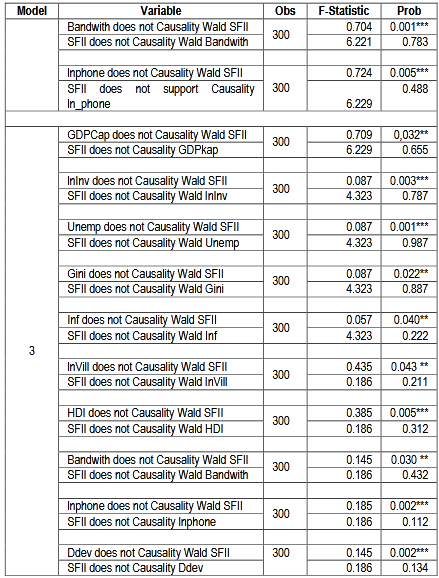
Furthermore, the estimation results of the Toda-Yamamoto bivariate causality model are presented in the following table. The estimation results of the Toda-Yamamoto causality and the bivariate model show that financial inclusion in OIC countries is closely related to the variables of GDP Growth Per capita, Total Investment, Unemployment, Gini Index, and Inflation. It is further related to Rural Population, Human Development Index, Average Internet Speed Level per year, total population that has cellphones, and Dummy Developing Countries
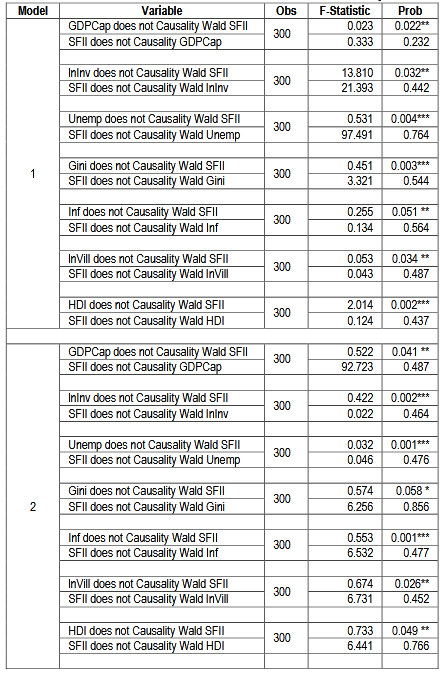
Description: ***) significant at the 1% level; **) significant at the 5% level; *) significant at the 10% level
Source: Data processed (2020)
Description: ***) significant at the 1% level; **) significant at the 5% level; *) significant at the 10% level
Source: Data processed (2020)Multivariate Estimation Results of PVAR and Discussion
The next estimation is to simultaneously analyze the model into the multivariate PVAR analysis. It will be presented in four models of estimation results (model 1, model 2, model 3) since the study detects the impact of each variable simultaneously.
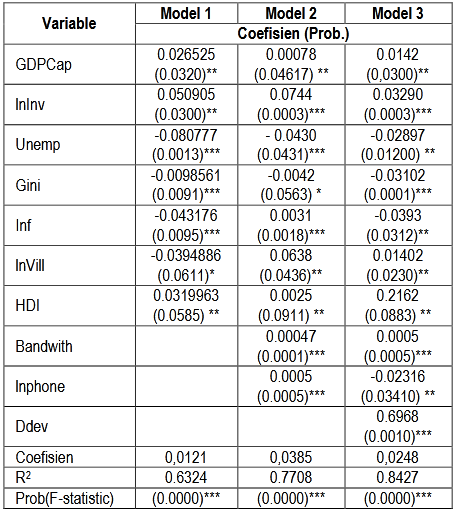
Description: ***) significant at the 1% level; **) significant at the 5% level; *) significant at the 10% level Source: Data processed (2020)
DISCUSSION
The variable of the inclusive financial index is significantly affected by the GDP per capita growth, investment, unemployment, Gini index, inflation, and human development in the estimation of model 1. This is quite logical when the growth of GDP per capita, investment, and HDI increases. It promotes an increase in the Sharia financial inclusion index in OIC Member Countries. This is in line with the study of Beck et al. 2007; Ahlin & Jiang: 2008; Odhiambo: 2010; Thanvi: 2010) that the impact caused by sectors related to economic development promotes the improvement of financial inclusion system. Furthermore, model 1 shows that the variables of Unemployment, Gini Index, and Inflation have a negative impact. This means that an increase in unemployment, Gini Index, inflation, and rural populations reduce the inclusiveness level of Islamic finance in OIC member countries. This finding is consistent with the study of Boukhatem (Boukhatem: 2016), where the impact continuation of economic problems such as unemployment, Gini Index, and inflation, and rural population reduces the level of financial inclusiveness, especially in terms of access and availability.
Through the addition of the variable Bandwidth and Phone, model 2 shows quite interesting results,including first, the variables consistency in the first model tends to be the same in both the significance level and the coefficient. The variable GDP growth per capita, investment, unemployment, Gini index, inflation, and rural population have a significant positive impact. Conversely, the variable of unemployment, the Gini Index, and inflation has a significant negative impact. Second, there is a difference in the results for the rural population variable since the impact changes to a significant positive. Therefore, an increasing rural population increases the level of Islamic finance inclusiveness in OIC countries. This is different from the results of a previous study (Laha et al.: 2011) that rural areas are increasingly marginalized. Meanwhile, theresults of model 2 show that the positive effect of increasing rural populations improves the level of Sharia financial inclusion in OIC member countries. These findings are consistent with the study of (Pena et al.: 2014; Ana et al.: 2014; Sanderson et al.: 2018; Mindra et al.: 2017), where a rise in rural population increases Sharia financial inclusion in OIC member countries. It occurs due to the more massive entry of technology into villages and the increasing interest to further understand the importance of "literate" in the financial system. This condition is confirmed by the addition of new variables in the form of average internet speed in Mbps (bandwidth) and the number of people that have cellphones. In addition, the study by (Singh and Singh: 2011; Sahoo et al.: 2017) shows that in the future, along with the development of existing technology, underdeveloped, deepest, and outermost areas are possible to have increased access, which is proxied through the Islamic financial index.
The results obtained from model 3 are almost similar to 1 and 2 since the variables of GDP Growth per capita, investment, HDI, bandwidth, the number of people that have cellphones consistently have a positive and significant impact. In contrast, the variables of unemployment, Gini Index, and inflation have a negative and significant impact. The estimation results of the variable of rural population point to its impact that tends to increase Sharia financial inclusion in OIC countries since the coefficient is positive in the 3rd model. This confirms previous study statements (Sahoo et al.: 2017) that consider village development, and in this case, increasing Sharia financial inclusion. For the variable of category/label, the form of the country, in this case, uses a dummy model, and it shows that there is quite a significant difference. The Islamic financial system of developing countries is not included when compared to underdeveloped countries. It is quite logical considering that the majority of OIC members are developing countries. This is consistent with the previous study by (Van der Werff: 2013; Demirguc-Kunt & Klapper: 2012), which considers the civilization advancement and the development results of a state to determine financial inclusion.
CONCLUSION
GDP per capita growth, investment, unemployment, Gini index, inflation, and human development index variables. This is quite logical when the growth of GDP per capita, investment, and HDI increases since an increase in the Sharia financial inclusion index in OIC Member countries is promoted. It is consistent with the study of Beck et al.: 2007; Ahlin & Jiang: 2008; Odhiambo: 2010; Thanvi: 2010), where the impact caused by sectors related to economic development promotes the improvement of the financial inclusion system. Furthermore, model 1 shows that the variables of Unemployment, Gini Index, and Inflation have a significant negative impact. Therefore, an increase in unemployment, Gini Index, inflation, and rural populations reduces the inclusiveness level of Islamic finance in OIC member countries. This finding is consistent with the opinion of Boukhatem (Boukhatem: 2016), where it was stated that the continuation of the impact of the economic problems such as unemployment, Gini index, and inflation, and rural populations reduce the level of financial inclusiveness, especially in terms of access and availability.
In the estimation of model 1, the inclusive financial index variable is significantly influenced by the GDP per capita growth, investment, unemployment, Gini index, inflation, and human development index variables. Conversely, the variables of unemployment, Gini index, villagers, and inflation have a negative and significant impact. Therefore, an increase in unemployment, Gini Index, inflation, and rural populations reduces the inclusiveness level of Islamic finance in OIC member countries. Through the addition of the variable Bandwidth and Phone, model 2 shows quite interesting results, including: first, the variables consistency in model 1 is similar to both the significance level and the coefficient. The variables of per capita GDP growth, investment, unemployment, Gini index, and inflation have a significant positive impact. Conversely, the variables of unemployment, Gini Index, and inflation has a significant negative impact. Second, there is a difference in the results for the rural population variable because the impact changes to a significant positive. Therefore, a rise in rural populations increases the inclusion of Islamic finance in OICmember countries. It is explained logically because of the more massive entry of technology into villages and the increasing interest to further understand the importance of "literacy" in the financial system. This condition is confirmed by the addition of new variables in the form of average internet speed in Mbps (bandwidth) and the number of people that have cellphones. It shows that the development of existing technology, underdeveloped, deepest, and outermost areas is possible to have increased access, which is proxied through the Islamic financial index.
The results in model 3 are also not too different from 1 and 2 since the variables of GDP Growth per capita, investment, HDI, bandwidth, the number of people with cellphones consistently have a positive and significant impact. Conversely, the variables of unemployment, Gini Index, and inflation have a negative and significant impact. The estimation results of the number of rural population variables point to its impact on increasing Sharia financial inclusion in OIC countries since the coefficient in the 3rd model is positive. Meanwhile, the variable of category/label form of the country, in this case, uses a dummy model, and it shows that there is a quite significant difference. The developing countries do not have an Islamic financial system when compared to developed countries. This is quite logical considering that the majority of OIC Member countries are developing countries. The increased inclusiveness of Islamic finance, especially in OIC member countries, is balanced with improvements in economic indicators. Therefore, development in a sector centered in rural areas is very important in supporting the Islamic financial inclusiveness index. For further study, other indicator variables related to an open economy (exports, imports, and other trade updates) may be added.
BIODATA
M. PUDJIHARDJO: has more than three decades of academic experience as an professor in Faculty of Economics and Business, Brawijaya University Malang, Indonesia. Teaching undergraduate and postgraduate students, and being a supervisor for some PhD students in Indonesia and an external examiner for PhD students in East Java Universities.
DESI TRI KURNIAWATI: is the current researcher and lecturer in Department of Economics, Faculty of Business and Economics Brawijaya University, Malang , Indonesia. She has more a decade of academic experience as faculty member in Management studies. She is a passionate preceptor, with a sense of commitment towards her profession.
ANGGA ERLANDO: is a full time lecturer and researcher at the Departement of Economics at Universitas Airlangga, Surabaya, Indonesia. He has research interests on finance, international economics; industrialization, regional development, and innovation and small firms.
BIBLIOGRAPHY
AGHION, P., &HOWITT, P. (1992). “A Model of Growth through Creative Destruction”.Econometrica,60:323–351.
AHLIN, C., & JIANG, N. (2008). “Can micro-credit bring development?”. Journal of Development Economics, 86(1), 1-21.
ANA, M. A. R. R., JANINA, L. E. O. N., & PONCE, F. (2014). “Financial inclusion of the poor in Peru: explanatory factors and determinants”. Applied Econometrics and International Development, 14(1),101-122
BABAJIDE, A.A., ADEGBOYE, F.B. & OMANKHANLEN, A.E. (2015). “Financial inclusion and economic growth in Nigeria”. International Journal of economics and financial issues, 5(3), pp.629-637.
BACHA, O. I. (2008). “The Islamic inter bank money market and a dual banking system: the Malaysian experience”. International Journal of Islamic and Middle Eastern Finance and Management.
BENES, J. 2014. “Estimate Panel VAR”. The IRIS Toolbox Project.
BECK, T. DEMIRGUC-KUNT A, & LEVINE R. (2007). “Finance, inequality and the poor”. Journal of Economic Growth. 12:27-49.
BOUKHATEM, J. (2016). “Assessing the direct effect of financial development on poverty reduction in a panel of low-and middle-income countries”. Research in International Business and Finance, 37, 214-230.
DEMIRGUC-KUNT A., & KLAPPER L. (2012). “Measuring financial inclusion: the global Findex database”.World Bank Policy Research Working Paper Series 6025.
DEMIRGUC-KUNT, A., KLAPPER, L., & RANDALL, D. (2014). “Islamic finance and financial inclusion:measuring use of and demand for formal financial services among Muslim adults”. Review of Middle East Economics and Finance, 10(2), 177-218.
DEMIRGUC-KUNT, A., KLAPPER, L. & SINGER, D., (2017). “Financial inclusion and inclusive growth: A review of recent empirical evidence”. The World Bank
DFID. (2004). “The Importance of Financial Sector Development for Growth and Poverty Reduction”. Policy Division Working Paper, Financial Sector Team, Department for International Development, London.
EKANANDA, M., (2014). “ Basic Econometrics for Research on Economics”. Social, and Business, Jakarta: Mitra Wacana Media.
GROSSMAN, G. M., & HELPMAN, E. (1991). “Quality Ladders in the Theory of Growth”. Review of Economic Studies 58:43−61.
GURLEY, J. G., & SHAW E. S. (1955). “Financial Aspects of Economic Development”. American Economic Review, 45:515–538.
HADAD, M. D., AGUSMAN, A., MONROE, G. S., GASBARRO, D., & ZUMWALT, J. K. (2011). “Marketdiscipline, financial crisis and regulatory changes: Evidence from Indonesian banks”. Journal of Banking & Finance, 35(6), 1552-1562.
HARIHARAN, G., & MARKTANNER, M. (2012). “The growth potential from financial inclusion”. ICA Institute and Kennesaw State University.
HOLTZ-EAKIN, D., NEWEY, W. & ROSEN, H.S., (1988). “Estimating vector autoregressions with panel data”. Econometrica: Journal of the Econometric Society, pp.1371-1395.
HONOHAN, P. (2004). “Financial Development, Growth and Poverty: How Close are the Links?” In E. C. Goodhard, ed., Financial Development and Economic Growth: Explaining the Links. London: Palgrave.
KIM, D. W., YU, J. S., & HASSAN, M. K. (2018). “Financial inclusion and economic growth in OIC countries”. Research in International Business and Finance, 43, 1-14.
LAHA, A., KURI, D., & KUMAR, P. (2011). “Determinants of financial inclusion: A study of some selected districts of West Bengal, India”. Indian journal of finance, 5(8), 29-36.
LEVINE, R. (2004). “Finance and Growth: Theory and Evidence”. NBER Working Paper No. 10766, National Bureau of Economic Research, Cambridge.
LOVE, I. & ZICCHINO, L. (2006). “Financial development and dynamic investment behavior: Evidence from panel VAR”. The Quarterly Review of Economics and Finance, 46(2), pp.190-210
LUCAS, R. E. (1988). “On The Mechanics Of Economic Development”. Journal Of Monetary Economics, 22(1), 3-42.
MCKINNON, R. I. (1973). “Money and Capital in Economic Development”. Brookings Institution, Washington, DC.
MINDRA, R., MOYA, M., ZUZE, L. T., & KODONGO, O. (2017). “Financial self-efficacy: a determinant of financial inclusion”. International Journal of Bank Marketing.
NKWEDE, F. (2015). “Financial inclusion and economic growth in Africa: Insight from Nigeria”. European Journal of Business and Management, 7(35), 71-80.
ODHIAMBO, N. M. (2010). “Is financial development a spur to poverty reduction? Kenya'sexperience”. Journal of Economic Studies.
OKOYE, L. U., ERIN, O., & MODEBE, N. J. (2017). “Financial inclusion as a strategy for enhanced economic growth and development”. The Journal of Internet Banking and Commerce, 1-14.
PENA, X., HOYO, C., & TUESTA, D. (2014). “Determinants of financial inclusion in Mexico based on the 2012 National Financial Inclusion Survey (ENIF) ”. (No. 1415).
ROBINSON, J. (1952). “The Generalization of the General Theory. In The Rate of Interest and Other Essays”. London: MacMillan.
ROMER, P. M. (1986). “Increasing Returns and Long-run Growth”. Journal of Political Economy,94(5):1002−1037.
ROSEN, D. & SAUNDERS, D. (2010). “Risk factor contributions in portfolio credit risk models”. Journal of Banking & Finance, 34(2), pp.336-349.
SAHOO, A. K., PRADHAN, B. B., & SAHU, N. C. (2017). “Determinants of financial inclusion in tribal districts of Odisha: an empirical investigation”. Social Change, 47(1), 45-64.
SANDERSON, A., MUTANDWA, L., & LE ROUX, P. (2018). “A review of determinants of financial inclusion”. International Journal of Economics and Financial Issues, 8(3), 1.
SARMA, M., & PAIS, J. (2011). “Financial inclusion and development”. Journal of international development, 23(5), 613-628
SARMA, M. (2012). “Index of Financial Inclusion–A measure of financial sector inclusiveness”. Centre for International Trade and Development, School of International Studies Working Paper Jawaharlal Nehru University. Delhi, India.
SCHUMPETER, J. (1911). “The Theory of Economic Development: An Inquiry into Profits, Capital, Credit, Interest and the Business Cycle”. Cambridge: Harvard University Press.
SETHI, D., & ACHARYA, D. (2018). “Financial inclusion and economic growth linkage: Some cross country evidence”. Journal of Financial Economic Policy.
SINGH, K., & SINGH KONDAN, A. (2011). “9 Financial Inclusion, Development And Its Determinants: An Empirical Evidence of Indian States”. Asian Economic Review, 53(1), 115.
THANVI, R. K. (2010). “Microfinance Outreach: Comparing Banks and MFI (Bandhan) in Cooch Behar District”. Centre for Microfinance Research. Bankers Institute of Rural Development.
UMAR, A. I. (2017). “Index of Syariah Financial Inclusion in Indonesia”. Buletin Ekonomi Moneter dan Perbankan, 20(1), 99-126.
VAN DER WERFF AD, HOGARTH JM, & PEACH ND. (2012). “A Cross-country analysis of financial inclusion within the OECD”. Consumer Interest Annual. Volume 59.