Contabilidad de Gestión
Demographics/Job Characteristics of Top Managers, Corporate Risk and Organizational Outcomes
Características demográficas de trabalho dos principais administradores, riscos corporativos e resultados organizacionais
Características demográficas de trabajo de los principales administradores, riesgos corporativos y resultados organizacionales
Demographics/Job Characteristics of Top Managers, Corporate Risk and Organizational Outcomes
Contabilidad y Negocios, vol. 13, no. 25, pp. 94-108, 2018
Pontificia Universidad Católica del Perú

This work is licensed under Creative Commons Attribution-NonCommercial-NoDerivs 4.0 International.
Received: 02 February 2018
Accepted: 20 April 2018
Abstract: This study aims to analyze the relationship between demographics and job characteristics of top managers and their tolerance or aversion to corporate risk. From the Amadeus – Bureau van Dijk database were collected data about the gender, age, educational background, job duality and job tenure of 1,045 top managers. The results suggest that executives (CEOs and non-CEOs) with formal education in the areas of management and law, as well as the tenure in the organization, are negatively related to risk-propensity behaviors. On the other hand, the age and female gender of top managers are characteristics that are positively related to risk propensity.
Keywords: Upper echelons theory, risk, top managers, demographics.
Resumo: O presente estudo analisa a relação entre características demográficas/laborais de gestores de topo e a sua tolerância ou aversão ao risco corporativo. A partir da base de dados Amadeus – Bureau van Dijk foram recolhidos dados de 1.045 gestores de topo, a respeito de seu género, idade, background educacional, dualidade e tempo de mandato. Os resultados sugerem que executivos (CEOs e não CEOs) com formação nas áreas de gestão e direito, bem como o tempo de mandato, estão negativamente relacionados com o comportamento de propensão ao risco. Já a idade dos gestores de topo e o género feminino são características que estão positivamente relacionadas com a propensão ao risco.
Palavras-chave: Teoria dos escalões superiores, risco, gestores de topo, características demográficas.
Resumen: El presente estudio analiza la relación entre características demográficas / laborales de gestores de primer nivel y su tolerancia o aversión al riesgo corporativo. A partir de la base de datos Amadeus - Bureau van Dijk se recopilar datos de 1045 gestores de primera, sobre su género, edad, antecedentes educativos, dualidad y tiempo de mandato. Los resultados sugieren que los ejecutivos (CEO y no CEO) con formación en las áreas de gestión y derecho, así como el tiempo de mandato, están negativamente relacionados con el comportamiento de propensión al riesgo. La edad de los gestores de primer nivel y el género femenino son características que están positivamente relacionadas con la propensión al riesgo.
Palabras clave: Teoría de los niveles superiores, riesgo, gestores de alto, características.
1. Introduction
The Upper Echelons Theory (UET) proposes that managerial characteristics influence strategies, business profiles and, consequently, the organization and its performance (Hambrick & Mason, 1984). With decades of UET research, there are evidences in the literature that differences in the organizational performance may be associated with the characteristics of top managers (e.g., Bertrand & Schoar, 2003; Wang, Holmes, Oh & Zhu, 2016). For example, at the important moment when a decision is being made, each individual has a peculiar behavior regarding the risk that such decision will pose to the organization. This behavior can be rated as risk tolerance or risk aversion. In this case, risk can be defined as the cumulative effect of the probability of uncertain occurrences that may affect adversely the organizational goals (Wideman, 1992).
Although firms value managers’ ability to make decisions, their inclination to take or avoid risks, depending on the circumstances, can be an asset or a liability for the organization (Johnson & Powell, 1994). Overexposure to risk can be damaging and lead the organization to insolvency, but risk aversion can hinder growth and undermine shareholder value (Shemesh, 2017).
Based on UET theoretical approach, this study analyzes the relationship between demographics and job characteristics of top managers with corporate risk tolerance or aversion. So, data on 1045 top managers were collected from Amadeus – Bureau van Dijk database, regarding gender, age, education, job duality (when the executive simultaneously occupies the position of Chairman of the Board of Directors and other managerial position), job tenure and financial performance.
This study can be used by organizations to assist in the selection and development of their managers, taking into account characteristics relating to risk aversion or risk propensity.
2. Literature Review and Development of Hypotheses
2.1. Corporate Risk
Individuals have a natural risk-taking behavior when making decisions. This behavior can be classified as risk tolerance or aversion. Risk tolerance (or propensity) can be defined as the individuals’ willingness to engage in behaviors that entail a desirable goal, but its accomplishment is uncertain and followed by the likelihood of loss (Xiao, 2008). According to Fisher and Yao (2017), risk tolerance is the degree of discomfort that an individual is willing to accept when he/ she puts his current wealth at risk aiming to a future return. Risk aversion, in turn, is the behavior that shows an individual’s hesitancy in accepting a choice that has an uncertain return when there is an option or alternative whose outcome is beyond doubt (Xiao, 2008). Risk-tolerant managers are likely to invest in riskier assets to obtain higher returns, and less risk-tolerant managers require more compensation to accept uncertainties (Fisher & Yao, 2017).
Although firms value managers’ ability to make decisions, their inclination to take or avoid risks, depending on the circumstances, can be an asset or a liability for the organization (Johnson & Powell, 1994). Overexposure to risk can be damaging and lead the organization to insolvency, but risk aversion can hinder growth and undermine shareholder value (Shemesh, 2017).
Hoskisson, Chirico, Zyung and Gambeta (2017) suggest that based on various managerial behaviors/decisions, it is possible to infer the manager’s risk tolerance. For example, risk tolerance can be defined based on decisions that reflect strategic choices with uncertain outcomes, such as a high debt level (Finkelstein & Hambrick, 1990); research and development spending (Bargeron, Lehn & Zutter, 2010); mergers, acquisitions and divestments, long-term financial debts (Lee & Moon, 2016); business survival (Faccio, Marchica & Mura, 2011); innovation, human resources policy, strategic deviations or changes, aggressive expansion into new markets and long-term investments (Hiebl, 2014; Plöckinger, Aschauer, Hiebl & Rohatschek, 2016).
On the other hand, other authors seek a simpler metric to determine risk behavior such as, for example, the difference between maximum and minimum return on assets (ROA) in a given period of time (Faccio et al., 2011; Khaw, Liao, Tripe & Wongchoti, 2016) or the assets volatility or profitability (ROA) (Boubakri, Cosset & Saffar, 2013; John, Litov & Yeung, 2008). Faccio et al. (2016) consider the latter as one of the most used metrics in literature because it enables to determine risks in investment decisions.
2.2. Upper Echelons Theory
The Upper Echelons Theory is based on the principle that organizational performance (strategies, business profiles and efficiency) is a reflection of the characteristics of chief managers. In other words, organizations reflect the actions and beliefs (experiences, values and personalities) of their strategic leaders (Hambrick & Mason, 1984).
The knowledge, perceptions and values, both of the chief executive officer (CEO), and the top management team (TMT), may also have an influence on the creation of alliances, constitution of international agendas, acquisitions and the risk-related behavior of an organization (Carpenter, Giletkancz & Sanders, 2004; Papadakis & Barwise, 2002).
The characteristics of top managers can be of two kinds: observable and psychological. Observable characteristics consist of demographics and job related aspects such as: age, job tenure, educational and functional background, socioeconomic roots, financial status, among others (Hambrick & Mason, 1984). The psychological characteristics comprise a set of values, perceptions and personality traits of the executives (Carpenter et al., 2004).
The present study considers only the demographic characteristics. So, it considers that executives have a limited capacity to process information and rationality, and so they use their personal demographic characteristics as a kind of “filter” to interpret situations and individual choices (Hambrick, 2007). Age, time in the office, education and gender are one of the CEO’s characteristics most often studied in the UET literature (Finkelstein, Hambrick & Cannella, 2009).
2.3. Development of Hypotheses
The financial literature associates risk tolerance with diverse demographic variables, being age one of the factors most widely studied (Fisher & Yao, 2017). Hambrick & Mason (1984) suggest that the top managers’ or TMT’s age may affect their values, cognitive styles and, consequently, their decisions. The authors point out that the main factors for the conservative behavior of older managers are: decreased physical and mental vigor, which reduces the ability to understand new ideas and learn new behaviors; high engagement with the organization’ status quo; and valuation of financial security and career.
Bertrand & Schoar (2003) conducted a study with more than 500 top managers (CEO, CFO, among others) of U.S. companies and found that older managers invest less in capital expenditures and financial leverage and more in cash holdings, which shows a conservative behavior. On the other hand, younger managers tend to invest more in equipment and properties and less in cash holdings, which shows a risk-tolerance behavior. According to the literature, the following hypothesis is proposed:
H1: The manager’s age is negatively related to his propensity to risk taking.
UET also suggests that education (bachelor’s or graduate degree) reflects the building up of experiences and is associated with cognitive styles and executives values (Bamber, Jiang & Wang, 2010).
Studies show that managers with a background in accounting and finances are more conservative and accurate when they forecast organizational outcomes than managers with other backgrounds (Bamber et al., 2010; Ran , Fang, Luo & Chang, 2015). Executives with a degree in law resemble those with a degree in management areas, since both are trained to protect the client’s interests. So, when they take office, top executives are more conservative, disclose less information and are more risk averse, compared to executives with other professional backgrounds (Bamber et al., 2010; Lewis, Walls & Dowell, 2014).
Empirical evidences show that top managers who hold a MBA degree (i) are more strategically aggressive (Lewis et al., 2014), since they seek to exceed the estimated results (Bamber et al., 2010), (ii) maintain a higher level of financial debt, (iii) spend moreresources on advertising, (iv) invest more resources in capital expenditures, and (v) pay less dividends (Bertrand & Schoar, 2003). On the other hand, executives with a MBA degree make better forecasts, are more sensitive to errors (Bamber et al., 2010) and display a better financial performance (ROA 1% higher on average) when compared to managers without a MBA degree (Bertrand & Schoar, 2003). Geletkanycz & Black (2001) state that the more aggressive behavior displayed by executives with a MBA can be explained by their higher capacity to make strategic decisions. So, the following hypotheses emerge:
H2(a): A bachelor’s degree in business administration and law is negatively related to risk propensity.
H2(b): A MBA degree is positively related to risk propensity.
Several studies point to a conservative behavior displayed by the female gender in the most diverse activities (Bernasek & Shwiff, 2001; Croson & Gneezy, 2009; Faccio et al., 2016; Francis, Hasan, Park & Wu, 2015; Huang & Kisgen, 2013; Johnson & Powell, 1994). Johnson & Powell (1994) observed that women, compared to men, are less confident and more risk averse when making bets.
Faccio et al. (2016) conducted a study with female CEOs in companies listed in the Amadeus Top 250,000 database. The survey pointed to some possible causes for the women’s conservative behavior, such as lack of confidence, preference for fixed remuneration and low-risk firms, more fear of unemployment and more difficulty to climb to the CEO position. Croson & Gneezy (2009) analyzed ten articles relating to gender preferences and differences and concluded that women are likely more risk averse than men. Thus, the following research hypothesis is proposed:
H3: The female gender is negatively related to risk propensity.
Henderson, Miller & Hambrick (2006) show that job tenure has an inverted U-shape relationship with organizational performance. Hazarika, Karpoff & Nahata (2012), in turn, demonstrated that the CEO’s tenure in the organization is negatively related to the management of corporate outcomes. On the other hand, Naranjo-Gil, Maas & Hartmann (2009) evidenced that short term tenures are positively associated with the use of innovative management tools.
In a study conducted by Finkelstein & Hambrick (1990), they found that CEOs with a shorter time in the office have new, diversified information, and are more likely to take risks. Over time, perceptions become more limited and managers begin to promote few strategic changes, which become more imitative, reflecting a risk-aversion behavior. So, the following hypothesis is proposed:
H4: The tenure duration is negatively related to risk propensity.
Duality occurs when a member of the management team at the same time holds a position in the Board of Directors (BoD). When a CEO is also the chairman of the board, the board’s monitoring efficiency decreases, leading to higher corporate risks (Brickley, Coles & Jarrell, 1997). The literature also indicates that in firms where there is such duality of positions, the CEO/Chairman has total control of the perforance appraisal metrics and rewards system. This may cause problems of team motivation and may influence the nature and risk of decisions (Eisenhardt, 1985). Then we have the last hypothesis:
Then we have the last hypothesis:
H5: Duality of managerial functions is positively related to risk tolerance.
3. Methodology and Data
3.1. Database
The initial sample had 275,046 Portuguese firms listed in the Amadeus – Bureau van Dijk database. Of this total, 5,010 firms displayed financial information for the years 2013, 2014 and 2015. However, due to lack of demographics and job-related data of the top managers, the final sample comprised 1,045 firms.
To validate and complement the necessary information, data were collected from likedin.com (about 40%) and google.pt (about 7%) websites. The Linkedin website is a platform that provides educational and professional data and works as an online curriculum, where updates are frequently provided by users.
The final sample consisted of 42 (4%) micro companies, 333 (32%), 392 (38%) medium companies and 278 (26%) large companies. Regarding the industry, predominance was for the industrial sector (324), trade/commerce (290), communications (72) and, finally, professional, scientific and technical firms (82).
3.2. Identification of Variables
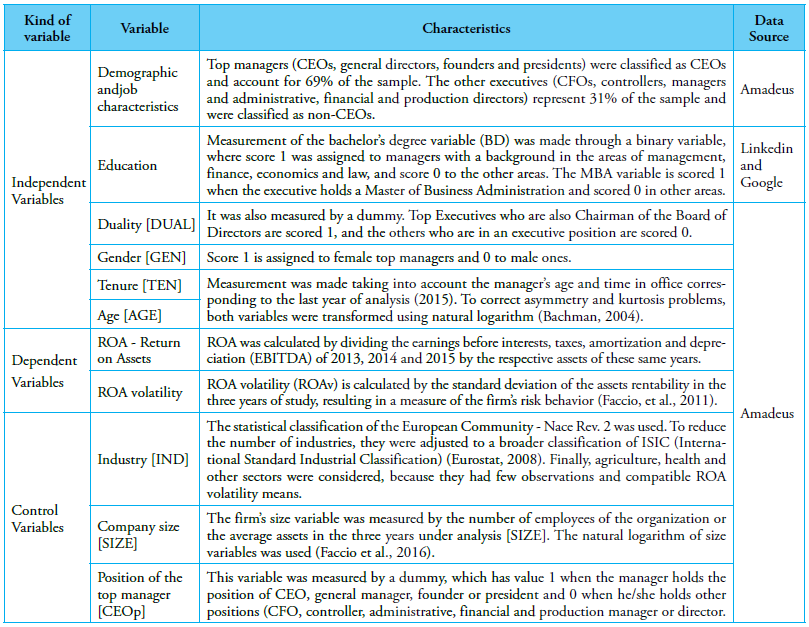
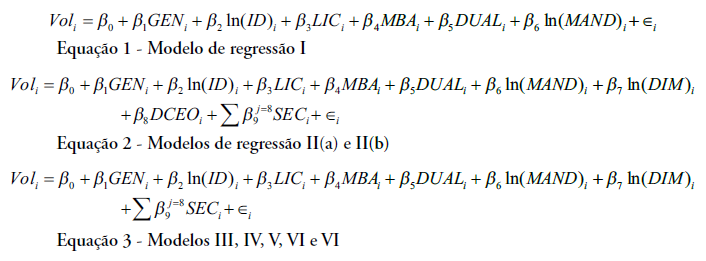
Empirical Model
Seven linear regression models were developed using the OLS (Ordinary Least Squares) method. The Stata/SE software, version 13.0, was used to analyze the data. In the first model, it was decided not to use the control variables. In the second model, the aim was to find out if there was any change in the predictive quality, including size, industry, and job position variables. The third model aimed to test the predictive capacity and drop outliers. The fourth and fifth models aimed to verify the position of the top managers, CEOs and non-CEOs, respectively. Finally, the sixth and seventh models were tested without outliers in the subsamples comprised exclusively of CEOs and non-CEOs.
3.3. Descriptive Statistics and Correlations Matrix
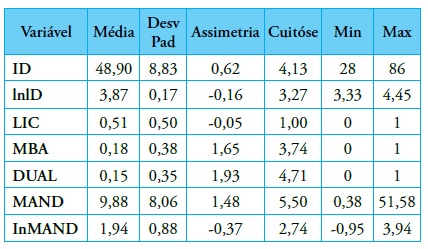
Table 1 shows the mean values, standard deviation, minimum and maximum values for each variable. It can be seen that the dependent variable (ROA volatility) exhibits a mean of 0.05 and standard deviation of 0.02, the minimum value is almost null (0.0002) and the maximum value is over 7. Because this value is very high, it may represent an outlier.
With respect to the top managers characteristics, 14% of them are women, 15% also hold a position in the Board of Directors, 51% have a bachelor’s degree in business administration and law and 18% have a MBA degree. The top managers are 49 years old on average and the average time in office is approximately 10 years. It can be seen that one executive holds the same position for more than 50 years, which can also be considered an outlier.
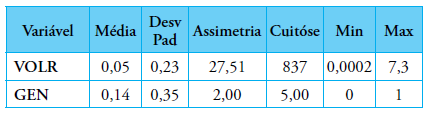
Table 1. Descriptive statistics of variables
The correlations matrix was built considering only the continuous variables. Although this analysis shows that both independent variables (age and tenure) are negatively related to risk (aligned with hypotheses 1 and 4), there is no statistical significance that enables conclusions. It can also be seen that the independent variables do not have a strong correlation, which reduces the self-correlation risk and benefits the regression model.
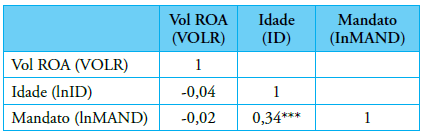
Table 2. Correlation table
*** significance at 1% level
3.3. Results of the Empirical Model
In this subsection the results of all regression models used in this study are described. Aiming to diminish biases of the independent variables, AGE, TEN, and SIZE were transformed using the natural logarithm. According to Pino (2014), the variables transformation can promote approximation of normality, improve the significance levels and intervals of confidence.
3.3.1. OLS Model Without Controls
Table 3 shows the results of model I. This model does not have an explicatory ability since the p-value of the F statistic exceeds the confidence level (0.10) and, therefore, the null hypothesis that all β parameters are statistically equal to zero is not rejected.
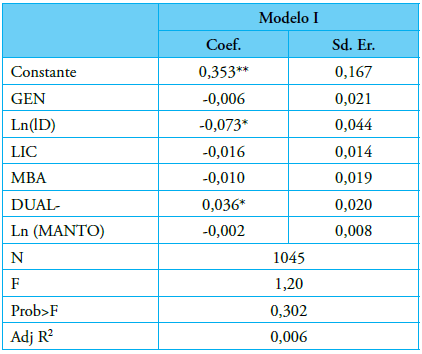
Table 3. OLS regression without transformation of variables
***, **, * significance levels at 1%, 5% and 10% levels, respectively.
3.3.2. OLS Model with Controls
The results of model II, where the control of variables is included, are described in Table 4. Aiming to determine which is the best proxy for the size, the model II was divided into (a) and (b), which representthe size calculated by the number of employees and the assets average, respectively.
It can be seen that model II (a) does not exhibit a joint significance of variables, since the p-value of the F statistic is over 0.1. So, it can be concluded that the set of variables does not explain Model II (a). On the other hand, model II (b) exhibits a joint significance of variables, since the p-value of the F statistic is below 0.1. The model exhibits an independent variable with individual significance, duality, which has a 0.045 coefficient, indicating that the managers who simultaneously hold the position of Chairman of the BoD have a 0.045 increase in the ROA volatility, which is consistent with hypothesis H5. Regarding the explanatory power, the model II (b) has an adjusted R² of 0.009, which means that this model explains 0.9% of the variability of the dependent variable.
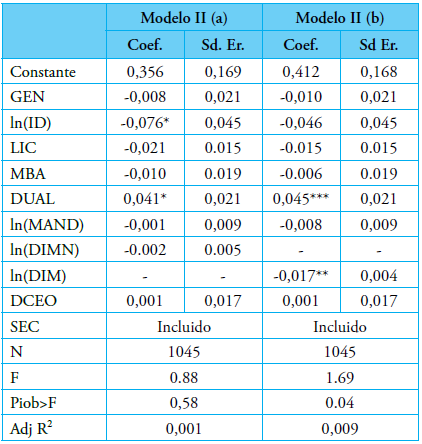
Table 4. OLS regression with control variables
***, **, * significance at 1%, 5% and 10% levels, respectively
Testing was carried out to verify homoscedasticity of residues and multicollinearity of models II (a) and (b). Both White’s tests exhibited a value above 0.05, which indicates that the residues are homoscedastic. But the VIF tests indicated 1.15 and, therefore, it can be inferred that multicollinearity problems are inexistent.
Considering that model II (b), which uses the assets average for the proxy of the size control variable, exhibited the best predictive results (joint significance and adjusted R²), which is largely utilized in literature (Aabo, Pantzalis, Sørensen & Toustrup, 2016; Akbar, Kharabheh, Poletti-Hughes & Sha, 2017; Bargeron et al., 2010; Faccio et al., 2011; Faccio et al., 2016; John et al., 2008; Hernández, Aibar & Aibar, 2015; Khaw et al., 2016), it was decided to use this variable for the other regression models.
Aiming to verify the contribution of control variables to the model, a F-test was conducted for the industry [IND]. The IND variable had a value of 3.01 in the F-test and a p-value of 0.0039; thus, it was decided to maintain this variable in the study. But the coefficient of the top managers position [CEOp] is not statistically significant, according to Table 9. So, it was decided to exclude the CEOp variable in the next regression models.
3.3.3. OLS Regression Model in CEOs and non-CEOs Subsamples
To determine the influence of the top manager position, it was decided to test the models for the CEOs and non-CEOs subsamples. Table 5 shows the results for both subsamples:
The model for the CEOs (III) subsample did not have an explanatory power, considering that the p-value of F statistic was 0.13, i.e., above the significance threshold value of 10%. On the other hand, model IV (non-CEOs subsample) exhibited a joint significance of the variables and an adjusted R² of 0.04, which means that this model explains 4% of the ROA volatility variability. However, none of the independent variables exhibited an individual significance, which makes it impossible to interpret the regression coefficients.
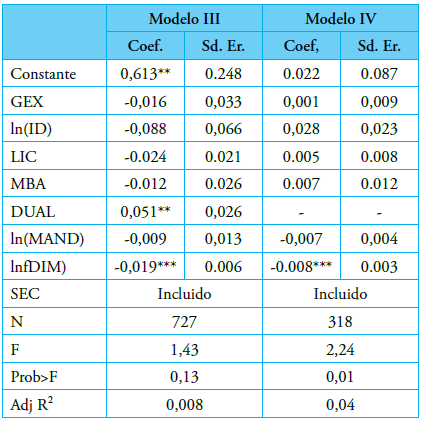
Table 5. Regression models for CEOs and non-CEOs
***, **, * significance at 1%, 5% and 10% levels, respectively
3.3.4. OLS regression model with removal of outliers
For the analysis of model V, it was decided to drop the outliers. The method to remove the outliers was DfFit, which, according to Fávero et al. (2014), it measures how much an observation influences the overall model and how much the predicted values are altered by the inclusion or exclusion of a particular observation. A total of 111 observations were excluded and the regression model was applied again.
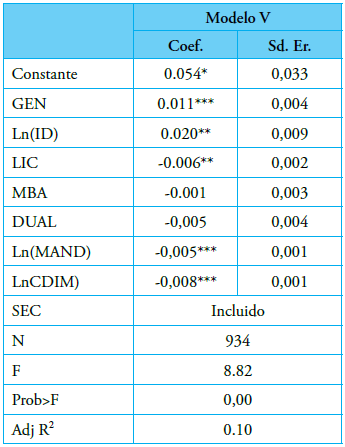
Table 6. OLS regression without outliers
***, **, * significance at 1%, 5% and 10% levels, respectively
Model V has a 10% adjusted R², which shows that this model explains 10% of the variability of the dependent variable and also has a joint significance, taking into account that the p-value of the F statistic is close to 0. The independent variables that have individual significance are gender, age, education (bachelor’s degree) and tenure, at 1, 5, 5 and 1%, respectively. The gender variable has a coefficient of 0.01, and this means that female managers have a 0.011 increase in the ROA volatility, which contradicts hypothesis 3. The age variable has a coefficient of 0.02, which indicates that one percent of age increase results in a 0.0002 increase in the ROA volatility, thus contradicting the first hypothesis of the study. The bachelor’s degree coefficient is -0.006, which means that managers with a major in management and law has a 0.006 reduction in the ROA volatility, and this result is consistent with H2(a).
Finally, the job tenure variable has a coefficient of -0.005; thus, we can say that one percent increase in the time in the position results in a 0.00005 decrease in ROA volatility. This result supports hypothesis 4 and the results of model II (b).
To determine the model fit, the heteroscedasticity and multicollinearity were tested. The White and VIF tests indicated that there was homoscedasticity of residues and nonexistent multicollinearity.
3.3.5. OLS regression model without outliers in CEOs and non-CEOs subsamples
To finalize the results of the empirical model, the models without outliers were tested for the subsamples relating to the managers’ position in the firm (CEOs and non-CEOs). Table 7 shows the results for both subsamples.
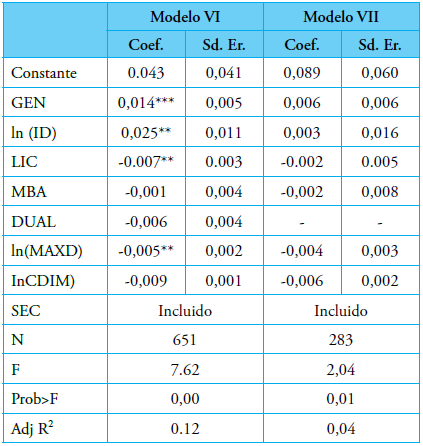
Table 7. Regression models VI and VII
***, **, * significance at 1%, 5% and 10% levels, respectively
Both models indicate a joint significance of the variables. Model VII has an adjusted R² value of 0.04 and no variable containing individual significance. Model VI has the highest adjusted R² value and explains 12% of the variability of ROA volatility. The four independent variables with individual significance are gender, age, education and tenure, at 1, 5, 5 and 5%, respectively. The gender variable presents a coefficient of 0.014, which means that female managers have a 0.014 increase in the ROA volatility, which does not support hypothesis 3. The age variable presents a coefficient of 0.025, so one percent of increase in age results in a 0.00025 increase in the ROA volatility, contradicting the first hypothesis of this study. The education variable coefficient is -0,007, which indicates that managers with a bachelor’s degree in business administration and law has a 0.007 reduction in ROA volatility. This result is consistent with regressions I, II(a), III and V and with H2(a). Finally, the tenure variable has a coefficient of -0.005; thus, we can say that a one percent of increase in the job tenure results in a decrease of 0.00005 in ROA volatility. This result supports hypothesis H4 and the results of models II (b), III, V, VII.
Aiming to test the models for heteroscedasticity, the White test was applied, where the p-values were 1.00 for model VI and 0.87 for model VII; so, there is homoscedasticity of residues. The values of the VIF test were 1.14 and 1.17, respectively, so no multicollinearity was found.
3.5. Discussion
Among the various models presented herein, the ones without outliers are the most robust and with the best results. According to Fávero, Belfiore, Takamatsu and Suzart (2014), outliers are observations with high residue values, which can hinder estimation of the OLS regression models. Dependent variables have an asymmetric behavior. Nearly 99% of the firms exhibited ROA volatility between 0 and 0.4, but there are observations that can be as high as 7.3. The exclusion of outliers led to an increase in the explanatory power and in the variables individual significance, as can be seen in models III and VI.
The regression model without outliers and with the position control variable also corroborates the literature review on the Upper Echelons Theory, since the results are more consistent (there was a greater number of supported hypotheses and higher predictive power) for the subsample comprised of top managers who have more influence and autonomy in the decision-making process (CEOs), if compared to the subsample of executives who are part of the TMT but have less influence on the strategic decisions of the firm (non-CEOs).
Thus, model VI appears to be the best one, because it considers CEOs and not outliers. In this model, the independent variables MBA and DUALITY were not statistically significant, so it was not possible to support H2(b) and H5. In turn, the variables AGE, GENDER, EDUCATION AND JOB TENURE exhibited coefficients with statistical significance.
Based on these coefficients, conclusion is that older and female executives are more likely to take risks, which is not consistent with H1 and H3 and the literature.
In turn, managers with a bachelor’s degree in business administration and law are associated with a risk-aversion behavior, i.e., undergraduate training in management and law are negatively related to risk-taking decisions, thus supporting H2(a). These findings are similar to those obtained by Bamber et al. (2010) and Naranjo-Gil & Hartmann (2006), who identified a conservative behavior that reflects on more accurate and prudent forecasts, a preference for cost-oriented strategic objectives, which requires more financial data and diagnosis systems for the implementation and follow-up of strategies.
Job tenure is associated with a risk-aversion behavior. This finding supports H4 and corroborates the results obtained by Katz (1982) and Hambrick, Gelet- kanycz and Fredrickson (1993), who state that older executives (with a long time in the office) spent great individual efforts in the organizations that they are in before reaching higher hierarchical levels. Executives develop habits, establish routines and build a repertoire of skills and responses for internal and external stimuli. A long tenure in the organization may create a common perspective and culture, which may lead to resistance to changes and difficulties in considering other points of view.
4. Conclusions
This study aimed to analyze the relationship between demographics and job-related characteristics of top managers with their tolerance or aversion to corporate risk-taking. The results suggest that executives (CEOs and non-CEOs) with educational background in business administration and law, as well as the tenure in the organization, are negatively related to a risk- propensity behavior. On the other hand, age and the female gender are characteristics that are positively related to risk propensity. These results were similar to those obtained by Bamber et al. (2010) and Finkelstein & Hambrick (1990).
This study contributes to the literature on the Upper Echelons Theory, since that, in addition to the empirical results of the variables relating to educationalbackground and tenure, there was a higher consistency of results when the subsample comprised of managers with more influence and power in the strategic decision-making process was used.
This study can be useful to organizations to assist in the selection and development of their executives, concerning characteristics related to risk-aversion and risk-propensity behaviors.
This work has some limitations that may prevent generalization of results, namely the exclusive use of Portuguese firms and a limited number of managerial characteristics. Another limitation is that the period of analysis coincided with the sovereign debt crisis that hit Portugal in 2011-2013, which can also affect the results. Additionally, the use of executives’ data only, without considering the influence of the management team, is also a limitation of this study because other executives may also influence corporate risk. Finally, the control of the effect of the industry, or business sector, could be done directly in the calculation of the dependent variable, thus removing the standard deviation of the industry to the standard deviation of the firm, instead of using dummies.
Suggestions for future research studies may include sample diversification, using firms of different countries. The use of data from other countries could also be relevant due to their cultural differences, which may have an influence on risk-taking behaviors. Other possibility of future extension of the study could be the inclusion of managerial psychological characteristics, or personality traits, instead of using demographic variables. Other possibility is the use of the operating leverage degree instead of the ROA volatility based on EBITDA. This could mitigate problems related to the revaluation of assets that are not detected when using EBITDA.
References
Aabo, T., Pantzalis, C., Sørensen, H., & Toustrup, M.T. (2016). Corporate risk and external sourcing: A study of Scandinavian multinational firms. International Business Review, 25(6), 1297-1308. https://doi.org/10.1016/j.ibusrev.2016.04.002
Akbar, S., Kharabsheh, B., Poletti-Hughes, J., & Shah,S. Z. A. (2017). Board structure and corporate risk taking in the UK financial sector. International Review of Financial Analysis, 50, 101-110. https://doi.org/10.1016/j.irfa.2017.02.001
Bachman, L.F. (2004). Statistical analyses for language assessment, Ernst Klett Sprachen. https://doi.org/10.1017/CBO9780511667350
Bamber, L.S., Jiang, J. & Wang, I.Y. (2010). What’s my style? The influence of top managers on voluntary corporate financial disclosure. The Accounting Review, 85(4), 1131-1162. https://doi.org/10.2308/accr.2010.85.4.1131
Bargeron, L.L., Lehn, K.M., & Zutter, C.J. (2010). Sarbanes-Oxley and corporate risk-taking. Journal of Accounting and Economics, 49(1-2), 34-52. https://doi.org/10.1016/j.jacceco.2009.05.001
Bernasek, A. & Shwiff, S. (2001). Gender, risk, and retirement. Journal of Economic Issues, 35(2), 345-356. https://doi.org/10.1080/00213624.2001.11506368
Bertrand, M. & Schoar, A. (2003). Managing with style: The effect of managers on firm policies. The Quarterly Journal of Economics, 118(4), 1169-1208. https://doi.org/10.1162/003355303322552775
Boubakri, N., Cosset, J. & Saffar, W. (2013). The role of state and foreign owners in corporate risk-taking. Journal of Financial Economics, 108(3), 641-658. https://doi.org/10.1016/j.jfineco.2012.12.007
Brickley, J.A., Coles, J.L. & Jarrell, G. (1997). Leadership structure: Separating the CEO and chairman of the board. Journal of Corporate Finance, 3(3), 189-220. https://doi.org/10.1016/S0929-1199(96)00013-2
Carpenter, M.A., Geletkancz, M.A. & Sanders, W.G. (2004). Upper echelons research revisited: Antecedents, elements, and consequences of top management team composition. Journal of Management, 30(6), 749-778. https://doi.org/10.1016/j.jm.2004.06.001
Croson, R. & Gneezy, U. (2009). Gender differences in preferences. Journal of Economic Literature, 47(2), 448-474. https://doi.org/10.1257/jel.47.2.448
Eisenhardt, K.M. (1985). Control: Organizational and economic approaches. Management Science, 31(2), 134-149. https://doi.org/10.1287/mnsc.31.2.134
Eurostat, N. (2008). Rev. 2–statistical classification of economic activities in the european community. Office for Official Publications of the European Communities, Luxemburg.
Faccio, M., Marchica, M. T., & Mura, R. (2011). Large shareholder diversification and corporate risk-taking. The Review of Financial Studies, 24(11), 3601-3641. https://doi.org/10.1093/rfs/hhr065
Faccio, M., Marchica, M. T., & Mura, R. (2016). CEO gender, corporate risk-taking, and the efficiency of capital allocation. Journal of Corporate Finance, 39, 193-209. https://doi.org/10.1016/j.jcorpfin.2016.02.008
Fávero, L. P., Belfiore, P., Takamatsu, R. T., & Suzart, J. (2014). Métodos quantitativos com Stata. Elselvier, 1a edição. Rio de Janeiro-RJ, 131-142.
Fisher, P.J. & Yao, R. (2017). Gender Differences in Financial Risk Tolerance. Journal of Economic Psychology, 61, 191-202. https://doi.org/10.1016/j.joep.2017.03.006
Finkelstein, S. & Hambrick, D.C. (1990). Top-management-team tenure and organizational outcomes: The moderating role of managerial discretion. Administrative Science Quarterly, 35(3), 484-503. https://doi.org/10.2307/2393314
Finkelstein, S., Hambrick, D.C. & Cannella, A.A. (2009). Strategic leadership: Theory and research on executives, top management teams, and boards. Oxford University Press, USA.
Hambrick, D.C. & Mason, P.A. (1984). Upper echelons: The organization as a reflection of its top managers. Academy of Management Review, 9(2), 193-206. https://doi.org/10.5465/amr.1984.4277628
Francis, B., Hasan, I., Park, J. C., & Wu, Q. (2015). Gender differences in financial reporting decision making: Evidence from accounting conservatism. Contemporary Accounting Research, 32(3), 1285-1318. https://doi.org/10.1111/1911-3846.12098
Geletkanycz, M.A. & Black, S.S. (2001). Bound by the past? Experience-based effects on commitment to the strategic status quo. Journal of Management, 27(1), 3-21. https://doi.org/10.1177/014920630102700103
Hambrick, D.C. (2007). Upper echelons theory: An update. Academy of Management Review, 32(2), 334-343. https://doi.org/10.5465/amr.2007.24345254
Hambrick, D.C., Geletkanycz, M.A. & Fredrickson, J.W. (1993). Top executive commitment to the status quo: Some tests of its determinants. Strategic Management Journal, 14(6), 401-418. https://doi.org/10.1002/smj.4250140602
Hazarika, S., Karpoff, J.M. & Nahata, R. (2012). Internal corporate governance, CEO turnover, and earnings management. Journal of Financial Economics, 104(1), 44-69. https://doi.org/10.1016/j.jfineco.2011.10.011
Henderson, A.D., Miller, D. & Hambrick, D.C. (2006). How quickly do CEOs become obsolete? Industry dynamism, CEO tenure, and company performance. Strategic Management Journal, 27(5), 447-460. https://doi.org/10.1002/smj.524
Hernández, M., Aibar, B. & Aibar, C. (2015). Determinants of corporate risk disclosure in large Spanish companies : a snapshot. Contaduría y Administración, 60(4), 757-775. https://doi.org/10.1016/j.cya.2015.05.014
Hiebl, M.R.W. (2014). Upper echelons theory in management accounting and control research. Journal of Management Control, 24(3), 223-240. https://doi.org/10.1007/s00187-013-0183-1
Hoskisson, R. E., Chirico, F., Zyung, J., & Gambeta,E. (2017). Managerial Risk Taking: A Multi-Theoretical Review and Future Research Agenda. Journal of Management, 43(1), 1-33. https://doi.org/10.1177/0149206316671583
Huang, J. & Kisgen, D.J. (2013). Gender and corporate finance: Are male executives overconfident relative to female executives? Journal of Financial Economics, 108(3), 822-839. https://doi.org/10.1016/j.jfineco.2012.12.005
John, K., Litov, L., & Yeung, B. (2008). Corporate governance and risk‐taking. The Journal of Finance, 63(4), 1679-1728. https://doi.org/10.1111/j.1540-6261.2008.01372.x
Johnson, J. E. V & Powell, P.L. (1994). Decision making, risk and gender: Are managers different? British Journal of Management, 5(2), 123-138. https://doi.org/10.1111/j.1467-8551.1994.tb00073.x
Katz, R. (1982). The effects of group longevity on project communication and performance. Administrative Science Quarterly, 27(1), 81-104. https://doi.org/10.2307/2392547
Khaw, K. L. H., Liao, J., Tripe, D., & Wongchoti, U. (2016). Pacific-Basin Finance Journal Gender diversity, state control, and corporate risk-taking: Evidence from China. Pacific-Basin Finance Journal, 39, 141- 158. https://doi.org/10.1016/j.pacfin.2016.06.002
Lee, W.S. & Moon, J. (2016). Determinants of CEO strategic risk-taking in the airline industry. Tourism Management Perspectives, 18(7), 111-117. https://doi.org/10.1016/j.tmp.2016.01.009
Lewis, B.W., Walls, J.L. & Dowell, G.W.S. (2014). Difference in degrees: CEO characteristics and firm environmental disclosure. Strategic Management Journal, 35(5), 712-722. https://doi.org/10.1002/smj.2127
Naranjo-Gil, D. & Hartmann, F. (2006). How top management teams use management accounting systems to implement strategy. Journal of Management Accounting Research, 18(1), 21-53. https://doi.org/10.2308/jmar.2006.18.1.21
Naranjo-Gil, D., Maas, V.S. & Hartmann F.G.H. (2009). How CFOs Determine Management Accounting Innovation: An Examination of Direct and Indirect Effects. European Accounting Review, 18(4), 667-695. https://doi.org/10.1080/09638180802627795
Papadakis, V. M. & Barwise, P. (2002). How much do CEOs and top managers matter in strategic decision‐making? British Journal of Management, 13(1), 83-95. https://doi.org/10.1111/1467-8551.00224
Pino, F. (2014). A questão da não normalidade: Uma revisão. Revista de Economia Agrícola, 61(2), 17-33.
Plöckinger, M., Aschauer, E., Hiebl, M. R., & Rohatschek,R. (2016). The influence of individual executives on corporate financial reporting: A review and outlook from the perspective of upper echelons theory. Journal of Accounting Literature, 37(9), 55-75. https://doi.org/10.1016/j.acclit.2016.09.002
Ran, G., Fang, Q., Luo, S., & Chan, K. C. (2015). Supervisory board characteristics and accounting information quality: Evidence from China. International Review of Economics & Finance, 37(13), 18-32. https://doi.org/10.1016/j.iref.2014.10.011
Shemesh, J. (2017). CEO social status and risk-taking. Quarterly Journal of Finance, 07(2), 1-33. https://doi.org/10.1142/S2010139217500045
Wang, G., Holmes Jr., R.M., Oh, I.S., & Zhu, E. (2016).Do Ceos Matter to Firm Strategic Actions and Firm Performance? A Meta-Analytic Investigation Based on Upper Echelons Theory. Personnel Psychology. 69(4), 775-862. https://doi.org/10.1111/peps.12140
Wideman, R.M. (1992). Project and program risk management: a guide to managing project risks and opportunities. Newtown Square: Project Management Institute.
Xiao, J. J. (2008). Handbook of consumer finance research. New York: Springer. https://doi.org/10.1007/978-0-387-75734-6
Author notes