Articles
The spatial dynamics of land use surrounding the Spanish property bubble (1990-2012)
Dinámicas espaciales de ocupación de suelo en torno a la burbuja inmobiliaria española (1990-2012)
 Patxi J. Lamíquiz Daudén Francisco.lamiquiz@upm.es
Ester Higueras Garcia ester.higueras@upm.es
Manuel Benito Moreno manuel.benito.moreno@alumnos.upm.es
Patxi J. Lamíquiz Daudén Francisco.lamiquiz@upm.es
Ester Higueras Garcia ester.higueras@upm.es
Manuel Benito Moreno manuel.benito.moreno@alumnos.upm.es
The spatial dynamics of land use surrounding the Spanish property bubble (1990-2012)
Investigaciones Regionales - Journal of Regional Research, no. 45, pp. 93-117, 2019
Asociación Española de Ciencia Regional

This work is licensed under Creative Commons Attribution-NonCommercial 4.0 International.
Received: 26 April 2018
Accepted: 06 May 2019
Abstract:
Although the recent housing boom & bust in Spain has triggered significant transformations in its urban fabric, the geographical dimensions of this economic phenomenon and its spatial impacts on the local urban structure have not yet been described in depth. Following the latest published data from CORINE Land cover (2012), this study undertakes a dynamic multi-scale spatial analysis of data representing urban land cover over a 22-year span, contributing to the understanding of four main issues: (i) the total amount of change, (ii) its proportion in comparison with the initial stage of geographical distribution, and the (iv) the implications for the metropolitan and regional urban layout. This quantification describes the outlying regional structure of Spain’s urbanization process during the last decades in Europe, showing great acceleration and a significant transformation in land use patterns, as well as major differences in rates and components on smaller scales, using an integrated growth index.
Keywords: Real estate bubble, CORINE Land Cover, land use, Spanish urban structure, regional studies, spatial dynamics.
Resumen: Utilizando los datos de ocupación de suelo de CORINE Land Cover (2012), este trabajo propone un análisis multiescalar, cuantitativo y espacial de las dinámicas de urbanización antes, durante y después de la burbuja inmobiliaria española, aportando una visión inédita del fenómeno en cuatro aspectos interrelacionados: (i) la magnitud absoluta del cambio, (ii) su proporción respecto al estado inicial, (iii) su variación temporal respecto a los usos del suelo, y (iv) sus implicaciones para los distintos componentes del sistema urbano español. El estudio precisa el lugar destacado del caso español en el continente europeo, y evidencia, a nivel provincial, una fuerte transformación del modelo de ocupación del territorio o las desigualdades en el ritmo y componentes del proceso, mediante la utilización de un índice integrado de crecimiento.
Palabras clave: Burbuja inmobiliaria, CORINE Land Cover, Ocupación del suelo, Sistema urbano español, Estudios regionales, Dinámicas espaciales.
Summary
Taking the data on land use from the CORINE Land Cover (2012) report, this study proposes a multiscale, quantitative and spatial analysis of the dynamics of urbanization before, during and after the Spanish property bubble, providing an unprecedented view of the phenomenon in four interrelated aspects: (i) the absolute scale of the change, (ii) its proportion with respect to its initial status, (iii) its variation over time, as regards different land uses, and (iv) its implications for the different components of Spain’s urban structure. The study points to Spain’s prominent role within the European continent and, at province level, testifies to a major transformation of the land cover model across this territory, and the unequal pace and components of the process, through the application of an integrated growth index.
1. Introduction
The real estate bubble1 which occurred in Spain and other countries between the end of the 90s and 2008 was a property-based and economic phenomenon whose boom and bust was of an unprecedented scale and speed, and which caused a growing social and media impact, given its direct relationship with the subsequent recession in the construction sector, public works and the country's overall economy.
Within this context, the objectives of this study are:
-
To present the dimensions and peculiarities of the urban growth associated with the most recent Spanish real estate bubble through the study of data on the urban and regional effects of this unique process.
-
To describe, analyse and characterize the spatial dynamics in land use in Spain, principally through the quantification and spatial analysis of the European database, CORINE Land Cover (CLC), in its different editions, taking metrics associated with the changes during the period studied. With this aim in view, absolute and relative increases in different types of land use were measured, aggregating the results on a national and provincial scale, and providing an interpretation of land use in terms of the urban setting.
-
To propose a method for the comparison of spatial growth by types of urban structure at the province level.
-
To contrast the results obtained with interpretations of the transformation undergone by Spain in terms of model or main urban features.
Given the importance of the CLC data in this study, the period was set between the CLC’s first and last data series, from 1990 to 2012, as will be explained later.
The article consists of four chapters after this introduction: the second contains a review of the scientific literature on the subject; the third addresses the methodology and sources used to establish the descriptive scope; the fourth presents the results referring to Spain as a whole and to provincial distribution; and the fifth is devoted to discussing the results and presenting the conclusions.
2. Bibliographical review of the Spanish property bubble
The real estate bubble is not a new phenomenon in Spain (Naredo, 1998, Rodríguez, 2006) and should be set against the backdrop of the general phenomenon that occurred worldwide2.
As in other countries, in the Spanish case the study of the property bubble began with the analysis of the increasing rise in sector prices in economics magazines and observatories (Falcón, 2003, Sánchez, 2003, García Montalvo, 2004 and 2005). Shortly after this, analysis of this phenomenon began on its dimensions in geographical terms - the subject of study here - and whose first approach must surely be the article by Serrano (2004), which provides data and maps on residential growth by province from 1950. These sources witnessed the fact that the greatest growth from that date up to 2001 was in the provinces or regions with the greatest demographic weight and population growth (Madrid, and the Basque Country), but also in tourist areas and areas closely linked to the leisure industry (Canary Islands and the Valencia region). Likewise, Catalonia, where both dynamics overlap, although that study did not analyse each of the decades and the trends observed between each. Serrano does, however, compare percentage increases in the housing stock between 1991 and 2001, for example, and notes that these trends clearly differ from those over the entire period, pointing the way to signs of change to a new situation. Thus, the Canary Is. and Madrid (43% and 30%) dictated the pace of residential growth over that decade, followed by the Rioja region and Navarre (29% and 27%), which is somewhat surprising. Catalonia, in contrast, fell below the Spanish average (20% as against 22%) and Valencia positioned itself almost at mid-level (21%). Still to be researched is whether these signs of change in residential distribution in Spain have subsequently accelerated or have followed a different pattern.
In the following years, two seminal studies were also published on the analysis of the consequences of the bubble in terms of land cover: ‘El tsunami urbanizador español y mundial' (tr: the Spanish and world property tsunami: Fernández Durán, 2006) and ‘La década prodigiosa del urbanismo español (1997-2006) ('The prodigious decade of Spanish town planning 1997-2006) (Burriel, 2008). In the first and more extensive of these studies, we see how the escalation of urbanization in the 1990s in Spain was “substantially more pronounced than at European scale, which was already high – an increase of 6% in that period – more than 25% of previously urbanized land” (Fernández Durán, 2006, 24). The author attributes this enormous growth to the explosion in infrastructure; metropolitan restructuring; large public projects; the growth of tourism and domestic demand; as well as a greater concentration within the capital, all of which appear to indicate significant changes in the Spanish model of urban land use.
The second article emphasizes the building fever and compares the number of homes starting construction per 1,000 inhabitants in 1996 and 2006, by province, showing how Madrid and Barcelona occupied the lower echelons, compared to Malaga, Almeria, Alicante, Castellon and Guadalajara, at the top of the list. This would appear to point to major changes in the distribution of the property stock and changes in the distribution model of available housing. Likewise, we shall attempt to verify here the features of transformation in the land use model put forward by these authors.
With reference to the regional sphere, the studies that show changes in certain property dynamics are of interest here. Thus, both Mazón (2005) and Vera (2005), highlight the boom in residential tourism in Alicante, i.e. the construction of housing, whether a second home or not. Vera points to the phenomenon of housing around golf courses as a specific type, this subject leading to numerous subsequent studies, such as those contributed at the first residential tourism conference (I Congreso de Turismo Residencial) held at the University of Alicante in November 2005.
At the conference, under the general theme of 'Growing Urban Planning. From Utopia to Reality', 64 papers were presented, about half of which dealt with growth and transformation over the previous two decades in several different Spanish geographical areas: the Andalusian coast (7 papers), the Levante coast or interior (another 7), Castilla y León (4), Balearic Is. (3), Canary Is. (3), Madrid (3), Castilla-La Mancha (2), Cantabria (1), and Aragon (1) as well as others of more general content.3
More recently, in Spain’s 2016 Sustainability Report, the Observatory on Sustainability (OS) presented a comprehensive study of changes in land use in Spain (1987-2011), with the same CLC data as used in this study: the 1990, 2000, 2006 and 2012 editions (these last published in 2015), where they underline that between 1990 and 2012 artificial (urbanized) land almost doubled in Spain. Industrial, commercial and infrastructure-based land cover multiplied by three and artificial green areas by four (OS 2016, 367). However, the 2016 Sustainability Report does not present the Spanish case within the European context, nor does it delve into the distribution of national growth by province, issues that are addressed in this article.
On existing research, this study will take steps in two directions, (i) through an overview of the evolution in the settlement model through the comparative interpretation of dynamics at regional and state level, and (ii) as far its spatial interpretation at the level of province, to understand this model in detail and in comparative terms within the Spanish urban system, using the data updated to 2012.
3. Sources and methodology
3.1. The time frame of the “bubble” and the editions of the CLC
When, as is this case, the aim is to analyse the urban consequences of the "bubble" through CLC data, we note that its editions (1990, 2000, 2006, and 2012) do not fit adequately with the period of greatest property growth, since: to include the initial years of this phenomenon (1996-1999), the 1990 CLC would be essential and, if we wished to include its final and culminating years (2006-2008) only the 2012 CLC (prepared in 2011) could be referred to, as the 2006 CLC (with references to 2005) would exclude these years. Given that the focus of this study is to examine the town planning and spatial consequences of the most recent "real estate bubble", it has been considered suitable to define the period of study as that of the first and last CLC edition: 1990 and 2012, conscious of the fact that, although they do not fit the precise beginning and end of the most recent bubble, they include this in its entirety, together with other years, whose relatively small weight in the whole picture should not significantly bias the conclusions drawn.
3.2. Characteristics of “Corine Land Cover”: CLC
The CLC database on land use, which deals with the surface area taken up by various classes of land over the years 1990, 2000, 2006 and 2012, as well as the specific changes that have occurred between them (EEA, 2007), is of special interest to urban planning studies. This is especially the case of studies which examine artificial land (Table 1), since its geometry and distribution can, a priori, explain the spatial dynamics of the urbanization process that will enable us to characterize this with a certain degree of precision (Siedentop and Meinel, 2004; Díaz-Pacheco y Gutiérrez, 2013).
| Class 1: ARTIFICIAL LAND Class 11: Urban Fabric Class 111: Continuous Urban Fabric Class 112: Discontinuous Urban Fabric Class 12: Industrial, commercial Class 121: Road and rail networks and associated land, rail networks. Class 122: Road and rail networks, and associated land Class 123: Port areas Class 124: Airports Class 13: Mine, dump and construction Class 131: Mineral extraction sites Class 132: Dump sites Class 133: Construction sites Class 14: Artificial, non-agricultural Class 141: Green urban areas vegetated Class 142: Sports and leisure facilities |
In the CLC editions, the scale is 1:100000, the minimum surface detection area is 25 ha, and the minimum width for the inclusion of linear elements detected:100m (EEA, 2007), providing exhaustively validated information, albeit with certain limitations, however with a subject-based and geometrical precision estimated at more than 85% (Heymann et al., 1994, EEA, 1997, 2000, 2007).4
For this study, the Stock and Change methodology was considered the most appropriate. A detailed description of this can be found in Haines-Young (1999) and EEA (2006). We should indicate that measuring may be subject to limitations arising from technical characteristics. This should not be ignored and, as in the case of classification errors, have made is advisable to consider only the classes up to the second subject area level (11, 12, 13 and 14).5 Classification errors are fewer in artificial land classes (Batch et al., 2006) and decrease with the increase in the aggregation scale (Díaz-Pacheco and Gutiérrez, 2013).
3.3. Measurement of the deviation in growth
Usually the description of the scale of growth is in absolute and/or relative figures, since no methodological references to consider both indicators at the same time have been found. However, in this study some provinces stood out due to large scale land cover in absolute terms, while others did so because of the disproportion as regards initial cover and, in some cases, in both parameters. The question is thus how to compare them.
For this purpose, we proposed to carry out an integrated study of both indicators using simple statistical apparatus, with easily understandable results. Thus, both indicators (absolute and relative growth) have been considered in relation to their basic measurements of central trend and dispersion, mean and standard deviation, measuring the number of times that each value significantly exceeds these.
This is defined as "Integrated rate of disproportion in growth as compared to the average", or "Degree of disproportionate growth" as an exploratory variable, equal to the sum of exceeding the value of the mean (=1) plus the number of times that the province exceeds the standard deviation in either of the two variables.
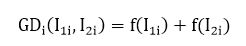
Where:
I1i = Absolute increase in class C1 of the province i
I2i = Relative increase in class C1 of the province i
f(Iij) = discrete function, in intervals defined as a function of the mean μj and standard deviation σ of the variable I in province i and that takes the following values:
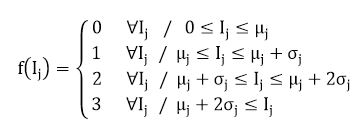
This results in a scale with a range from 0 to 6 (from lowest to highest disproportion), which can be seen in the diagram in Figure 1.
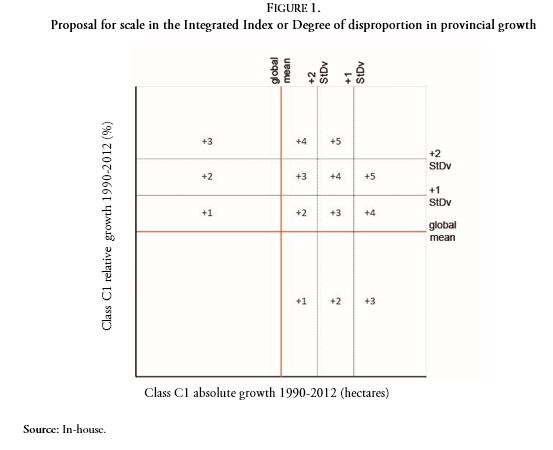
Figure 1.
Proposal for scale in the Integrated Index or Degree of disproportion in provincial growth
Source: In-house.
4. Results
4.1. Some figures for land cover in Europa (2000-2012)
| Countries | Occupied land use in mha | Increase 2000-2012 | Percentage: 35 countries | Population 2012 | Land consumption | ||
| 2000 | 2012 | mha | % | inhab./1000 | ha/1000 inhab. | ||
| Spain | 755.9 | 974.1 | 218.2 | 28.9 | 19.8 | 46.773 | 21 |
| France | 2642.9 | 2791.3 | 148.4 | 5.6 | 13.5 | 65.660 | 43 |
| Turkey | 1141.1 | 1244.6 | 103.5 | 9.1 | 9.4 | 74.849 | 17 |
| Germany | 2772.6 | 2851.3 | 78.7 | 2.8 | 7.1 | 80.426 | 35 |
| Italy | 1385.5 | 1460.6 | 75.1 | 5.4 | 6.8 | 59.540 | 25 |
| Holland | 449.6 | 505.3 | 55.7 | 12.4 | 5.1 | 16.755 | 30 |
| Poland | 1191.4 | 1243.0 | 51.5 | 4.3 | 4.7 | 38.063 | 33 |
| Portugal | 287.2 | 323.2 | 36.0 | 12.5 | 3.3 | 10.515 | 31 |
| UK | 1748.2 | 1781.0 | 32.8 | 1.9 | 3.0 | 63.700 | 28 |
| Albania | 48.0 | 77.6 | 29.6 | 61.5 | 2.7 | 2.900 | 27 |
| Greece | 255.4 | 281.6 | 26.1 | 10.2 | 2.4 | 11.045 | 25 |
| Sweden | 591.5 | 613.9 | 22.3 | 3.8 | 2.0 | 9.519 | 64 |
| Ireland | 130.9 | 151.2 | 20.4 | 15.6 | 1.8 | 4.587 | 33 |
| Czech Rep. | 464.6 | 484.9 | 20.3 | 4.4 | 1.8 | 10.511 | 46 |
| Hungary | 533.3 | 552.6 | 19.3 | 3.6 | 1.7 | 9.920 | 56 |
| Norway | 246.3 | 264.4 | 18.1 | 7.4 | 1.6 | 5.019 | 53 |
| Denmark | 306.1 | 323.9 | 17.8 | 5.8 | 1.6 | 5.592 | 58 |
| Rumania | 1463.8 | 1480.3 | 16.5 | 1.1 | 1.5 | 20.058 | 74 |
| Finland | 442.2 | 457.6 | 15.5 | 3.5 | 1.4 | 5.414 | 85 |
| Cyprus | 64.5 | 77.4 | 12.9 | 20.0 | 1.2 | 1.129 | 69 |
| Croatia | 160.3 | 173.1 | 12.7 | 7.9 | 1.2 | 4.268 | 41 |
| Austria | 392.3 | 404.3 | 12.0 | 3.1 | 1.1 | 8.430 | 48 |
| Slovakia | 261.2 | 270.3 | 9.2 | 3.5 | 0.8 | 5.408 | 50 |
| Bosnia and Herzegovina | 58.7 | 66.5 | 7.8 | 13.3 | 0.7 | 3.828 | 17 |
| Serbia | 269.8 | 276.8 | 7.1 | 2.6 | 0.6 | 7.199 | 38 |
| Iceland | 31.0 | 37.2 | 6.3 | 20.3 | 0.6 | 321 | 116 |
| Belgium | 618.8 | 624.6 | 5.8 | 0.9 | 0.5 | 11.128 | 56 |
| Lithuania | 205.6 | 211.0 | 5.4 | 2.6 | 0.5 | 2.988 | 71 |
| Estonia | 80.6 | 85.8 | 5.3 | 6.6 | 0.5 | 1.323 | 65 |
| Bulgaria | 510.6 | 515.2 | 4.5 | 0.9 | 0.4 | 7.306 | 71 |
| Latvia | 81.6 | 84.0 | 2.4 | 2.9 | 0.2 | 2.034 | 41 |
| Macedonia | 34.0 | 35.8 | 1.8 | 5.4 | 0.2 | 2.069 | 17 |
| Slovenia | 53.2 | 54.6 | 1.4 | 2.6 | 0.1 | 2.057 | 27 |
| Switzerland | 264.9 | 266.0 | 1.1 | 0.4 | 0.1 | 7.997 | 33 |
| Luxemburg | 21.6 | 22.5 | 0.9 | 4.1 | 0.1 | 531 | 42 |
| Montenegro | 13.3 | 14.1 | 0.8 | 5.7 | 0.1 | 621 | 23 |
| Total: 36 | 19978.5 | 21081.5 | 1103.0 | 5.5 | 100 | 609.482 | 45 |
Over the course of these 12 years, artificial surface land use in Europe increased in all of the 36 countries considered by the CLC by slightly more than 1.1mha. This is where Mediterranean countries concentrated 57.9% of their growth, and Spain showed itself to be the country with the highest rate of urban development, with 218m hectares developed between 2000 and 2012: alone, Spain contributed 19.8% to the total, as compared to 13.6% for the second country in line (France: 148mha). Within Spain, occupied land accounted for more than 30% of existing land use, as compared with 5.6% in France and 5.5% in the 36 countries on average, only behind Albania in relative land use (61%, with 29.6 mha). This data therefore confirms Spain as the main protagonist of the phenomenon of the property bubble in Europe. If, with the CLC data for the same period, we analyse how the different land use classes have evolved, we can verify that Spain was at the head of growth in land use, particularly in the following classes:
-
In class 12 land (industrial, commercial and transport infrastructure), with 94mha and a 63.5% increase from 2000, against a 16.8% growth rate and 479mha for all 36 countries.
-
For class 14 land (artificial vegetated areas), where Spain recorded 106mha, an even greater percentage increase is observed: 68.8%, compared to 8.5% for the 36 countries as a whole.
-
The relative growth of class 11 also greatly exceeds that of all 36 countries taken together, with a relative growth rate in Spain of 9.6%, as compared with 2.2% for the entire group.
This data indicates a major change in the spatial structure of the components of the urban environment in Spain, very marked when compared with the countries in Spain’s continental environment.
4.2. Overall changes in artificial land use in Spain (1990-2012)
4.2.1. Land, annual pace and densities
The review of the literature on the Spanish case leads us to confirm the idea that, over the period considered, Spain experienced “an exceptional property boom, in terms of its intensity and duration”, whose “result has been exaggeratedly high urban growth” (Burriel 2008, one). The main results seen in the successive editions of the CLC and the changes observed there can be summarized for Spain in the following tables:
Source: In-house, from CLC data for 1990 to 2012.
Undertaking overall quantification of artificial land in the successive editions of the CLC, a significant increase in the annual rates of absolute and relative growth over the period from 2000 to 2006 can be seen, followed by its subsequent fall in the next edition of the CLC report, for the period 2006 to 2012.
| CLC Edition | Class 1 (ha) | Population / 1000 | ha/1000 inhab. | ∆ Annual ave. (ha) |
| 1990 | 1,002,648 | 38,853 | 25.81 | |
| 2000 | 1,195,859 | 40,263 | 29.70 | 0.39 |
| 2006 | 1,395,783 | 44,009 | 31.72 | 0.34 |
| 2012 | 1,507,192 | 46,773 | 32.22 | 0.08 |
To address the question of whether or not the development model was more widespread, artificial land use per inhabitant was calculated and a significant increase was observed (+24.8% between 1990 and 2012), which would imply an equivalent decrease in gross population density.6
4.2.2. Components of land use in Spain
To determine to what extent land use over the period produced a new spatial model for use and what its key features were, we analysed CLC figures for large components: urban fabric (class 11), industrial, commercial units and infrastructure (class 12); artificial vegetated surfaces (class 14) and construction sites (class 133).
| Class 11 | Class 12 | Class 133 | Class 14 | Total C1* | |||||
| CLC Edition | mha | % | mha | % | mha | % | mha | % | mha |
| 1990 | 791 | 78,8 | 173 | 17,3 | 21 | 2,1 | 18 | 1,8 | 1.003 |
| 2000 | 879 | 73,5 | 240 | 20,1 | 42 | 3,5 | 36 | 3,0 | 1.196 |
| 2006 | 919 | 65,8 | 296 | 21,2 | 136 | 9,7 | 45 | 3,2 | 1.396 |
| 2012 | 939 | 62,1 | 371 | 24,5 | 145 | 9,6 | 57 | 3,8 | 1.512 |
| Class 11 | Class 12 | Class 133 | Class 14 | Total C1* | |||||
| CLC Edition | mha | % | mha | % | mha | % | mha | % | mha |
| 1990 | 791 | 78,8 | 173 | 17,3 | 21 | 2,1 | 18 | 1,8 | 1.003 |
| 1990-2000 | 88 | 46 | 66 | 34 | 21 | 11 | 18 | 9 | 193 |
| 2000-2006 | 40 | 20 | 57 | 28 | 94 | 47 | 9 | 4 | 200 |
| 2006-2012 | 20 | 17 | 74 | 64 | 9 | 8 | 13 | 11 | 116 |
| 1990-2012 | 149 | 29,2 | 197 | 38,7 | 124 | 24,4 | 39 | 7,7 | 509 |
This data verifies the significant variations in the proportions of components, with a strong trend towards change for the totality of transformed land, where residential areas (mostly included in class 11) lose weight when compared to industrial, commercial and infrastructure-based land cover and artificial vegetated areas, pointing to the creation of a new urban model consistent with the increase in per capita land use analysed above. The change in the urban model was progressive, as can be seen when comparing the CLC data on 1990, 2000, 2006 and 2012. Although between 1990 and 2000 residential land still represented the largest surface area between 2000 and 2006 (46%), in the midst of the property bubble industrial, commercial and infrastructure land use came to represent the highest proportion (28% as against 20% for residential). Particularly during the property bubble and later, between 2006 and 2012, industrial, commercial and infrastructure-based land cover reached 64% of the total.
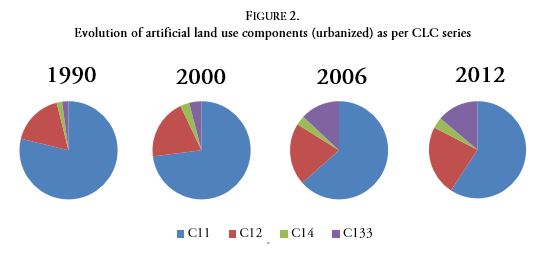
Figure 2.
Evolution of artificial land use components (urbanized) as per CLC series
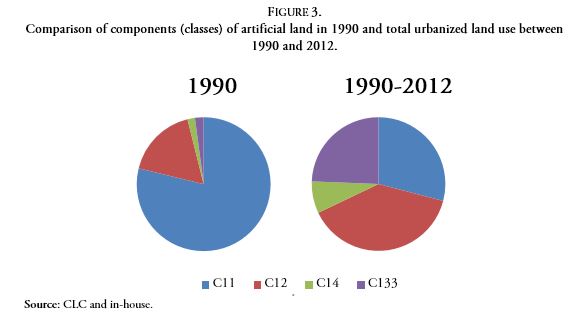
Figure 3.
Comparison of components (classes) of artificial land in 1990 and total urbanized land use between 1990 and 2012.
Source: CLC and in-house.
In short, in absolute terms, over the course of the 22 years of the bubble, 197mha of natural areas (39%) were converted to industrial, commercial or infrastructure land use, (class 12) and 39mha to artificially vegetated land (class 14), together totalling 237 mha (46%), as compared with 149 mha of exclusively residential land use (29%). This would indicate that, in addition to its undeniable residential component, the most recent property bubble in Spain led to a different model of land cover, with a high proportion of industrial, commercial and infrastructure-based land use, with the addition of artificial vegetated surfaces.
4.3. The regional distribution of urban growth in Spain
4.3.1. Growth in the provinces
Analysing the phenomenon in absolute terms, the highest growth (first quartile) occurs in provinces with metropolitan settlements (Madrid, Valencia, Malaga, Barcelona or Seville) and in those affected by tourist development on the coast (Alicante, Murcia or Balearic Islands), as well as in Zaragoza, Navarre, Toledo and León, which could be considered as regional centres among all these, Madrid stands out, doubling the growth figures for the next in line, Alicante.
| Absolute increase | Relative increase | Disproportion | |||||||
| Province | Mha. | % del total | Quartiles | Province | Mha. 1990 | +% | Provinces | GDESP | |
| Madrid | 79.5 | 15.8 | 100% 291mha 57% | Soria [m] | 0.7 | 273.1 | Madrid | 5 | |
| Alicante | 30.9 | 6.1 | Huesca [m] | 3.1 | 147.9 | Toledo | 5 | ||
| Valencia | 28.8 | 5.7 | Valladolid | 7.1 | 140.5 | Murcia | 5 | ||
| Murcia | 25.6 | 5.1 | Castellon | 7.9 | 137.7 | Navarra | 4 | ||
| Barcelona | 21.3 | 4.2 | Navarra | 9.9 | 132.8 | Ciudad Real | 4 | ||
| Sevilla | 20.4 | 4.0 | Salamanca | 6.6 | 130.5 | Leon | 4 | ||
| Toledo | 18.5 | 3.7 | Zamora | 3.3 | 129.8 | Salamanca | 4 | ||
| Malaga | 15.4 | 3.0 | Burgos | 5.9 | 129.8 | Soria | 4 | ||
| Zaragoza | 13.5 | 2.7 | Murcia | 20.7 | 124.1 | Valladolid | 3 | ||
| Navarre | 13.2 | 2.6 | Caceres | 4.9 | 118.6 | Alicante | 3 | ||
| Illes Balears | 13.0 | 2.6 | Ciudad Real | 10.4 | 109.9 | Castellon | 3 | ||
| Leon | 11.8 | 2.3 | Alava | 3.0 | 106.1 | Burgos | 3 | ||
| Ciudad Real | 11.4 | 2.3 | 75% 123mha 24% | Toledo | 17.9 | 103.3 | Cordoba | 3 | |
| Castellon | 10.9 | 2.2 | Leon | 11.5 | 102.3 | Zaragoza | 2 | ||
| Granada | 10.8 | 2.1 | Palencia | 3.7 | 98.6 | Malaga | 2 | ||
| Tarragona | 10.5 | 2.1 | Guadalajara | 8.3 | 97.1 | Valencia | 2 | ||
| Valladolid | 9.9 | 2.0 | Cuenca | 5.7 | 93.8 | Badajoz | 2 | ||
| Cadiz | 9.8 | 1.9 | Albacete | 5.9 | 93.8 | Alava | 2 | ||
| Badajoz | 9.7 | 1.9 | Badajoz | 11.6 | 83.2 | Albacete | 2 | ||
| Salamanca | 8.6 | 1.7 | La Rioja | 4.8 | 79.1 | Caceres | 2 | ||
| Cordoba | 8.4 | 1.7 | Madrid | 102.9 | 77.2 | Cuenca | 2 | ||
| Guadalajara | 8.1 | 1.6 | Cordoba | 10.9 | 76.6 | Guadalajara | 2 | ||
| Burgos | 7.7 | 1.5 | Zaragoza | 17.9 | 75.8 | Huesca | 2 | ||
| Huelva | 6.2 | 1.2 | Alicante | 41.3 | 74.8 | Zamora | 2 | ||
| Almeria | 5.9 | 1.2 | Almería | 8.3 | 70.7 | Sevilla | 1 | ||
| Caceres | 5.9 | 1.2 | Teruel | 2.9 | 69.0 | La Rioja | 1 | ||
| Las Palmas | 5.8 | 1.2 | 50% 57mha 11% | Huelva | 9.4 | 66.6 | Almería | 1 | |
| Albacete | 5.5 | 1.1 | Granada | 16.4 | 65.8 | Granada | 1 | ||
| Cuenca | 5.3 | 1.1 | Malaga | 24.2 | 63.5 | Huelva | 1 | ||
| Girona | 5.3 | 1.0 | Sevilla | 32.8 | 62.1 | Illes Balears | 1 | ||
| Asturias | 5.2 | 1.0 | Illes Balears | 21.2 | 61.3 | Palencia | 1 | ||
| Corunna | 5.0 | 1.0 | Jaén | 7.6 | 60.4 | Barcelona | 0 | ||
| Huesca | 4.6 | 0.9 | Segovia | 6.9 | 59.0 | Vizcaya | 0 | ||
| Jaén | 4.6 | 0.9 | Lugo | 4.6 | 53.9 | A Coruña | 0 | ||
| Zamora | 4.2 | 0.8 | Avila | 4.5 | 52.8 | Asturias | 0 | ||
| Cantabria | 4.1 | 0.8 | Cadiz | 19.7 | 49.9 | Media: 50.3 | Cantabria | 0 | |
| Segovia | 4.1 | 0.8 | Valencia | 69.2 | 41.6 | Las Palmas | 0 | ||
| La Rioja | 3.8 | 0.8 | Lleida | 8.1 | 36.1 | S. Cruz de Te | 0 | ||
| S. Cruz de Tenerife | 3.6 | 0.7 | 25% 31mha 6% | Las Palmas | 17.9 | 32.4 | Girona | 0 | |
| Palencia | 3.6 | 0.7 | Ourense | 3.4 | 28.3 | Tarragona | 0 | ||
| Alava | 3.2 | 0.6 | Cantabria | 14.5 | 28.3 | Cádiz | 0 | ||
| Vizcaya | 3.0 | 0.6 | Asturias | 19.1 | 27.4 | Avila | 0 | ||
| Lleida | 2.9 | 0.6 | Tarragona | 41.2 | 25.6 | Guipúzcoa | 0 | ||
| Pontevedra | 2.7 | 0.5 | S. Cruz de Tenerife | 18.2 | 20.0 | Jaén | 0 | ||
| Guipúzcoa | 2.5 | 0.5 | Guipúzcoa | 12.6 | 19.9 | Lleida | 0 | ||
| Lugo | 2.5 | 0.5 | Girona | 36.4 | 14.4 | Lugo | 0 | ||
| Avila | 2.4 | 0.5 | Pontevedra | 22.0 | 12.4 | Ourense | 0 | ||
| Teruel | 2.0 | 0.4 | Vizcaya | 24.2 | 12.2 | Pontevedra | 0 | ||
| Soria | 2.0 | 0.4 | Barcelona | 180.1 | 11.8 | Segovia | 0 | ||
| Ourense | 1.0 | 0.2 | A Coruña | 51.3 | 9.8 | Teruel | 0 | ||
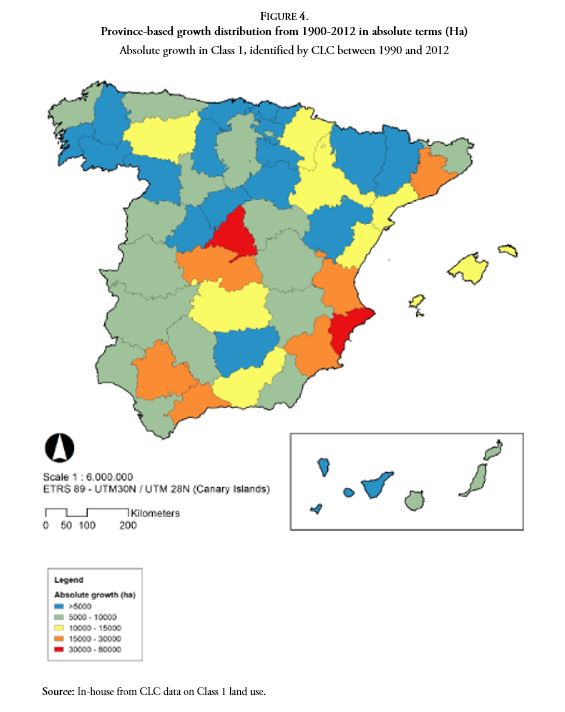
Figure 4.
Province-based growth distribution from 1900-2012 in absolute terms (Ha)
Absolute growth in Class 1, identified by CLC between 1990 and 2012
Source: In-house from CLC data on Class 1 land use.
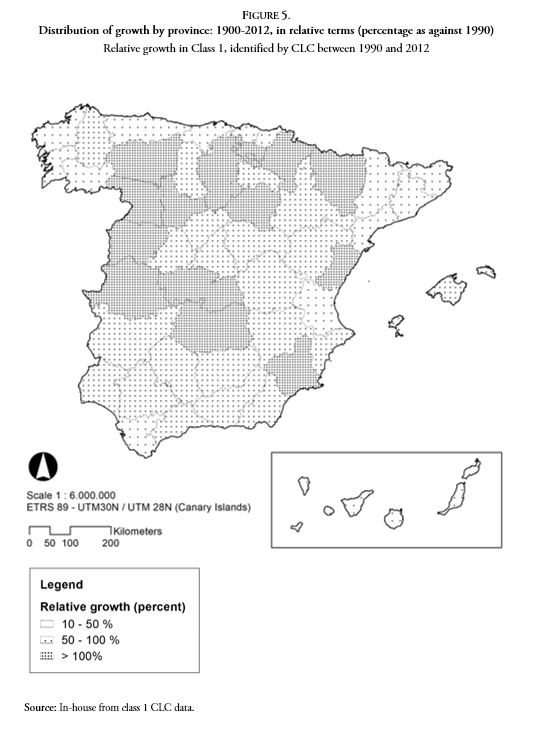
Figure 5.
Distribution of growth by province: 1900-2012, in relative terms (percentage as against 1990)
Relative growth in Class 1, identified by CLC between 1990 and 2012
Source: In-house from class 1 CLC data.If we consider growth in relative terms, that is, the proportion of growth on occupied land in 1990, this changes the order of priority: the greatest growth in this case was found to be almost exclusively in the interior, particularly several provinces within Castilla la Mancha and Castilla y Leon, with no direct relationship with the dynamics of coastal tourist centres or regional hubs. This situation is naturally due, in large part, to the fact that any small relative growth in provinces with large scale previous land use of land (Valencia or Barcelona, for example), meant large scale extension in terms of hectares, placing them at the top of the list in absolute figures, and vice versa (Soria, for example). However, this obvious fact does not explain the specific location of the greatest relative provincial growth levels, which seem to point to the existence of different models of provincial growth over the period, as will be explained later.
To bridge the disparity between absolute and relative growth results, both variables were analysed together, graphically (Figure 6) and statistically (Figure 7).
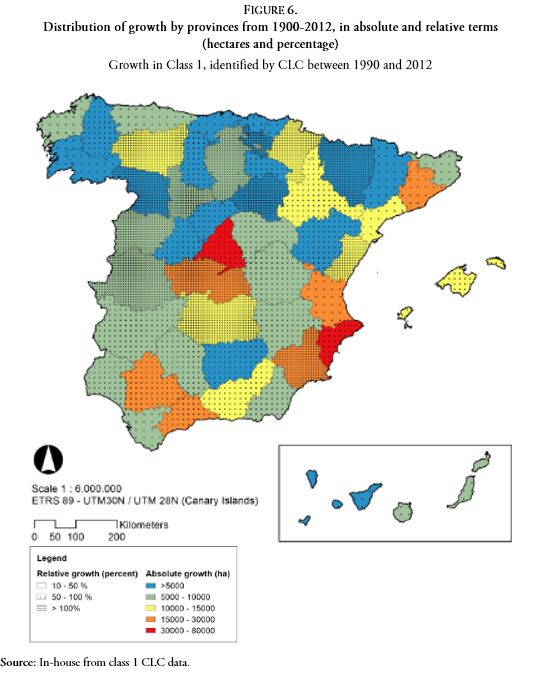
Figure 6.
Distribution of growth by provinces from 1900-2012, in absolute and relative terms (hectares and percentage)
Growth in Class 1, identified by CLC between 1990 and 2012
Source: In-house from class 1 CLC data.
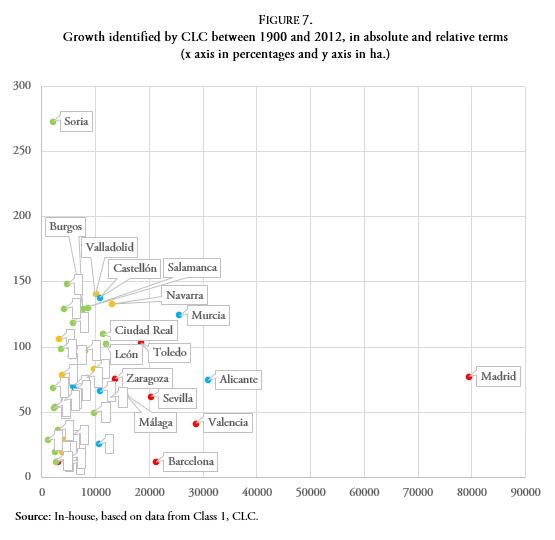
Figure 7.
Growth identified by CLC between 1900 and 2012, in absolute and relative terms (x axis in percentages and y axis in ha.)
Source: In-house, based on data from Class 1, CLC.
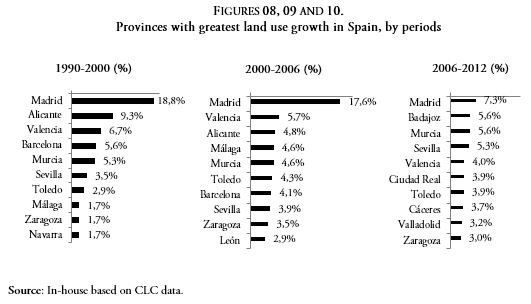
Figures 08, 09 and 10.
Provinces with greatest land use growth in Spain, by periods
Source: In-house based on CLC data.
Taking the integrated statistical analysis described in the methodology, what has been termed disproportionate growth was highlighted, since differential characteristics were observed that led us to propose a typology of disproportions that significantly, though not exactly, corresponded to the different province types.
The most relevant quadrants in the graph are the ones above and, on the right, particularly the upper right, where the provinces with increases in occupied land and relative growth above average values are located (> 10,091 ha and> 50.3%).
Observing the evolution by provinces, initially unequal land consumption becomes evident: in the first period (1990-2000) 45.7% of growth was concentrated within only five provinces (Madrid, Alicante, Valencia, Barcelona and Murcia) while, in the provinces next in line, development was distributed throughout the rest of the country, so that in the most recent period, 2006-2012, the first five provinces only accounted for 27.9%.
Regarding the disaggregation of growth by subclasses of land, the conclusion in section 4.2 was confirmed; the appearance of a new production and infrastructural model (to be added to the residential one), and we can now identify how this was reflected in the development of some provinces.
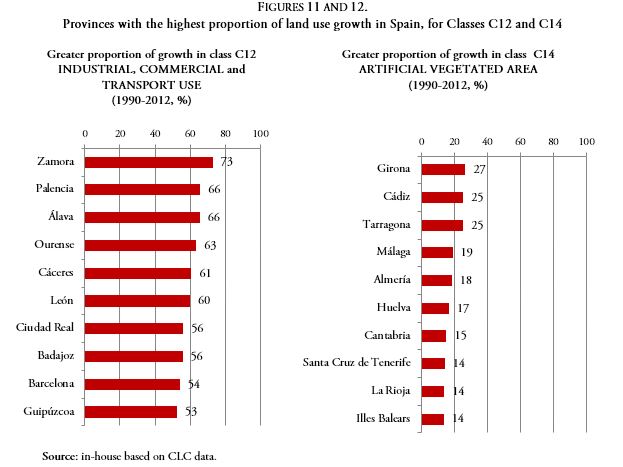
Figures 11 and 12.
Provinces with the highest proportion of land use growth in Spain, for Classes C12 and C14
Source: in-house based on CLC data.
The growth in several interior provinces with no industrial tradition is striking, such as those in the north of Castilla-León: Zamora (73%), Palencia (66%) and León (60%), Extremadura (Caceres and Badajoz) or Ciudad Real, also located in the interior of the peninsula.
The analysis of growth in terms of "disproportionate growth" (see definition in section 3.2), provides the results shown in Table 10 and Figure 13, which are discussed in the following section.
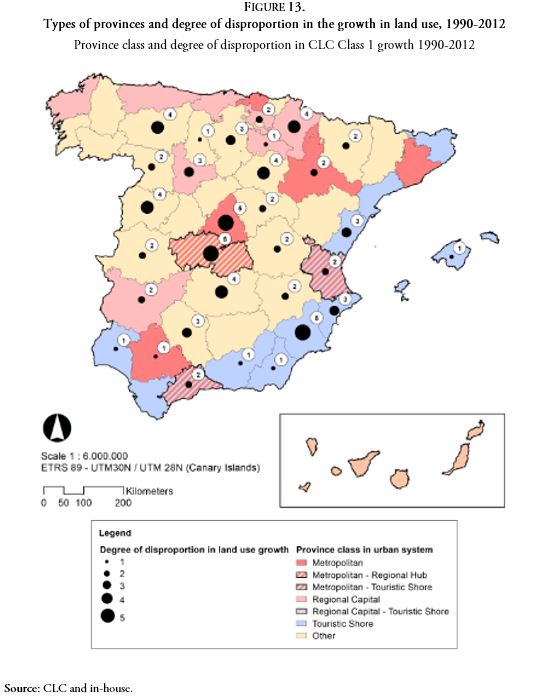
Figure 13.
Types of provinces and degree of disproportion in the growth in land use, 1990-2012
Province class and degree of disproportion in CLC Class 1 growth 1990-2012
Source: CLC and in-house.5. Discussion
Transformation in the land use model during the bubble
The data provided by this study shows that between 2000 and 2012, during the housing bubble and the consequences it produced, in Europe, Spain was by far the country with the greatest growth in land use (218,000 ha, 19% of the European total). And this also occurred at a faster pace. This is consistent with other evidence in the same direction, such as the increase in prices, or urbanization in the previous decade, “substantially more pronounced than in Europe as a whole” (Fernández Duran 2006, 24).
This impressive growth had also already been highlighted in terms of housing permits approved or completed construction in the hottest years of the Bubble (658,000 homes completed in 2006 and 812,000 approved, according to the Spanish Statistics Institute, INE), in 2007, when the fall in the subprime mortgage market took on a global and irreversible character (Pérez, 2014, Burriel 2008). In 2010 Serrano put forward a valuation of occupied land in the most pronounced period of the Bubble, based on data from Spain’s Observatory on Sustainability: between 1997 and 2007, 290,800 new hectares had been developed for uses related to urbanization (Serrano, 2010, 41), so this research confirms what was indicated for other periods within the study.
However, with regard to the result for land use per inhabitant (a decrease of 25% from 1990-2012), the question arises as to whether the decrease in overall density in Spain was due to a reduction in the density of residential areas or, precisely, to the increase in classes 12 and 14, which came largely outside these.
Although these results do not seem to encourage the idea that there has been a general transformation across the board: a "transformation in the urban model of vertical to horizontal land use" (OS 2016, 366-367), this source, CORINE, does not allow us to reach any conclusive results for the time being.7
Another of the most striking results of the research is that the spatial dynamics of the emerging city over the period 1990-2012, considered in isolation, is profoundly different from pre-1990 as regards its main components. Class 11, with residential areas that were 78.8% of land use before 1990, only accounted for 29.2% in the developments of the period 1990-2012, that is, a proportion of less than half, while class 12 (commerce, industry, infrastructure) gained weight from a very minority position, 17.3% before 1990, to take first place in new development (38.7%) and class 14, before this practically insignificant (1.8%), grew to 7.7% of new city construction between 1990 and 2012. This is a change that some authors, such as Fernández Durán, pointed to in their study. This author talks about an “explosion in infrastructures” and “large public projects” (Fernández Durán, 2006, 24). This drastic change in model, due to the extraordinary amount of non-residential land use (infrastructure, industry etc.) had not, however, been indicated by those who had focussed on the "residential" component of the Spanish real estate bubble (Burriel, 2008; Gaja, 2008; Pérez and Gil, 2014), a perception that should be extended thanks to the data presented here.8
The evolution of growth in the provinces
Regarding Spain’s metropolitan areas, this study considers the seven largest, in line with the most recent classification (Roca et al., 2012), which defines 20 main metropolitan systems, the principal ones being: Madrid, Barcelona, Seville, Valencia, Bilbao, Corunna and Malaga, all with more than one million inhabitants (data from INE: National Statistics Institute, 2001). As regards their analysis, it must be said that few papers analyse these from a comparative standpoint. Among these, we would mention Feria’s (2016), which highlights the dynamism and expansion of the Mediterranean metropolitan areas and those of the islands’ coastline (Canary and Balearic Is.), thanks to tourism.
However, the study run here points to the importance of other factors, such as the disproportionate growth of Madrid (grade 5), but also Zaragoza and Toledo (grade 2), both far from the coast. It is striking, on the other hand, that with the index used, the dominant disproportion between metropolitan areas is only slight (grade 1), in provinces such as Valencia, Malaga and Seville.
It is Madrid’s position as a global hub, with the consequent demand for land that this implies, along with other factors of an institutional and production-based nature (Santiago, 2005), that explains its enormously disproportionate growth before, during and after the bubble: Madrid obtains grade 5, while the next metropolitan area in line is grade 3. In the case of Zaragoza, the disproportion is most likely explained by the coincidence of several factors: from the unstoppable trend towards population concentration in the regional capital (Lardies et al., 2011), to other factors such as its logistic location, the arrival of the AVE high-speed train, and the 2008 Expo. With regard to Toledo, the study shows that, after the conclusion of that period, the overflow of the metropolitan phenomenon in Madrid resulted in a greater impact in Toledo than in Guadalajara, as indicated by the housing figures (Burriel, 2008, Cebrián and García, 2011). This also serves to qualify its growth, as Toledo is the site of a significant proportion of the new industrial, commercial and infrastructure land (surprisingly more than Zaragoza, for example) and not just a sprawling residential city (Cebrián and García, 2011). On the contrary, we should mention Barcelona, which did not record disproportionate growth, despite having absolute growth figures higher than some of the previous cases. Something similar occurred in the case of Vizcaya.
On the development of coastal, tourism-based provinces, tourist housing complexes are another well-known factor, in fact, this is the second of the “situations that represent current urbanization processes in Spain”, according to Valenzuela and Salom (2008). This phenomenon gave rise to systematic coastal land use, with a major environmental impact due to the quality of the ecosystems there and the scarcity of land as a resource. For these reasons this phenomenon merited a specific indicator in the reports from Spain’s Observatory on Sustainability. Using CLC, that is, the same source as this study, the 2016 report found that 43% of the land on Spain’s Mediterranean coastal strip (taking the first 500 metres) had already been built on (OS, 2016, 376).
Regarding the provincial distribution of coastal development and compared to the previous era, when massive growth in the Canary Islands (Serrano, 2008) was particularly striking, the results of this study show that in this phase the south-eastern area of the Mediterranean coast (Castellon, Alicante and Murcia) became more significant. As in the case of the Canary Islands, the Balearic Islands did not present growth as disproportionate as in the central Mediterranean area and only stand out in terms of anticipating and launching the bubble, with consequently greater growth in the first period. In this new period, it is the province of Murcia that stands out (grade 4), due to its smaller extension, to a greater extent even that Alicante (grade 3), although Alicante underwent the second largest development in absolute figures for the whole of Spain.
Turning to leisure-related construction, Murcia follows Alicante also in terms of the development of residential estates linked to golf courses (class 14), in second place nationally, just behind Madrid. The Alicante model had already been typified by other authors (Mazón, 2005, Vera, 2005), precisely due to the construction of second homes, and among these those linked to the construction of golf courses. In fact, the appearance on the Mediterranean coast of housing complexes with golf courses - one of the characteristic construction types in the period studied and with the greatest impact on land use - has produced a specific genre, with several studies on this coming specifically from PhD research (Martínez 2006, Lorca, 2007, Villar, 2008 and 2013, Demajorovic 2011, Babinger, 2012, and Morote 2014).
A third characteristic of the growth of Spanish urban development during the bubble that is, perhaps, less known - but which is relevant to this study - is the impact that Spain’s autonomous regional model has had. In Valenzuela (2012) the subject is treated from several different perspectives, concluding that the increasing weight of urbanisation was due to urban growth in regional (Autonomous Community) capital cities. The comparative analysis now undertaken on the development of regional capitals (excluding those of large urban agglomerations) shows that this process of concentrated development continued over that period, at least in the case of autonomous communities without large urban concentration (Valladolid for Castilla-Leon, Toledo for Castilla-La Mancha, Badajoz for Extremadura and Corunna for Galicia). In addition, the disproportionate development of at least three regional centres: Ciudad Real, León and Navarre, is particularly notable, the last of which has maintained growth rates as high as in studies on previous periods (Serrano, 2008) and has developed a considerable proportion of the national total of industrial, commercial and infrastructural land.
In the case of the capital of Castilla-León, in the province of Valladolid, despite the unbalanced development, this may be due to factors such as the arrival of the AVE high-speed line and the building expectations arising from new developments (see Plan Rogers in Soria and Díez, 2011).
Furthermore, the results obtained confirm the great weight of industrial, commercial and infrastructure-based uses in the provinces. Authors such as Fernández Duran (2006), Pitarch (2011) and Díaz Orueta (2011) have characterized the importance of components other than residential in development associated with the “real estate bubble”, from large-scale commercial distribution to logistics parks, both uses that require large amounts of land. Likewise, the so-called infrastructure bubble (Segura, 2013) that has led Spain to have the highest rates of motorways per 1,000 inhabitants, or the construction of the world’s third largest high-speed rail network, only behind China and Japan, could also explain the importance of this type of uses, unprecedented in the history of Spanish urban development. The relative weight of this land use during the bubble was very considerable, reaching between 60 and 70% of new land in provinces with an industrial tradition (Álava, Guipuzcoa or Barcelona), but especially in inland provinces that did not have this (Zamora, Palencia, León, Caceres and Badajoz).
Finally, looking at provinces with lower population density, it is evident that the analysis of growth, not in absolute terms but percentage of land use in 1990, has revealed the relevance and consistency of these provinces as a group, as well as their character of "post-bubble", that is to say, their bubble occurred after that of metropolitan and coastal-tourist developments and possibly mimicking this phenomenon elsewhere. Using a similar ratio (homes built per 1,000 inhabitants), Burriel's study (2008) found similar results: it was not Madrid or Barcelona that grew the most but Málaga, Almería, Alicante, Castellón and Guadalajara.
6. Conclusions
The most significant conclusions from the analysis of land for artificial uses, taking the data from CORINE for the years 1990, 2000, 2006 and 2012, are as follows:
- 1.
The study offers precise data on the impressive scale of the Spanish property bubble at European and even national level. From a quantitative point of view and on a European scale, between 2000 and 2012 Spain recorded the largest amount of artificial land use in Europe (218,200 ha), developing more than Germany, Britain and Italy combined, and 47% more than the country in second place, France.
As regards the entire period of study over the history of Spanish urban development (1990-2012), in these 22 years the urbanized surface area of Spain increased by 504,543 ha, equivalent to half of the already occupied land taken up by cities, towns and infrastructure before 1990 and with a greater surface area than, for example, a country such as Holland.
- 2. On the land use model of this development, the data show the progressive change over the period analysed, highlighting the greater proportion of industrial, commercial and infrastructure uses as opposed to residential. This change contrasts with what occurred in Europe and became more acute during and after the bubble (CORINE data for 2000-2006 and 2006-2012). These uses came to represent 64% of total land use over that last period analysed, compared to 17% for residential land use (between 2000 and 2006 the proportion was 28% for industrial, commercial and infrastructure, compared to 20% for residential). Consequently, if we were to define the Spanish real estate bubble by land use, we would be talking not so much of a residential land bubble but an "infrastructure, industrial, commercial and residential bubble". As for the gross density of development, this fell by 25% over the 22 years, nevertheless the causes are difficult to specify with the available data. In any case, however, with these figures we cannot talk about transferral from a model "of vertical land use to a horizontal one".
- 3. Regarding the provincial distribution of the land use process, the contribution is twofold, since both the provinces that concentrated growth and those that led it are fully described, taking an integrated method to consider absolute and relative growth at the same time.9 Regarding the previous dynamics of Spanish land development, this method confirms the importance of the metropolitan or coastal-tourism dynamics, but with several notably new features: the enormous development in Madrid (5) and, Toledo, collaterally (5) which contrasts with Barcelona or Vizcaya (Biscay) (0) and, in general, the lower development of the rest of the traditional metropolitan areas, all below grade 2, except Zaragoza (3). Regarding coastal tourism areas, the development of the southern Mediterranean coastline (Murcia, grade 4, Alicante and Castellon, grade 3) is more significant than that of the Canary Is. and Balearic Is. that formed part of the previous stage. Finally, this method of comparison attributes great prominence to an element that had scarcely been observed before: what occurred in inland Spain: a crown of regional hubs around Madrid, with extremely disproportionate growth (Navarre, grade 4 and Valladolid, grade 3, both regional capitals, and above all, León, Ciudad Real and Salamanca, all ranked grade 4) - even those with very low population figures, such as Soria (4).
- 4. The analysis of the three periods, 1990-2000, 2000-2006 and 2006-2012, reveals the provinces that acted as a primer for land use during the bubble (Madrid, Alicante, Valencia and Barcelona), with one significant difference: while Madrid continued to lead the process until the end, Valencia and Alicante did so only until 2006, while Barcelona did so only until 2000. This also shows the progressive spread of the phenomenon: if, during the first period, the five provinces with highest participation accounted for 46% of occupied land, in the last period the first five totalled only 28%.
- 5. In the same vein, the last contribution would be to highlight a later land use bubble: that of inland provinces around Madrid (including the two Castillas and Extremadura), probably due to the "contagious" effect from metropolitan and coastal-tourist areas. A characteristic of this delayed bubble was that it was to have very significant proportions of industrial, commercial and infrastructure-based land in areas such as, for example, Zamora (73%) or Palencia (66%), areas without any industrial tradition.
Although the aim of this study was not to delve into the actual causes of the property bubble, it does provide us with a number of lessons to be learned from; firstly, it confirms the over-investment in fixed capital (infrastructures and industrial, commercial and residential land) made by this country, especially in Madrid, in peripheral regional centres, and provinces with lower population; and secondly, the power of the "contagious" effect of dynamics of this type is particularly striking, evident throughout the sequence of land uses described.
Finally, and considering possible future lines of research, one with the greatest potential would be to specify with appropriate data (such as the Spanish Land Register or Catastro), to what extent the Spanish urban model has undergone a transition from vertical land use to horizontal.
References
Babinger, F. (2012). El golf en España: la concentración social y territorial de un fenómeno que trasciende ampliamente lo deportivo. Ería, 88, 185-197.
Barreira, P., González, V., & Bosque, J. (2000-2006). Detección de errores temáticos en el CORINE Land Cover a través del estudio de cambios: Comunidad de Madrid. Estudios Geográficos, 2012, vol. LXXIII, 272, 7-34
Burriel, E. (2008). La “década prodigiosa” del urbanismo español (1997-2006). Scripta Nova, XII, 270 (64).
Cebrián, F., & García, J.A. (2011) Las dinámicas del urbanismo difuso en los entornos de las ciudades en las ciudades de Castilla-La Mancha. In L.M. Frutos & E. Ruiz (Eds.), Comunicaciones XXII Congreso de Geógrafos Españoles “Urbanismo Expansivo de la Utopía a la Realidad” Universidad de Alicante.
Demajorovic, J., Aledo Tur, A., Landi, B., & Mantovani, A. L. (2011). Complejos turísticos residenciales: Análisis del crecimiento del turismo residencial en el Mediterráneo español y en el Litoral Nordestino (Brasil) y su impacto socio-ambiental. Estudios y perspectivas en Turismo, 20(4), 772-796.
Díaz Orueta (2011). Cambio y diversidad de las políticas urbanas en España. El seminario internacional Periferias urbanas y transformación comunitaria: Diálogos México-España. Barcelona cidob.
Díaz-Pacheco, J., & Gutiérrez, J. (2013). Exploring the limitations of CORINE Land Cover for monitoring urban land-use dynamics in metropolitan areas. Journal of Land Use Science.
Esteban, M., & Altuzarra, A. (2016). Local Political Power and Housing Bubble in Spain. Investigaciones Regionales – Journal of Regional Research, 35, 107-127.
EEA. (2000). CORINE Land Cover Technical guide – Addendum 2000 (Technical report N 40). Copenhagen, European Environment Agency.
EEA. (2006). Land accounts for Europe 1990-2000: Towards integrated land, ecosystem accounting (Technical report N11) Copenhagen, European Environment Agency.
EEA. (2007). CLC Technical guidelines (Technical report N17) Copenhagen EUROPEAN ENVIRONMENTAL AGENCY
EEA. (1997). CORINE Land Cover: Technical guide. Copenhagen, European Environment Agency.
Falcón, E., & Serrano, F. (2003). La evolución de los costes de la ejecución de obra de las empresas constructoras ante la burbuja inmobiliaria española, periodo 1997-2003. Observatorio Iberoamericano de Contabilidad y Gestión. http://www.observatorio-iberoamericano.org/RICG/N%C2%BA_6/Carmen%20Esther%20Falc%C3%B3n%20y%20Francisco%20Serrano%20Moracho.pdf
Feria-Toribio, J. M., & Martínez-Bernabéu, L. (2016). La definición y delimitación del sistema metropolitano español: permanencias y cambios entre 2001 y 2011. Ciudad y Territorio, Estudios Territoriales, 48(187), 9-24.
Fernandez Duran. (2006). El Tsunami urbanizador español y mundial. Folleto Virus.
Gaja, F. (2008). Paisajes después del “Tsunami Urbanizador” en el Litoral Mediterráneo Español. El Final del Ciclo de Hiperproducción Inmobiliaria, 1998-2007. http://personales.upv.es/fgaja/publicaciones/USB%20Tsunami.pdf
García-Montalvo, J. (2003). La vivienda en España: desgravaciones, burbujas y otras historias, Perspectivas del Sistema Financiero Español, 78, 1-43.
García-Montalvo, J. (2005). Deconstruyendo la burbuja: expectativas de revalorización y precio de la vivienda en España, Papeles de Economía Española, 109.
González Marroquín, V., Rubiera Morollón, F. & Pérez Rivero, J.L. (2013). Descripción y análisis de la huella urbanística del boom inmobiliario en Asturias mediante Sistemas de Información Geográfica, 1996-2006. Investigaciones Regionales, 27, 115-140.
Haines-Young, R. H. (1999). Environmental accounts for land cover: their contribution to the state of the environment. Transactions of the Institute of British Geographers, 24, 441–456.
Heymann, Y., Steenmans, Ch., Croissille, G., & Bossard, M. (1994). CORINE Land Cover. Technical Guide. Luxembourg: Office for Official Publications of the European Communities.
Jerez Darias, L.M., Martín Martín, V.O., & Pérez González, R. (2012). Aproximación a una geografía de la corrupción urbanística en España. Ería, 87, 5-18.
Lardiés Bosque, R., Castelló Puig, A., & Hernández Navarro, M.L. (2011). ¿Se puede hablar de contra urbanización a partir de los nuevos procesos socio-territoriales en Aragón?. In L.M. Frutos Mejías & E. Ruiz Budría (Eds.), Comunicaciones XXII Congreso de Geógrafos Españoles “Urbanismo Expansivo de la Utopía a la Realidad”. Universidad de Alicante.
Lorca, A. M. G. (2007). Reflexiones sobre el modelo de turismo de golf en un litoral árido: Almería. Paralelo 37º ,19, 209.
Martínez, J., & Esteve, M. A. (2006). El modelo urbanístico litoral de la Región de Murcia. Sociedad y utopía: Revista deficiencias sociales, 28, 233-246.
Mazón, T., & Huete, R. (2005). Turismo residencial en el litoral alicantino: los casos de Denia, Altea, Benidorm, Santa Pola y Torrevieja. In T. Mazón & A. Aledo (Eds.), Turismo residencial y cambio social. Nuevas perspectivas teóricas y empíricas. Alicante: Aguaclara.
Morote Seguido, Á. F. (2014). Tipologías urbano-residenciales del litoral de Alicante: repercusiones territoriales.
Naredo, J.M. (1998). La burbuja inmobiliario-financiera en la coyuntura económica reciente (1985-1995). Siglo XXI, Colección Ciencias Sociales. Madrid.
OS (2016). Sostenibilidad en España 2016. Cumplimiento de los Objetivos de Desarrollo Sostenible de Naciones Unidas. Observatorio de la Sostenibilidad. http://www.observatoriosostenibilidad.com/documentos/SOS16_v23_PDF_final.pdf
Perez A., & Gil, S. (2014). Conflictos de poder sobre el espacio, la ordenación del territorio en España. Balance crítico ante la crisis actual. In M.T. Ayllón (Ed.), Conflictos de poder sobre el espacio. Manual de ordenación territorial a diferentes escalas (II). Universidad Autónoma de San Luis de Potosí. Ed. Eumed.net.
Pozueta, J. (2013). Rasgos urbanísticos del crecimiento residencial asociado a la burbuja inmobiliaria, 1995-2006. In Cien números de Cuadernos de Investigación Urbanística, CIU nº 100 DUyOT-UPM.
Roca Cladera, J., Moix Bergadà, M., & Arellano Ramos, B. (2012). El sistema urbano en España. Scripta Nova. v. XVI, 396.
Rodriguez, J. (2006). Los booms inmobiliarios en España. Un análisis de tres períodos. Papeles de Economía Española. 109. Fundación de las Cajas de Ahorro.
Sánchez, J.E. (2003). El mercado inmobiliario y los promotores: cambios en la gran empresa inmobiliaria. Scripta Nova, Revista electrónica de Geografía y Ciencias Sociales, Universidad de Barcelona, VII, 146(091).
Santiago Rodríguez, E. de. (2011). Madrid, 'ciudad única'. Pautas y lógicas espaciales recientes en la región madrileña. Urban, [S.l.],12, 8-33. http://polired.upm.es/index.php/urban/article/view/459
Serrano, J.M. (2004). Expansión del parque inmobiliario en España. Algunas reflexiones desde la perspectiva territorial. Boletín Económico del ICE Nº 2798.
Serrano, J.M. (2010). La edificación de viviendas en España, final del ciclo y ¿ocaso del modelo? Boletín Económico del ICE Nº 2981.
Siedentop, S., & Meinel, G. (2004). CORINE Land Cover 2000 in nation-wide and regional monitoring of urban land use and land consumption. UVA-Texte, 04/04 ISSN 0722-186X.
Valenzuela, M., (2012). El impacto del modelo autonómico en las ciudades españolas. Una aproximación interdisciplinar. UAM Ediciones 150.
Valenzuela, M., & Salom, J. (2008). Los procesos de urbanización en España. Nuevos factores, nuevas tendencias. Sem. Una reflexión desde la Geografía Española. Madrid. Comité Español de la Unión Geográfica Internacional.
Vera, (2005). El auge de la función residencial en los destinos turísticos del litoral mediterráneo: entre el crecimiento y la renovación. I Congreso de turismo Residencial. Nov. 2005. Departamento de Sociología, Universidad de Alicante. https://rua.ua.es/dspace/bitstream/10045/12368/1/Papers%20de%20Turisme,%2037-38,%20pp.%2095-114.pdf
Villar Lama, A. (2008). Los espacios de golf en el litoral de Andalucía: Patrones espaciales y evolución en el período 1998-2004. Ería 76, 247-266.
Notes
Additional information
JEL classification: O2; R0; Z0.
Corresponding author: ester.higueras@upm.es