Articles
EU Cohesion Policy Performance: Regional Variation in the Effectiveness of the management of the Structural Funds
La política de cohesión de la UE: Variabilidad regional en la efectividad en la gestión de los Fondos Estructurales
 Rosina Moreno rmoreno@ub.edu
EU Cohesion Policy Performance: Regional Variation in the Effectiveness of the management of the Structural Funds
Investigaciones Regionales - Journal of Regional Research, no. Esp.46, pp. 27-50, 2020
Asociación Española de Ciencia Regional

This work is licensed under Creative Commons Attribution-NonCommercial 4.0 International.
Received: 20 February 2019
Accepted: 19 December 2019
Abstract: The effectiveness in the absorption of funds is a permanent challenge for EU member states, and therefore, the analysis of the absorption capacity is needed. The present paper deals with the dimension of the absorption of EU resources and focus on an aspect that has been widely forgotten so far in previous literature: the regional variation in the absorption of the structural funds. Based on EU regional aggregate data on funds allocation and payments provided by the European Commission for the Operating Program 2007-2013 at the NUTS2 level, we observe that full absorption was more the exception than the rule. In addition, the high regional heterogeneity detected in the absorption of the Structural Funds is not only observed across countries but also within the regions in a country, contradicting some explanations that were given in the past about the effect of administrative structures on the absorption capacity. Finally, we offer a discussion on how lack of timely available regional data on EU fund payments hinders the analysis of the effectiveness of the regional absorption of the funds.
Keywords: Funds allocation, Absorption rate, NUTS 2 regions, Funds effectiveness, OP 2007-2013.
Resumen: La efectividad en la absorción de fondos es un desafío permanente para los estados miembros de la UE y, por tanto, resulta necesario analizar la capacidad de absorción de los mismos. Este trabajo aborda la absorción de los recursos de la UE y se centra en un aspecto que hasta ahora ha sido obviado en la literatura anterior: la variabilidad regional en la absorción de los Fondos Estructurales. A partir de los datos agregados regionales de la UE sobre asignación de fondos y pagos proporcionados por la Comisión Europea para el Programa Operativo 2007-2013 en el nivel NUTS2, observamos que la plena absorción fue más la excepción que la regla. Además, la alta heterogeneidad regional detectada en la absorción de los Fondos Estructurales no solo se observa en todos los países sino también entre las regiones de un mismo país, contradiciendo algunas explicaciones que se dieron en el pasado sobre el efecto de las estructuras administrativas en la capacidad de absorción de los fondos. Finalmente, el trabajo ofrece una discusión sobre cómo la falta de datos regionales disponibles a tiempo sobre los pagos de fondos de la UE dificulta el análisis de la efectividad de la absorción regional de los mismos.
Palabras clave: Asignación de fondos, Tasa de absorción, Regiones NUTS 2, Efectividad de los fondos, OP 2007-2013.
1. Introduction: Aims and scope
To reduce disparities across the territories within the European Union (EU), the Regional Policy “targets all regions and cities in the European Union in order to support job creation, business competitiveness, economic growth, sustainable development, and improve citizens’ quality of life” (European Commission. The EU's main investment policy [online]). The funding for such policy is delivered through two different funds, namely, the European Regional Development Fund (ERDF) and the Cohesion Fund (CF), which together with the European Social Fund (ESF), the European Agricultural Fund for Rural Development (EAFRD) and the European Maritime and Fisheries Fund (EMFF), make up the European Structural and Investment (ESI) Funds (European Commission, 2014).
As the ERDF basically aims to assist less developed regions, these funds are mainly allocated to EU regions characterized by low development in terms of per capita GDP (below the 75% of the EU average) as well as to regions with declining traditional industries facing restructuring challenges among others (https://ec.europa.eu/regional_policy/index.cfm/en/funding/erdf/). The orientation implies a clear spatial dimension (Dignan, 1995; McCann, 2015). This is also the case of the ESF which aims at addressing the problems of the labour market in some regions (https://ec.europa.eu/esf/home.jsp; Harrop, 1996). During the 2007-2013 programming period, due to the 2007 and 2014 rounds of enlargements of the EU and the consequent relative increase in the per capita GDP of some regions of the old MS, a transition period was adopted for some of them: 15 phasing-out regions covered by objective 1 (within the Convergence budget) and 15 phasing-in regions included in objective 2 (within the Competitiveness budget). The CF provides assistance to the member states (MS) whose national income per capita is below 90% of the EU average, which were Greece, Spain, Portugal and Ireland at the beginning of the fund in 1992. With the enlargements in 2004 and 2007 this Fund incorporated 10 new MS from Central and Eastern Europe plus Cyprus and Malta and also considered Greece and Portugal. All in all, these funds have been used as a key redistributive mechanism (Leonardi, 2005; Blom-Hansen, 2005).
As highlighted by Pylak (2007, pg 71) “Effective institutions and public administration is a key factor in designing and implementing the growth policy and the economic and social development….. Organisation of the system influences deeply the efficiency and effectiveness of the structural aid and simultaneously the level and quality of resources used”. Indeed, the effectiveness in the absorption of funds is a permanent challenge for EU MS and regions, and therefore, the analysis of the absorption capacity is needed in its different spheres: its scope (the description of the magnitude of such absorptive capacity), its determinants (its main drivers) and its effects (the impact that a high/low absorptive capacity may have on the regional performance). Most of the research on the topic has focused on the two latter aspects, determinants and effects, whereas the literature on the scope of the funds effectively absorbed is almost inexistent. The present paper tries to fill in this gap and deals with the scope of the absorption of EU resources and focus on an aspect that has been widely forgotten so far: the regional variability in the absorption of the Structural Funds (SF) for the whole EU, both countries and regions.
Therefore, the main objective of this paper is to describe the performance of the EU CP in terms of EU funds effectiveness based on EU regional aggregate data on funds commitment and payments provided by the European Commission (EC). Given that the target of the CP are the regions (at NUTS2 level), our spatial analyses are provided at this level. This analysis can give some light on how a policy which is common to all regions in the EU, such as the Cohesion Policy (CP), could be misleading since not all the regions absorb the funds equally.
The paper is outlined as follows. After this introduction, we discuss the different measures that have been used in the literature so far to proxy for the CP performance in terms of the effectiveness in the use of the EU funds and review in which kind of analyses they have been used for. Then, we present the data and discuss the method to construct the indicators of effectiveness at the NUTS2 level. Afterwards, we present a comparative analysis across EU regions on these measures showing the regional differences both within countries and across countries. Finally, in section 5 we offer a review with the main limitations suffered to make this regional analysis and conclude the main findings in section 6.
2. Measures of CP implementation effectiveness: Literature review
Among the indicators commonly used for measuring the CP implementation effectiveness, we find the volume of funding allocated and/or payed and the rate of absorption of the funds. In this section we review the papers that have used these indicators and give information on the way they have been computed.
2.1. Scale of allocations and payments
Focusing on the scale (volume) and structure (distribution across thematic areas) of the funding allocated and/or payed gives information on how the funding was provided to regions across the EU, how it was used and what the money was spent on. Several studies use either the allocations or the payments of the different Structural Funds (SF) for different purposes: i) description of the scale in the use of the SF; ii) study of the determinants of the amounts allocated or payed within the CP for different regions/countries; iii) analysis of the impact of the CP.
Among the studies that describe the regional implementation and performance of the CP (i), we find the report by Gorzelak et al (2016) which analyses the volume of financial allocation in the Operating Programme (OP) 2007-2013 at the NUTS2 regional level (both in per capita and as a share of GDP) as well as their structure across areas. As expected, the allocation of CP funds per capita strongly varied across European regions as a consequence of this policy which is foremost focused on Cohesion countries and less developed regions.
Second, with the objective of studying the determinants of the effectiveness in the implementation of the CP (ii), Fratesi and Perucca (2014) assess the role of specific territorial conditions on ERDF and CF commitments at different category levels in the NUTS3 EU regions in the new MS (NMS) in the period 2000-2006. According to their results, regions more endowed with specific types of territorial capital are more able to gain from policy investment in related fields. With a similar objective, Bouvet and Dall’erba (2010) examine which variables, economic and political, determine the actual funds allocation for each cohesion objective over 1989-99, concluding that economic criteria are not the only determinants of funds allocation, but the political situation within a country/region and the relations between various layers of governance also influence the allocation process.
Third, a significant number of papers analyse the impact of the effectiveness in the CP on economic growth (iii). In order to do it, Percoco (2017) focuses on SF expenditures in the programming period 2000-2006 in the NUTS3 regions. The same is done in Gagliardi and Percoco (2017) concluding that European funds positively contributed to generate economic growth in lagging areas, a phenomenon mostly driven by the successful performance of rural areas close to relevant urban agglomerates. In a similar manner, Mohn and Hagen (2010) analyse the economic growth effects of EU SF, making use of the payments for 126 NUTS1/NUTS2 regions, distinguishing between Objective 1, 2, and 3 payments. Among others, they obtain that Objective 1 payments promote regional economic growth, whereas the total amount of Objectives 1, 2, and 3 do not have a positive and significant impact on the EU regions' growth rates. Similarly, Rodríguez-Pose and Novak (2013) obtain an increasing impact of SF expenditure over time, with more impact in recent programming periods, partly attributed to policy learning mechanisms. Finally, Iatu and Alupui (2011) analyse the progress of Romania in the absorption of SF, through allocations, identifying a number of economic, social, administrative or policy factors affecting the low absorption (measured through allocations) at NUTS3 administrative level for the 2007-2013 period, finding the major influence of policy factors.
2.2. Absorption capacity
Despite part of the literature use the allocations/payments as a proxy of the effectiveness in the implementation of the CP, the primary indication is measured as the level of spending out of the allocated resources, which is known as the absorption rate and computed as the rate that expenditures represent as a percentage of allocation. The absorption capacity can be understood as the degree to which a state/region is able to fully spend the allocated financial resources from the EU funds in an effective way. Boot et al (2001) is considered the first work which systematically put forward the notion of absorption capacity and Cace et al (2009) addressed the concept in relation to EU enlargements, showing how the European diversity reveals different administrative systems in the absorption of the funds.
As signaled in SWECO (2008), “the funding actually received depends on the absorption capacity of the MS and their regions, i.e. their ability to use the financial resources made available from the ERDF and the Cohesion Fund on the agreed actions and according to the agreed timetable” (page 26). This capacity is necessary for making a maximum contribution to economic and social cohesion with the resources available from the EU funds, although it is not a sufficient condition. In any case, the absorption rate is considered a key indicator for the monitoring of the programmes.
Many papers use the absorption rate of the different SF as a proxy of the effectiveness in their use, albeit with different purposes: description of the absorption capacity of different states/regions; analysis of the determinants of the absorption capacity; study of the impact of such absorption capacity on economic, social and territorial cohesion.
Within the first group, one of the first studies measuring and describing absorptive capacity is Hervé and Holzmann (2008), who bring empirical proofs on the capacity of the less developed regions to absorb important amounts of funds allocated to decrease the difference of development across regions. They make a classification of absorption problems based on the concept of government failure. Later, the report by Gorzelak et al (2016), by computing the share that the payments represent over the total funding in the OP 2007-2013, get the picture that implementation began slowly, accelerated in 2012 and by the end of March 2016 more than 90% of the allocations to the ERDF and CF had been paid to MS.
With the objective of investigating the determinants of regional absorption capacity in the EU, Kersan-Skavic and Tijanic (2017), in a recent paper based on 272 NUTS2 regions (the 86 NUTS2 convergence regions and the 186 developed regions with GDP per capita above 75% of the EU average) during the period 2000-2013, confirm that the absorption of EU funds is conditionally affected by regional economic characteristics. Other papers on the determinants of absorptive capacity at the EU level are Iatu and Alupului (2011), Tosun (2014) and Mohl and Hagen (2010), whereas most of the remaining ones are usually focused on case studies or comparison analyses. These papers obtain that labour market characteristics (workers’ educational level and unemployment rates), decentralisation, investments, institutional framework and infrastructure development are significant determinants of the absorption capacity. For our purposes, looking at the proxies these papers use for the measurement of the absorption capacity, Mohl and Hagen (2010) use payments over commitments and Tosun (2014) uses the percentage of ERDF allocations that have been paid out. The latter shows that there are significant differences in absorption performance between old and new MS, the latter performing better new MS absorbed 94.37 per cent of ERDF allocations vs 91.03 for old MS in the 2000-2006 period). Tobit models conclude that ERDF absorption performance is positively correlated with government capacity and negatively with fiscal decentralization and also that those countries with higher income levels are less likely to maximize absorption.
Most of the literature on the determinants of the absorption of the funds are case studies. Markovic et al (2008) analyse if higher absorption effectiveness is connected with a certain form of administration and implementation framework of funds. They focus in the 3 countries with good absorption success: Ireland as the leading country among the EU-15 countries and Estonia and Slovenia as the leading countries among the new accession countries. For their study, they consider that there are different ways to measure absorption: i) the share of the application over total commitments, ii) the share of signed contracts over total commitments, and iii) the share of certified expense claims over total commitments. They focus in the last one, which according to their opinion represents how much money has been transferred to the final recipients. Regarding administration and implementation systems of Cohesion funds in those countries, the authors confirm a high diversity: Ireland has a decentralized managing system with several managing authorities and paying authorities, also on the regional level, while Estonia and Slovenia have a more centralized system on a national level. However, they could not come to a conclusion on which of the three structures facilitates more the absorption of EU funds, concluding that different implementation structures can lead to high absorption results.
The paper by Kersan-Skavic and Tijanic (2017) offers different proxies for absorption capacity (Committed/Decided; Paid/Committed; Paid/Decided). No matter which indicator is used, there are significant differences in the levels of absorptive capacity across EU countries and regions. However, in their regression analysis, they decided to use the indicators payments per capita and payments over commitments as indicators of the regional absorptive capacity.
The absorption capacity of the candidate countries have also been the focus of an important part of the empirical research, such as in Horvat (2003, 2005), Wostner (2008) and Cace et al (2010). In addition to the recommendations they give as to how SF can be used in most effective manner, Horvat (2003) notes the absence of a conceptual framework to comprehensively assess the issue of absorption problems relating to SF, and makes explicit use of the development economics and public choice literatures. Horvat (2005) gives a ‘golden rule’ on the virtuosity of concentrated implementation systems, stating that “the smaller the number of institutions (usually sectoral Ministries) involved at the levels of Management and Programmes (Sectoral and Regional) presented at the level of Programming in the Candidate Countries, the clearer the picture and higher the possibility of better administrative absorption of SF” (Ibíd., p.13). This paper also points to the need to ensure continuity of personnel as well as having close political relationship between the Managing Authority and the Prime Minister. Cace et al (2010) point to the transfer of responsibility towards the new MS, including the absorption of the European funds, which implies an infrastructure harmonized with the European criteria, but lacking the experience to match with the new parameters of competitiveness.
Finally, many papers investigate the impact of the absorption capacity of the funds on economic, social and territorial cohesion both in individual MS and at the EU level: Rodríguez-Pose and Fratesi (2004), Bachtler and Gorzelak (2007), Marzinotto (2012), Molle (2015), McCann (2015), Gorzelak (2017) and Bachtler et al (2017) are among the most well-known and recent ones. There are not common main findings since some obtain that funding under the CP does not affect territorial differentiation, whereas some others observe that the CP drives territorial convergence within individual countries but widens territorial divergence in the whole EU. These discrepancies in the results are not strange, given the different economic and social objectives addressed by the CP, which are often impossible to separate with the data available. A recent special issue in Regional Studies offers some papers showing in what contexts and under what conditions CP can be more effective. All in all, these papers show the relevance of the context in explaining the effect of CP, especially with respect to economic and geographical structure, as well as administrative capacity (Fratesi and Wishlade 2017). At the end of the day, as signalled by Mohl (2013), the impact of CP would depend on the quality of the institutions and government structures. As pointed by Gorzelak et al (2016), CP can be understood as a means to counter the deficiencies in less developed regions and as a way to get the necessary conditions for growth. But it does not assure the impulse of economic activity which is mainly driven by the investments of private actors.
As observed in the literature review made in the paragraphs above, the gap that is missing in the previous literature is the analysis of the scale of the absorption rates at the regional level and covering the whole European Union. There are papers that use the absorption rate at the regional level to analyse its determinants or its effects. However, the analysis of its scope at the regional level is missing for the whole EU. There is no previous literature that considers the variability that exists in the absorption of the funds across countries and across regions. In our opinion, given that the CP is provided in the same way to all the regions that accomplish the requisites for the specific funds, this analysis can give some light on how a policy which is common to all regions in the EU, such as the Cohesion Policy, could be misleading since not all the regions absorb the funds equally.
3. Data and Method
3.1. Data: Availability and limitations
The information with data on the SF and their impact is given in several webpages of the European Commission, with certain overlapping in their content in some cases, making it difficult to follow the information available.
With the specific aim of constructing the different indicators for the effectiveness in the use of the CP we use the regional information provided in the webpage of the DGRegio, Regional Policy, in its second section: Historic data on SF by MS (European Commission. Regional Policy. Data for research [online]).
Although the CP funds include the ERDF, CF and ESF, the latter have very scarce data for the 2007-2013 period, many times not consistent with the data for the former two and with no regional disaggregation given. According to Gorzelak et al (2016), as a consequence of the division of the responsibility between DG REGIO (responsible for ERDF and CF) and DG Employment (responsible for ESF), the data collection was affected, making it difficult to elaborate a common regional database. This is why the ESF, although part of the CP, is not going to be considered in the analysis herein.1
| Data period 1994-99 | Data period 2000-06 | Data period 2007-13 | Data period 2014-20 | |
| Limitations | · Only expenditures · Not consistency across MS · Objectives and Funds not separated · Expenditure typologies incompatible · No reliable regional breakdown | · Still some important gaps at the regional level · Estimations needed for expenditure data in some cases | · The quality of the indicators measuring the impact of the CP is limited (given the non-obligation of this monitoring tool) · Difficulty to assign regions to a particular operational programme · Different NUTS2 classification for allocations and payments | · Too early. Only information on allocations and targets available |
| Improvements | · Data on allocations and expenditures available (without need of estimation) at NUTS level · Consistency improved (for 86 priority themes; 4 form of finance; 10 territorial types; 23 economic activities; NUTS system) · Monitoring of results with 40 core indicators for assessing the outputs of ERDF/CF | · Change from 86 priority themes to 123 intervention fields · Typologies of forms of finance and of territorial dimension modified. · ESF included · Output indicators are compulsory: higher quality |
Before going into the detail on the statistical information available, it is worth noting that regional data available for the 2007-2013 period has increased substantially in comparison with previous programmes. There is information on both allocations and expenditures without the necessity of making estimations, as was needed in the previous period (2000-2006). In the document of the ERDF/DF 2007-2013 ex-post evaluation (European Commission, 2015b) you find information on the main limitations offered by the data, which have been summarized in Table 1.
To avoid repetition, for a detailed description of data that can be used to assess the implementation and performance of the CP for the 2007-2013 programming period across the European regions, look at the table provided in Gorzelak et al (2016, pp. 5-8). In our case, the rest of this section focuses explicitly in the data and method that have been used afterwards to construct the indicators in this paper.
3.2. Method
SF payments and allocations
In the dataset of the DG REGIO (European Commission. European Structural & Investment Funds. Historic EU payments – regionalised and modelled [online]), you can find historic long-term regionalised (NUTS2) annual EU expenditure data for different EU funds - ERDF, Cohesion Fund, EAFRD/EAGGF and ESF. We use this dataset to get the information on the most updated payments (until 2016).
The cumulative allocations to selected projects and expenditure at NUTS2 is provided in the dataset of DG REGIO2. The information on the Allocated amount as well as the Expenditures for the whole programming period are offered both for 2013 and 2014, broken down for CF, ERDF and CF+ERDF (not for ESF) as well as for 86 priorities and for the 4 objectives of the CP (Convergence; Competitiveness; Cooperation; Multi Objective). With this information at hand, we have two indicators that have been used in the literature as a proxy for the effectiveness in the implementation of the CP: funds’ allocations and payments. However, we could argue that these two indicators reflect the scope and magnitude of the CP but not its effectiveness. We need to combine both of them in order to get a more clear picture of the effectiveness in the implementation of the CP. This combination gives place to the absorption rate.
Absorption rates
The absorption rate in one region i in a period of time t is the ratio between expenditures and allocations in such region and time period:
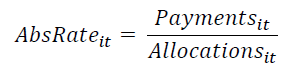
To compute the regional absorption rates we need to use the data on payments and allocations analysed in the previous subsection. Depending on the information used, we can compute the absorption rate in two different ways:
-
The absorption rates can be computed with the data on allocation and expenditures as in the Geography of expenditure study (European Commission 2015b) which includes data on allocations and expenditures updated until 2014. They include information on ERDF and CF. As far as we understand, this is the information used in previous studies (e.g. Gorzelak et al 2016).
-
We try to make a step forward and compute the absorption rate with the information most recently updated with corresponds to the data obtained as the historic EU payments until 2016, which were updated in June 2018.3
The 2007-2013 dataset on payments is based on the NUTS-2013 Classification, whereas the allocations dataset is based on the NUTS-2010 version. To match both versions, we needed to make some adjustments.4 The main advantages and disadvantages of the absorption rates obtained with these two datasets are summarized in Table 2.
| Absorption rates computed with information until 2014 | Absorption rates computed with information until 2016 | |
| Advantages | · Consistent information: same regions for payments and allocations. | · It contains the most updated information. |
| Disadvantages | · It does not contain the most updated information. | · Inconsistent information: 19 regions in both datasets (the one for allocations and the one for expenditures) are different and cannot be matched perfectly. · After the adjustments for matching both datasets (allocations and expenditures), the absorption rate happens to be higher than 1 in 22 regions (see a deeper description in subsection 2.4.2). |
The absorption rates for the ERDF and CF can present a different pattern, given that the latter is designed for infrastructure investments, which tend to be large projects with long planning and implementation periods, so that payments may be substantially lower than commitments. Therefore, the degree of absorption in the case of CF programmes tends to be lower.
The Geography of expenditure study (European Commission 2015b) offers explanations of why allocations and expenditures may differ. It is commented that several programmes in the OP 2007-2013 showed a higher value of expenditures than allocations, especially the ERDF in Spain, where the difference between expenditure and allocation can be found in the Spanish accounting system. According to the LMAs, while expenditure is invariable once it takes place, allocations are subject to revisions, which tends to be the case when the financial plan of a project is modified. “When this happened in a certain year, the cumulative data up to that year may show a positive expenditure but no commitment because the entire (revised) allocation to the selected project(s) is shifted to the next year when the new operation is approved. Due to the features of the accounting systems, there are cases of priorities and/or NUTS codes, in specific OPs, characterised by expenditures larger than allocations, even if the total OP expenditures are lower than total allocations, as we would expect” (European Commission 2015b, p.33).
4. Regional variation in the CP effectiveness
From the revision made to previous literature and empirical evidence on the study of the effectiveness in the use of the Cohesion Funds, we observe that little emphasis has been put in analysing the variation of such effectiveness across regions in the EU. With such objective, we will use the different measures that have been used in the literature to proxy for the effectiveness in the absorption of the SF (allocations, expenditures and the absorption rates) at the NUTS2 level.
4.1. Regional variation in allocations and expenditures
As a first intent to analyse the scale of the CP in the different EU regions, Figure 1 offers the regional distribution of allocations of ERDF and CF in per capita terms in the 2007-2013 period. Among the main beneficiaries we find all the regions of Slovakia, Hungary, Czech Republic (except Praha) and Greece (except Athens) as well the uniregional countries of Estonia, Latvia, Lithuania and Malta. They are followed by some Eastern regions of Poland (5 regions out of 16) and Portugal (5 out of 7), the Eastern Slovenian region of Vzhodna Slovenija, the region of Extremadura in Spain and Calabria in Italy (all of them with values above 1,700 euros per capita for the period). All in all, this shows how the regions receiving more funding correspond to those that are eligible for receiving assistance from the Cohesion Policy. In a second level, we find most of the regions in Romania and Bulgaria, Cyprus, regions in Southern Italy, Eastern Germany (except Berlin) and several Spanish regions (except the ones in the North-East and Madrid). In the remaining regions, the allocation is substantially lower and reflects the pattern of more developed vs less developed regions in most of the countries.

Figure 1.
Allocations per capita. ERDF+CF in OP 2007-2013
Source: Own elaboration.
Figure 2 shows the regional variation of allocations within and across countries, using a simple method of ‘minimum–maximum’ comparison.5 Interestingly, it is noteworthy to mention that the within-country variation is in many cases more important than cross-country variation. Again, the regions receiving the highest funding in per capita terms follow the funding eligibility which is directly linked to its regional convergence objectives, which are based on two groups of areas, namely less developed versus the more developed regions. However, two main additional comments are worth highlighting. First, in general, the more developed countries of the EU do not only show very little values of funding per capita, but they also present a very little regional within-country variability. The only exceptions would be the regions of Cornwall (UKK3) and West Wales and the Valleys (UKL1), Mecklenburg-Vorpommern (DK80) as well as the ultramarine regions of France (FR91, FR92, FR93 and FR94). In the rest of the core countries, such as the Scandinavian ones plus Ireland, Austria, Belgium and The Netherlands, the regional variation within each of them is minimal. Second, the highest regional variability is observed in Greece, Portugal and Hungary, which also present the highest average funding per capita. Italy and Spain also present very high regional variability within each case, although with values of funding per capita much lower than in the previous cases.

Figure 2.
Regional variation of allocations pc. ERDF+CF in OP 2007-2013
Source: Own elaboration.
As indicated in the European Commission (2016b) document, over 90% of the funding available from the ERDF and CF for the 2007-2013 period had been paid by the end of March 2016 to member states, which, since 5% of such funding is held back until the expenditure is formally approved, implies being close to full absorption. In any case, given that allocations and expenditures do not coincide, and that the data on expenditures were updated until 2016 (whereas allocations refer to 2014), we present the spatial distribution and the regional variability for the expenditures in per capita terms to see if there are significant differences in the regional distribution of allocation and expenditures. As argued in subsection 3.1, we have these data updated as for 2016 and 2014. Given the higher accuracy of the former, these are the ones commented. In any case, given that the changes between these two years can also be of certain interest, the reader can find the corresponding figures for 2014 in the Annex.
Figures 3 and 4 basically reproduce the spatial patterns observed for allocations with only very minor changes. In fact, the main difference to highlight is the lower amount of funding that is paid if compared with the one allocated, but there is no change in its spatial distribution. The only remarkable fact when analysing the regional variation within each country is that some regions in Greece (Central Macedonia EL52) and Portugal (the metropolitan area of Lisbon PT17) present a very little amount of payments made at the end of 2016 if compared to the allocations they had. In any case, the risk that the full amount of funding is not absorbed is made explicit in the computation of the absorption rate as commented in the next subsection.

Figure 3.
Expenditures per capita. ERDF+CF in OP 2007-2013 (update 2016)
Source: Own elaboration.
From the discussion in this sub-section as well as the comparison between the figures observed for allocations and payments, several conclusions are in order.
First, since the countries receiving more funding are the ones that have regions which are eligible under the CP and this is related to their GDP per capita, allocations follow the pattern of how developed the different regions are. Consequently, although used by different papers to proxy for the effectiveness of the CP, in our view, allocations only reflect the scope of the CP and even in such a case, only partially since not all the allocations are finally spent. Several reasons such as the lack of co-funding (specially in crises times), insufficient administrative capacity or changes in national/regional governments, may lead to a low absorption of the funds allocated. Thus, the use of the payments instead of the allocations would be preferred.

Figure 4.
Regional variation of expenditures pc. ERDF+CF. OP 2007-2013 (updated 2016)
Source: Own elaboration.
Second, since the allocations of the OP 2007-2013 are updated only until 2014, whereas the payments are made until 2016, the changes occurred in these two years cannot be accounted for in the measure of allocations. But they are in the measure of payments, which at the end would reflect better the reality of the funding under the CP.
Third, when comparing the pattern between allocations and payments, apart from the fact that the amount of funding paid if compared to the one allocated is lower, we observe that the national/regional distribution is very similar for those countries that present lower amount of fundings/payments. The more substantial differences between allocations and payments are observed in the case of the countries with more allocations. Greece, for instance, is the first country in the ranking of allocations per capita, but goes down to the fourth position when the real payments are accounted for. Similarly, Portugal decreases from the 3rth to the 6th position and Slovakia from the 4th to the 8th one. On the contrary, Czech Republic and Latvia improve their position, since they are able to absorb the funds to a higher extent than some other countries with a lot of allocations. A better picture of the pattern of absorption of the allocated funds can be gained if the absorption rate is computed, as done in the subsequent subsection.
4.2. Regional variation in absorption rates
As commented in subsection 3.2, the regional absorption rates for the OP 2007-2013 can be computed with data on expenditures respectively updated until 2014 or 2016. Although one may think that it is better to use the one in 2016 given its higher correspondence to reality, we have also computed it with the data in 2014 and then analyse the differences encountered. This is done because, in many cases, researchers start working with the data as soon as they are available. Since both data on allocations and expenditures for the OP 2007-2013 were made public at the end of 2014, many contributions in the economic literature used such data. In our case, we will do the exercise of computing the absorption rates with data in both years and will compare the resulting rates in order to get conclusions on the deficiencies/limitations that using the initial released data of 2014 would imply in the studies that used it.
4.2.1. Absorption rates computed with expenditures updated until 2014
With the data available until 2014, two regions present absorption rates slightly higher than 1: the region of Herefordshire, Worcestershire and Warwickshire in the UK (UKG1, with a rate of 1.06) and the Dutch region of Overijssel (NL21, with a rate of 1.01). Looking at the detail of the data for those regions, the mismatch is caused by certain priorities of the operating program for such regions, where the cumulated expenditure increased from 2013 to 2014, without changing the amount allocated. This gives rise to an absorption rate for that priority higher than 1. It would be desirable that this type of information was more accurate, otherwise one gets a distorted image. The solution would come from checking the allocated amount at the end of the period, when the expenditures have finished. However, this information is not publicly available.

Figure 5.
Absorption rates. ERDF+CF in OP 2007-2013 (updated 2014)
Source: Own elaboration.
Leaving apart these two cases, according to Figures 5 and 6, we observe that an absorption rate of 100% is never accomplished. In the case of Malta it is almost so (99%) and 15 additional regions present an absorption of allocated resources higher than 90%. This group includes seven Dutch regions, four German, two British and one Swedish (Stockholm SE11) and Austrian (Luxembourg AT34). The lowest absorption rates are presented in the two regions of Croatia (32% and 36%) as well as seven Romanian regions (out of 8), with rates in between 32% and 44%. Also two Italian regions (Campania ITF3, and Calabria ITF6), three Greek (West Makedonia GR13, West Ellada GR23 and Creta GR43) and one Spanish (Melilla) present rates in between 44% and 50%. The average absorption rate is 73%, observing that most of the regions have absorption rates between 60% and 75%. The Scandinavian countries tend to have high absorption rates (Sweden, Finland, Denmark), which in the Gorzelak et al (2016)’s report is said to be due to their good quality of government. Although this is probably a possible reason, according to our conversations with the LMAs, it could also be related to the low amount of allocations they receive because of their high level of development, which would make it easier for the local authorities to manage the funding. In a similar manner, the regions and countries with very low absorption rates tend to be regions/countries with high amount of allocations, making it more difficult to manage the funds. This could be the case of Romania and Greece. However, there are exceptions to this difficulty in dealing with massive funds, since regions in some Baltic countries and in Spain present high levels of allocations with high absorption rates. On the contrary, Croatia presents very low absorption of resources with little funding.

Figure 6.
Regional variation of absorption rates. ERDF+CF. OP 2007-2013 (updated 2014)
Source: Own elaboration.
Finally, it is interesting to highlight that the highest regional variations in absorption rates are observed in the UK, followed by the Netherlands, Spain and Italy, with regions close to the full absorption together with regions that have absorbed less than 50% of the allocations until 2014.
All in all, we observe that full absorption of the structural funds was more the exception than the rule. More interesting and novel is the confirmation of the sizeable regional differences between countries, and specially regions, in the absorption of the funds allocated.
4.2.2. Absorption rates computed with expenditures updated until 2016
With the data on expenditures updated until 2016, the variability of the values obtained for the absorption rates increases. In fact, the absorption rate happens to be higher than 1 in 22 regions6, although in 13 of those regions the absorption rate is below 1.1. The latter would not represent a major concern since some multi-regional projects are subject to regional imputation of the final expenditure which is hard to connect with the initial allocation of the budget of such projects. However, in seven regions the rate is in between 1.2 and 1.9 (one Belgian, two German, two Greek, one French and one British) and in two Belgian cases it is even higher than 2 (Brabant Wallon and Prov. Luxembourg). Among the different reasons behind these values, one may think of the possibility that some countries may have carried out transfers of expenditure between regions that are not reflected in the allocated amounts. It could also be the case that there are non-regional programs and the difference lies in the imputation of spending to one region or another after the program period is closed. Although it would be good to have information on these issues, unfortunately, this goes beyond what is in our hands with the information available online.

Figure 7.
Absorption rates. ERDF+CF in OP 2007-2013 (updated 2016)
Source: Own elaboration.
Next, we analyse which is the level of correlation between the absorption rate computed with data until 2014 and the one in 2016. We have computed it for the 253 regions for which there is an exact matching in both NUTS2 classification (2006 and 2010) and we observe that it is surprisingly low (0.10). If we assume that the values for expenditures are much more accurate in 2016, we get that the picture obtained in 2014 is far from reality. Thus, Figure 7 offers the spatial distribution of the absorption rates with the information updated until 2016. Indeed, we observe important changes in the ranking of the rates of absorption between 2014 and 2016.
Again, we observe an important national variation in the rate of implementation. At the end of 2016, Greece had only claimed 67% of the funding for the period (48% if we discard the two regions with an absorption rate anomalously higher than 1.5), and Luxemburg reports 66%, values much lower than in the rest of the countries. They are followed by Denmark (67%), Austria (70%), Belgium (131% if all regions are considered and 72% without the two regions with absorption rates higher than 150%), Hungary (73%), Italy (73%), Spain (74%) and Cyprus (74%), all of them with shares lower than 75%. On the contrary, Estonia (97%), Lithuania (94%), Slovenia (92%), Croatia (91%), Germany (91%), Czech Republic (90%), Latvia (90%), France (89%), Malta (89%) and Poland (89%) presented shares over 89% in 2016.
It is difficult to extract conclusions on the reasons behind the national pattern observed, since very different countries are in both groups (the highest and the lowest values for absorption of the funding). One possible explanation of this high heterogeneity could be related to the fact that the absorption rate depends on cultural factors as well as administrative structures (Gorzelak et al 2016). However, the regional variability within each country is also very high, a fact which is especially true for some of the more developed economies in the EU (see Figure 8). Indeed, the highest within-country differences of the absorption rates among different regions are observed in the UK, Germany, Austria, France, Italy, Netherlands and Spain. This variability is very low, though, in the case of the Scandinavian countries and most of the Eastern countries.

Figure 8.
Regional variation of absorption rates. ERDF+CF in OP 2007-2013
(updated 2016)
Note: Regions with absorption rates higher than 1.5 not included: Brabant Wallon (BE, 5.94), Luxembourg (BE, 2.00), East Makedonia (EL, 1.88), Thessalia (EL, 1.58).
Source: Own elaboration.Do we obtain the same conclusions on how the different EU countries and regions absorb the structural funds of the CP with the data in 2014 and in 2016? We observe important differences that can be summarised as follows. First, there are more regions in 2016 that present absorption rates higher than 1. Some potential explanations could be related to the transference of funding across regions within a country (not reflected in the data of allocations), or the characteristic of some non-regional programs whose imputation is made after the OP is closed. Second, the variability of the values observed for the absorption rates in 2016 is higher than in 2014, probably because the authorities in each country had to make some final assignments to close the program, which were not made yet in 2014. Third, the most remarkable differences between the absorption in these two years relates to countries which in 2014 presented absorption rates above the average (e.g. Sweden, Finland, Denmark, Austria, Luxembourg) that in 2016 were below the average, and the opposite for the case of Croatia, Czech Republic, France, Poland and Portugal (below the average in 2014 and above in 2016). It seems therefore that countries with more regions eligible for funding tend to absorb more in the last years of implementation of the programme. Thus, the fact of having a higher absorption rate in 2014 does not only imply that some regions have been able to use their funds earlier on, which might be related to the capability of regions to implement policies but to other reasons. As a final remark, we observed that the level of correlation between the absorption rates computed with data in 2014 and 2016 is surprisingly low. All in all, the important differences would imply that the conclusions obtained in papers using the absorption rate with the numbers updated right after (2014) would lead to misleading conclusions.
5. Discussion on data availability to proxy for the effectiveness in the implementation of the CP
An important added value of the paper is the discussion made on how lack of timely available regional data on EU fund payments hinders the analysis of the effectiveness of the regional absorption of the funds. This is expected to change in the case of the current programming period as a result of the efforts made by the European Commission in making data on expenditures readily available. However, comparability with previous programming periods will not be possible. Additionally, other shortcomings can remain due to complexities in the management and accounting of the funds of the Cohesion Policy. Since these shortcomings may affect the quality of structured quantitative analyses, we believe it is interesting to highlight the limits represented by such problems. They can be summarised as follows:
-
Lack of timely available data on EU funds payments. Although the OP finished in 2013, the MS could make expenditures until March 2016. Therefore, it is impossible to analyse the effectiveness of the OP 2007-2013 at the regional level until the end of 2016 (3 years after the closure of the program). In addition, this paper has shown that the absorption rates computed with payments updated until 2014 and 2016 present a different scenario, so that it is necessary to wait until 3 years after the official closing of the programme to have reliable data.
-
Changes in the data of allocations along time. In the cases in which the programme has just finished, and not all payments have been made, ”commitment data may safely be used as a proxy for payments also concerning regional variations” (SWECO 2008). In any case, it is necessary to highlight that the data on allocations also change along time: in most of the cases, the amount of allocations for the OP 2007-2013 given in 2014 is higher than the allocations given in 2013; but for some categories of expenditure and for some regions, it can be the opposite, that is, the value in 2014 is lower than in 2013. The most plausible explanation for this fact seems to be that the allocations have been re-directed to different regions than initially planned. As a consequence, the analysis of effectiveness of the OP cannot be done with reliability when the programme has just finished not only because of lack of payments but also because of changes in the allocations for each region.
-
Lack of comparable data on EU funds payments and allocations. Due to the lack of a harmonized NUTS2 classification between allocations in 2014 and payments updated until 2016 (shifts not just in codes of the regions but also in boundaries), it is not possible to make a perfect match of both magnitudes to obtain the absorption rates as well as the speed in the implementation of the funds.
-
Accounting systems that do not reflect exactly what is really done on ground. Due to the features of the accounting systems, there are cases of priorities and/or NUTS codes, in specific OPs, characterised by expenditures larger than allocations, because the cumulative data up to a certain year may show a positive expenditure but no commitment because the entire (revised) allocation to a selected project(s) may be shifted to another following year when a new operation is approved. It can also be the case that some countries carry out transfers of expenditure between regions that are not reflected in the allocated amounts.
-
Absorption rates very different at the end of the programming period and when the program is actually closed and all payments made. Comparing absorption rates in 2014 and 2016, the changes are very important. Thus, the computation of such indicator in 2014 does not seem to be very reliable.
-
Different reliability of the data for the different SF. The reliability of the data payments for the ERDF and CF at the NUTS2 level is much higher than in the case of the ESF, which cannot be easily regionalized. In addition, the information for the allocations is only given for ERDF and CF. These two reasons prevent us from computing the absorption rates for the ESF. With respect to the absorption rates for ERDF and CF, we have observed that the degree of absorption in the case of CF programmes tends to be lower given that the latter are designed for infrastructure investments, which tend to be large projects with a long planning and implementation periods, so that payments may be substantially lower than commitments.
-
Difficulty in comparing data between programming periods. Despite not being a main purpose of this paper, the data on expenditure for the 2000-2006 and 2007-2013 programmes are not fully comparable because of lack of correspondence of NUTS2 classifications and because of being created with different methods and from different sources. The 2007-2013 data on expenditures were collected from management authorities, which is different from before since in 2000-2006, expenditure was estimated on the basis of payments approved by DG Budget (European Commission, 2015a). As a consequence, although the absorption rates can be computed for both programmes, they are many issues that constrain consolidation between them.
-
No disaggregation of expenditure categories possible in the analysis of absorption rates. We cannot compute the absorption rates for different areas of expenditure given that the information on the most updated expenditure is not disaggregated for different areas (contrary to the information on allocations which is disaggregated). Therefore, if one wants to analyse the structure of the absorption rates for different priorities, it is needed to do it with the information of expenditures available until 2014, which is not the most updated and reliable dataset (this is done in Gorzelak et al, 2016).
6. Conclusion
The effectiveness in the absorption of funds is a permanent challenge for EU MS and regions, and therefore, the analysis of the absorption capacity is needed in its different spheres. Existing literature on the topic has mainly studied the determinants and effects of the absorption capacity, whereas the literature on the scope of the funds absorbed is almost inexistent. With the idea of filling in this gap, in this paper we analyse the scope of the absorption of EU resources at the regional level. We are mainly interested in the high regional heterogeneity in the absorption of the Structural Funds (SF) for the whole EU.
Despite the multiple deficiencies in the data available, the empirical analysis in this paper has shown that full absorption of the structural funds of the European Commission in the OP 2007-2013 was more the exception than the rule. The low absorption rates can be thought to be related to the crisis that most European economies suffered during most of the OP, which may have implied delays due to the inability to carry out planned payments because of troubles of getting the co-funding or because of investing being deferred in the framework of the insecurity produced by the crisis. However, the LMAs also had the opportunity to compensate the economic recession by growing the rate of implementing programmes. Consequently, the economic cycle could have influenced the absorption rate in both directions.
Summing up, the average absorption rate in the OP 2007-2013 is 73%, mostly ranging between 60% and 75%, with the Scandinavian countries presenting mainly high absorption rates (Sweden, Finland, Denmark). Two reasons can be behind: on the one hand, their good quality of government and on the other, the fact that they receive a low amount of allocations due to their high level of development, which would make it easier for the local authorities to manage the funding. Similarly, with very low absorption rates we find regions/countries with high amount of allocations, making it more difficult to manage the funds (Romania and Greece, for instance). However, regions in some Baltic countries and in Spain present high levels of allocations together with high absorption rates, representing an exception to the beforehand rule.
Previous literature has highlighted that national differences in the absorption rates could be related to the fact that the level of absorption depends on cultural factors as well as administrative structures. Nevertheless, this contradicts the huge regional variability we also find within each country, a fact which is especially true for some of the more developed economies in the EU: UK, Germany, Austria, France, Italy, Netherlands and Spain present the highest within-country differences of the absorption rates among their regions, whereas the variability is very low for the Scandinavian and most of the Eastern countries. Therefore, cultural and administrative differences are not the only explanation for regional differences observed in the level of absorption of the EU funds.
In addition to the explanations given above, the Commission has detected some additional factors which deferred the absorption of funds in the OP 2007-2013. Among others, the late start of programmes due to the extension of the previous period, changes in EU legislation, changes in national and regional governments (with the corresponding changes in their institutions) and the national sectoral reforms to overcome the crisis.
An additional added value of the paper is the discussion made on how lack of timely available regional data on EU fund payments hinders the analysis of the effectiveness of the regional absorption of the funds. In this sense, the changes in the data of allocations along time as well as the lack of comparable data on EU funds payments and allocations complicate the reliable analysis of effectiveness of the OP. However, the reliability of the data payments for the ERDF and CF at the NUTS2 level is much higher than in the case of the ESF, which cannot be easily regionalized. In addition, it has not been possible to compute the absorption rates for different areas of expenditure given that the information on the most updated expenditure is not disaggregated for different areas (contrary to the information on allocations which is disaggregated). These shortcomings are among the main ones the European Commission should put its efforts from a statistical point of view.
Finally, the measures on absorption capacity at the regional level, as the ones computed in this paper, can be used for several future analyses. Indeed, some are already included in the PERCEIVE project and are part of the present special issue. On the one hand, the paper by Cunico, Aivazidou and Mollona (2020) analyse if the policy’s performance is satisfactory as well as the extent to which the policy is effectively communicated to citizens. Through a novel qualitative framework that stimulates a holistic analysis of the causal mechanisms behind, these authors use the absorption capacity to analyse how the effectiveness in the management at a local managing authority level impact on projects’ quality, and the communication processes that reinforce citizens’ awareness about the Union’s role in funded projects. Also, the paper by López-Bazo (2019) assesses the influence of the efficiency in the deployment of the Cohesion Policy funds in the region on its citizens’ attitudes towards the EU. The author uses the so-called absorption rate that we have defined at the regional level. All in all, a measure on the effectiveness in the absorption of the funds at the regional level may stimulate a discussion on Cohesion Policy by providing policy-making insights for designing efficient schemes to improve the actual and the perceived performances of such policies.
References
Bachtler, J., & Gorzelak, G. (2007). Reforming EU CP, Policy Studies, 28(4), 309-326.
Bachtler, J., Berkowitz, P., Hardi, S., & Muravska, T. (eds) (2017). EU CP, Reassessing Performance and Direction, Routledge, Abindgon-New York.
Baslé, M. (2006). Strengths and weaknesses of European Union policy evaluation methods: Ex-post evaluation of Objective 2, 1994–99, Regional Studies, 40(2), 225–235.
Bernini, C., & Pellegrini, G. (2011). How are growth and productivity in private firms affected by public subsidy? Evidence from a regional policy, Regional Science and Urban Economics, 41(3), 253–265.
Blom-Hansen, J. (2005). Principals, agents, and the implementation of EU cohesion policy. Journal of European Public Policy, 12(4), 624-648.
Boot, L., de Vet, J-M., & Feekes, F. (2001). Absorption capacity for SF in the regions of Slovenia, Final Report, NEI, Rotterdam.
Bouvet, F., & Dall’erba, S. (2010). European regional SF: How large is the influence of politics on the allocation process?, JCMS: Journal of Common Market Studies, 48, 501–528.
Cace, C., Cace, S., Iova, C., & Nicolăescu, V. (2009). Absorption capacity of the SF. Integrating perspectives, Revista de cercetare şi intervenţie socială (Review of Research and Social Intervention), 27, 7–28.
Cace, C., Cace, S., Iova, C., & Nicolăescu, V. (2010). Capacity of Phare and SF absorption: pre-accession versus post-accession, Revista de Cercetare Interventie Sociala, 28, 78-96.
Cunico, G., Aivazidou, E., & Mollona, E. (2020). European Cohesion Policy performance and citizens’ awareness: A holistic System Dynamics framework. Investigaciones Regionales - Journal of Regional Research, this issue.
Dignan, T. (1995). Regional disparities and regional policy in the European Union. Oxford Review of Economic Policy, 11(2), 64-95.
ESPON (2015). The Territorial Effects of the SF (1994-1999) - ESPON 2005, study 2.2.1 http://www.espon.eu/main/Menu_Projects/Menu_ESPON2006Projects/Menu_PolicyImpactProjects/structuralfundsimpact.html
European Commission (2003). A Study on the Efficiency of the Implementation Methods for SF, Final Report, ÖIR in association with LRDP and IDOM. DG Regional Policy.
European Commission (2014). Investment for Jobs and Growth. Sixth Report on Economic and Social Cohesion, Luxemburg: Office for Official Publications of the European Communities.
European Commission (2015a). EU payments to MS with a breakdown by programming periods, MS, funds and years. Directorate-General for Regional and Urban Policy - Regional Policy – InfoRegio.
European Commission (2015b). Geography of expenditure. WP13. Ex post evaluation of CP programmes 2007-2013, focusing on the European Regional Development Fund (ERDF) and the Cohesion Fund (CF). Directorate-General for Regional and Urban Policy. WIIW, Ismeri Europa.
European Commission (2016a). Ex post evaluation of the ERDF and Cohesion Fund 2007-2013. Directorate-General for Regional and Urban Policy. SWD(2016) 318 final.
European Commission (2016b). WP1: Synthesis report. Ex post evaluation of CP programmes 2007-2013, focusing on the European Regional Development Fund (ERDF) and the Cohesion Fund (CF). Directorate-General for Regional and Urban Policy. Applica and Ismeri Europa.
European Commission (2016c). Establishment of consolidated financial data 1989-2013. Directorate-General for Regional and Urban Policy.
European Commission (2017). Regionalisation of ESIF payments 1989-2015. Directorate-General for Regional and Urban Policy.
European Commission (2019). The EU's main investment policy [online]. Retrieved October, 29, 2019. https://ec.europa.eu/regional_policy/en/policy/what/investment-policy/
European Commission (2019). Regional Policy. Data for research [online]). Retrieved October, 29, 2019. http://ec.europa.eu/regional_policy/EN/policy/evaluations/data-for-research/
European Commission (2019). European Structural & Investment Funds. Historic EU payments – regionalised and modelled [online]. Retrieved October, 29, 2019. https://cohesiondata.ec.europa.eu/Other/Historic-EU-payments-regionalised-and-modelled/tc55-7ysv
Fratesi, U., & Wishlade, F.G. (2017). The impact of European CP in different contexts, Regional Studies, 51(6), 817-821.
Fratesi, U., & Perucca, G. (2014). Territorial capital and the effectiveness of cohesion policies: An assessment for CEE regions. Investigaciones Regionales, Special Issue 2014, 165–191.
Gagliardi, L., & Percoco, M. (2017). The impact of European CP in urban and rural regions, Regional Studies, 51(6), 857-868.
Giordano, B. (2017). Exploring the role of the ERDF in regions with specific geographical features: islands, mountainous and sparsely populated areas, Regional Studies, 51(6), 869-879.
Gorzelak, G. (2017). CP and regional development, in: Bachtler J., Berkowitz, P., Hardi, S. & Muravska, T. (eds) (2017) EU CP, Reassessing Performance and Direction, Routledge, Abindgon-New York, 33-54.
Gorzelak, G., Hryniewicz, J., Kozak, M., Ptoszaj, A., Rok, J., & Smetkowski, M. (2016). Data review and mapping of CP implementation and performance. Report COHESIFY research paper 7. Centre for European Regional and Local Studies (EUROREG) University of Warsaw.
Harrop, J. (1996). Structural funding and employment in the European Union. Books.
Herve, I., & Holzmann, R. (1998). Fiscal Transfers and Economic Convergence in the EU: An Analysis of Absorption Problems and an Evaluation of the Literature, NOMOS, Baden-Baden.
Horvat, A. (2003). Absorption Problems in the European Union’s SF Focussing on Administrative Absorption Capacities in the Candidate Countries. Vienna University of Economics and Business Administration, Dissertation, December 2003.
Horvat, A. (2005). Why does Nobody Care About the Absorption. Some Aspects Regarding Administrative Absorption Capacity for the EU SF in the Czech Republic, Hungary, Slovakia and Slovenia before Accession, WP 258/2005, WIFO, Wien.
Iatu, C., & Alupului, C. (2011). SF absorption in Romania: Factor analysis of NUTS 3 level, Transformations in Business & Economics, 11, 612–630.
Kersan-Škabić, I., & Tijanić, L. (2017). Regional absorption capacity of EU funds, Economic Research-Ekonomska Istraživanja, 30(1), 1191-1208.
Leonardi, R. (2005). Cohesion policy in the European Union. The Building of Europe. London.
López-Bazo, E. (2019). Effect of the efficiency in the deployment of CP funds. In “Report on the results of the convergence analysis of EU citizens' identification with the EU project, Report PERCEIVE Project (Perception and Evaluation of Regional and Cohesion Policies by Europeans and Identification with the Values of Europe), Deliverable 2.5. AQR-Research Group, University of Barcelona.” Pages 100-104.
López-Bazo, E., & Moreno, R. (2019). Report on the results of the convergence analysis of EU citizens' identification with the EU project, Report PERCEIVE Project (Perception and Evaluation of Regional and Cohesion Policies by Europeans and Identification with the Values of Europe), Deliverable 2.5. AQR-Research Group, University of Barcelona.
López-Rodríguez, J., & Faíña, A. (2014). Rhomolo and other methodologies to assess the European CP, Investigaciones Regionales - Journal of Regional Research, Special Issue 2014, 5–13.
Markovič Hribernik, T., Kirbi, M., & Vek, U. (2007). Institutional Regulation and the Effectiveness Of Absorbing EU Funds: The Experiences of Ireland, Estonia and Slovenia, Journal for General Social Issues, 17(6), 1219-1239.
Marzinotto, B. (2012). The growth effects of EU CP: A meta-analysis, Bruegel Working Paper 2012/14.
McCann, P. (2015). The Regional and Urban Policy of the European Union. Cohesion, Results, Orientation, Smart Specialization, Edward Elgar, Cheltenham, UK, Northampton, MA, USA.
Mohl, P., & Hagen, T. (2010). Do EU SF promote regional growth? New evidence from various panel data approaches, Regional Science and Urban Economics, 40, 353–365.
Molle, M. (2015). Cohesion and Growth: the Theory and Practive of European Policy Making, Routledge, Abingdon.
Percoco, M. (2017). Impact of European CP on regional growth: does local economic structure matter?, Regional Studies, 51(6), 833-843.
Pylak, C. (2007). Intelligent Region Management= Intelligent Absorption of EU funds. Romanian Journal of Regional Science, 1(1), 70-80.
Rodríguez-Pose, A., & Fratesi, U. (2004). Between development and social policies: the impact of European SF in ‘Objective 1’ regions, Regional Studies, 38(1), 97-114.
Rodríguez-Pose, A., & Novak, K. (2013). Learning processes and economic returns in European CP, Investigaciones Regionales, 25,7–26.
Šumpíková, M., Pavel, J., & Klazar, S. (2003). EU Funds: Absorption Capacity and Effectiveness of their Use, with Focus on Regional Level in the Czech Republic. Grant Agency of the Czech Republic No 402/03/1221.
SWECO (2008). Final Report - ERDF and CF Regional Expenditure. Stockholm.
Tosun, J. (2014). Absorption of regional funds: A comparative analysis, JCMS: Journal of Common Market Studies, 52(2), 371–387.
Wostner, P. (2008). The Micro-efficiency of EU CP, European Policies Research Centre, WP64.
Zaman, G., & Georgescu, G. (2009). Structural fund, absorption: A new challenge for Romania?, Romanian Journal of Economic Forecasting, 1, 136–154.
Annex. Geographical distribution of expenditures of the OP 2007-2013 (update 2014)

Figure A1.
Expenditures per capita. ERDF+CF in OP 2007-2013
Source: Own elaboration.

Figure A2.
Regional variation of expenditures pc. ERDF+CF in OP 2007-2013
Source: Own elaboration.
Notes
Additional information
JEL classification: R10; R11; R58.
Corresponding author: rmoreno@ub.edu
Acknowledgement: This research has been done under the funding of the Project “Perception and Evaluation of Regional and Cohesion policies by Europeans and Identification with the Values of Europe (PERCEIVE)”. European Commission, EU H2020. Socio-economic Sciences and the Humanities. REFLECTIVE-3-2015-693529. References