Articles
Determination of the urban wage premium in Ecuador
Determinación de la prima salarial urbana en Ecuador
Determination of the urban wage premium in Ecuador
Investigaciones Regionales - Journal of Regional Research, no. 47, pp. 57-77, 2020
Asociación Española de Ciencia Regional

This work is licensed under Creative Commons Attribution-NonCommercial 4.0 International.
Received: 14 December 2018
Accepted: 13 May 2020
Abstract: This paper, in closing the knowledge gap for developing countries, aims to estimate the urban wage premium (UWP) in Ecuador for different types of workers by using instrumental variables to address the endogeneity issue. The results show that for formal workers, the wage elasticity is 0.05/0.12 with respect to cantonal population/population density, and 0.049/0.088 with respect to the number of firms/firm density. These estimates are higher than those for informal and self-employed workers. Workers located in metropolis and big cities earn wages 9.6% and 7% higher than those workers located in small towns, respectively. Some cities stand as exceptions because they offer low UWP although they have large populations. This discrepancy could be related to poverty and the disorganized urban growth that cities in developing countries face.
Keywords: urban wage premium, city size, wage, Latin America.
Resumen: Este estudio, cerrando la brecha de conocimiento para países en vías de desarrollo, busca estimar la prima salarial urban en Ecuador para diferentes tipos de trabajadores, usando variables instrumentales para tratar el problema de endogeneidad. Los resultados muestran que para los trabajadores formales, la elasticidad del salario es 0.05/0.12 con respecto a la población cantonal/densidad poblacional, y 0.049/0.088 con respecto al número de empresas/densidad de empresas. Estas estimaciones son más altas que las de trabajadores informales y trabajadores por cuenta propia. Los trabajadores localizados en las ciudades metropolitanas y ciudades grandes ganan salarios 9.6% y 7% más altos que los trabajadores localizados en ciudades pequeñas, respectivamente. Algunas ciudades se destacan como excepciones porque estas ofrecen bajas primas salariales urbanas a pesar de tener grandes poblaciones. Esta discrepancia puede estar relacionada a la pobreza y el crecimiento urbano desorganizado que las ciudades de los países en vías de desarrollo enfrentan.
Palabras clave: prima salarial urbana, tamaño de ciudades, salarios, América Latina.
1. Introduction
At the global level, cities account for 49% of the total population and contribute 80% to the global GDP. Considering the 600 largest cities, which generate 60% of the global GDP, 23 are megacities (16 of which are in developing countries) and 577 are middleweight cities (407 of which are in developing regions) (McKinsey Global Institute, 2011b). The urban population is, then, gaining relevance in developing economies, which is a factor that can promote the so-called urban wage premium (UWP), a benefit of agglomeration economies. Nevertheless, a great number of studies on the impacts of urbanization focuses mainly on developed economies, assuming that models work for every economy and neglecting the fact that specific characteristics of developing economies are important in explaining this phenomenon. These countries have specific urban characteristics that may play as upward and downward factors on the UWP, including rapid growth of cities, growing working-age population, poverty, and informal urbanization. Therefore, more studies about urbanization in developing countries are needed to close the knowledge gap between developed and developing countries (Glaeser & Henderson, 2017). Along these lines, the aim of this paper is to measure the magnitude of the urban wage premium by focusing on the case of Ecuador, a Latin American country. The contribution of this paper is threefold. First, the differentiated effect of agglomeration economies on nominal wages and on real wages considering specific deflators by cities is estimated. Second, to determine the urban wage premium, three approaches are employed, namely: i. classification of cities by size, ii. population and population density, and iii. number of firms and firm density. The latter measure is used for the first time to approximate the concentration of the economic activity. And third, it also considers the differentiated effect of the UWP for different types of workers: salaried workers, informal workers, and self-employed workers. The results show that individuals living in cities classified as metropolis and big cities have higher wages than those located in small cities by 9.8% and 7.3% respectively. More specifically, workers located in cantons as Quito, Guayaquil, and Cuenca receive higher hourly wages compared to those individuals located in small cities by 17%, 3.5%, and 12% respectively. Guayaquil offers a lower urban wage premium despite being the most populated city in Ecuador. In this respect, the main finding is that in developing countries, increasing population does not always translate into a higher urban wage premium. This could be related to the disorganized urban growth that comes with issues such as high rates of crime and poverty. In cities such as Quito, Guayaquil, and Machala, inflation reduces the UWP whereas in cities such as Cuenca, Santo Domingo, and Manta, inflation does not hamper the benefits of agglomeration economies. The estimations of wage elasticity with respect to population/firm density for different types of workers indicate higher magnitudes for formal workers (0.11/0.07) than for informal and self-employed workers (0.06/0.048 and 0.06/0.056 respectively). This result confirms the complementarity between city size and skills.
The case of Latin America is especially interesting because it is the most urbanized developing region with an 80% urbanization rate (McKinsey Global Institute, 2011a) and the level of urbanization significantly varies across regions within countries (Ortiz, 2018). According to the United Nations’ statistics1, Ecuador registered an urbanization rate of 33.9% in 1960 and 63.8% in 2018, which corresponds to an average annual urbanization growth rate of 2.3%. This is the highest growth rate in Latin American, which records an average of 1.3%. The fact that Ecuador has the highest growth rate in Latin America makes it a suitable case study. With respect to the working-age population, Latin America recorded an inter-annual growth rate of 2.2% (for Africa it is 2.6%) between 1950 (64 million inhabitants) and 2015 (277.2 million inhabitants). Ecuador recorded an annual growth rate of 2.5% within the working-age population. Among Latin American countries, Ecuador is an average country in terms of poverty (ECLAC, 2019). In 2017, it recorded a poverty rate of 24%. Brazil, Chile, Costa Rica, Panama, Peru, and Uruguay recorded rates of poverty below 20% and Dominican Republic, Bolivia, Colombia, El Salvador, Honduras, and Mexico record higher levels of poverty – all above 30%. In addition, the labor market in Ecuador is characterized by informality and spatial inequality. In 2018, the occupied population in urban areas with decent work2 was 30%, while in rural areas only 15% of the occupied population had decent work. In terms of production, the two largest cities in Ecuador produce 43.2% of the national gross value added (MIDUVI, 2015). The primacy of these cities might be explained by the existence of the UWP.
Exceptional studies on developing countries show that the effect of agglomeration economies is generally higher in developing economies compared to developed ones. Chauvin et al. (2017) demonstrate that the elasticities of wages with respect to area density in developing countries such as China (0.19) and India (0.076) are higher than in the United States (0.046). The different effects of agglomeration are confirmed in meta-analysis studies and literature reviews about agglomeration economies (Melo et al., 2009 & Combes et al., 2011). Other separate studies also show higher magnitudes of the UWP in developing countries: between 0.04 and 0.054 for Colombia (García, 2019; Duranton, 2016); 0.10 (with respect to employment density) for China (Combes et al., 2013); 0.07 (population on firm TFP) for Chile (Saito & Gopinath, 2009); 0.042 (population on productivity) for Mexico (Ahrend, et al.,2014); and between 0.03 (market size on wages) and 0.05 (density of firms on manufacturing productivity) for Ecuador (Alvarado & Atienza, 2014, Matano et al., 2020; Guevara-Rosero et al., 2018). The magnitudes of the estimated UWP for advanced economies are lower: between 0.034 and 0.04 for the United States (Glaeser & Resseger, 2010; Krashinsky, 2011), 0.01 for Italy (Di Addario & Patacchini, 2008), 0.03 for France (Combes et al., 2010), and 0.025 for Spain (De la Roca & Puga, 2016). When European countries are analyzed together, there are no significant differences among them (Ciccone, 2002). These results show that, in fact, the mechanisms that work behind the urban wage premium are different across countries. In developing countries, the working-age population, which tends to be located in urban centers, is larger and grows more rapidly. This could positively influence the UWP. However, when the population growth is accompanied by poverty and informality, any or even negative wage premia might take place in developing countries. In fact, for Ecuador, Matano et al. (2020) show that workers employed in the informal sector in urban agglomerations have lower wages than formal sector workers and that no wage premia exist for informal workers in specialized areas. For Peru, Bernedo and Patrick (2017) show that the increase of formal and informal establishments in the same industry has a negative effect on productivity. In Kenya, the informality of firms causes agglomeration diseconomies in firm clusters (Harris, 2014). In the case of workers employed in the informal sector, geographical proximity does not suffice to generate interactions to benefit from learning (Claver-Cortés et. al., 2017). Income inequality, which is associated with limited access to education, may halt the benefits of the opportunities for learning and experiences in urban areas, which could have a reducing effect on the UWP. Another aspect that characterized developing countries is that the urban sprawl is disorganized. The cities expand horizontally, and informal settlements spring up in peripheries. In Ecuador, a large part of the population (2.8 million out of 14 million) lives on land illegally, without property titles and in precarious conditions (MIDUVI, 2015). This informal urbanization process might be a deterrent to benefit from the urban wage premium.
The present study examines the UWP using four approaches: i. the area where the individual is located, ii. the classification by size of the city, iii. the wage elasticity with respect to the cantonal population and population density, and iv. the wage elasticity with respect to the number of firms and firm density at the cantonal level. This last approach, which is employed for the first time for empirical evidence, is pertinent since firms have direct influence on wages. Real and nominal wages are used to capture the influence that prices can have on the UWP. Pooled data from 2010 to 2018 is used for the nominal wage and data from 2015 to 2018 is used for the real wage. The UWP is estimated using two methods: the Ordinary Least Squares method (OLS) for the approach using the classification of cities and instrumental variable regressions for the approaches using the cantonal population/population density and the number of firms/firm density to control the endogeneity issue that arises from the circular causation between the wage and these variables. The valid instruments are government transfers to Decentralized Autonomous Governments (GADs, for its acronym in Spanish) by law and other transfers, municipal taxes to motor vehicles, taxes on used car purchases, inheritance taxes, and firm revenue taxes. In all estimations, the selection bias is tested and corrected following Heckman (1979).
The rest of this study is organized as follows: Section 2 shows the data and methodology; Section 3 presents the results; and finally, Section 4 lists the conclusions.
2. Data and methodology
2.1. Data
The National Survey of Employment, Unemployment, and Underemployment (ENEMDU) in the editions from 2010 to 2018 (fourth quarters) is used to analyze the urban wage premium in Ecuador. A broad definition of labor income that includes salaried workers, the self-employed3, and workers in the informal sector, between 15 and 64 years old, is considered. The economically inactive population, the unemployed, and non-remunerated workers are excluded. In addition, as the wages of the public sector are determined by centralized laws and do not respond to market fluctuations, public workers are not considered. Thus, the 2010-2018 sample using the nominal wage includes 243,100 individuals and the 2015-2018 sample using the real wage includes 120,591 individuals. The spatial unit of analysis is the canton, defined by administrative boundaries. Although the use of cantons does not fully consider the economic interactions in defined zones (Obaco et al., 2020), cantons are used as spatial units because concentrations of population exist within them. In fact, the decomposed Theil index indicates that the concentration of the population within cantons explains 5% of the national concentration of population.
Moreover, cantons are used due to the fact that the information on prices is available for those units, which leads to a coherent dataset. Following the suggestion of Combes et al. (2011), measures of density are used since they are more robust to arbitrary boundaries. Although the number of cantons varies across years, there are 218 cantons represented in the whole sample. Only cantons from Galapagos are not represented.
Population projections at the cantonal level for the period 2010-2018, based on the Population and Dwelling Census of 2010, are also used. The number of firms is obtained from the Directory of Companies and Establishments4 published by the National Institute of Statistics and Census of Ecuador (INEC, acronym in Spanish). For the real wage analysis, the consumer price index of nine cities and natural regions from 2015 to 2018 are obtained from the INEC. The instrumental variables of government transfers to Decentralized Autonomous Governments are obtained from the Ministry of Economy and Finances (MEF, acronym in Spanish) and the instruments regarding taxes are obtained from the tax collection by the Internal Revenue Service (SRI, acronym in Spanish).
2.2. Description of variables
2.2.1. Dependent Variable
Generally, empirical studies attempting to measure the urban wage premium use the level of wages as a dependent variable. Other approaches accounting for more information use the annual growth rate of wages or the wage growth between workplaces (D'Costa & Overman, 2014; Yankow, 2006).
In this study, two perspectives are considered to analyze the urban wage premium: the hourly nominal wage and the hourly real wage. First, the nominal wage is used since in a labor market with rigidities, workers focus mainly on the nominal wage (Keynesian perspective) to make decisions about their location. Technically, the hourly wage is obtained from the monthly gross income received from working in primary and secondary occupations (including social security benefits) divided by the number of labored hours per month. The second perspective is the analysis of the UWP using the real wage, which is calculated as the nominal wage divided by the consumer price index (CPI) and deflated at the year 20155. Places with high inflation of goods, services, and estates will be less attractive to workers. It is worth mentioning that nominal wages somehow include these aspects as firms offer nominal wages according to cities’ living standards. Instead of using a national CPI to calculate the real wage, specific consumer price indexes for cities and natural regions, available from 2015 to 2018, are used. Only nine cities have information about the CPI. They are Ambato, Cuenca, Esmeraldas, Guayaquil, Loja, Machala, Manta, Quito, and Santo Domingo de los Colorados. For cities other than these nine, the CPI at the regional level is used. In such a way, wages are time deflated by exploiting, for the first time, information on CPI by cities that measures temporal changes in each city. To determine the differences across cities, average levels of prices should be used. However, such information is generally not available. According to the inflation statistics (see Table 1), the highest average inflation rate registered in Quito from 2015 to 2018 is 1.019 and the lowest average inflation rate registered in Santo Domingo in the same time period is 1.004. Once the effect of price variation is eliminated, real wages are lower than nominal wages. For instance, the difference between real and nominal wages in Quito and Ambato, cities with high rates of inflation, is around US$0.09 per hour. In Santo Domingo, a city with a low rate of inflation, the difference is only US$0.02 per hour.

Source: Own elaboration.
By looking at the hourly nominal wage statistics in Table 2, workers located in urban areas receive a labor income 33% greater than that of those located in rural areas in 2018. Individuals located in metropolis receive 30% higher average wages as compared to individuals in small cities. Regarding wage discrimination, women and ethnic minorities (except for white people) receive lower wages. As expected, workers with more human capital earn 61% more income than workers with less education. Likewise, workers in the formal sector earn 47% higher wages than workers in the informal sector. Larger differences are observed across occupation groups. Managerial workers have 75% and 87% higher wages than technical occupations and agriculture, forestry, and fishery occupations, respectively. These discrepancies could be due to differences in levels of education. With respect to economic sectors, workers in mining and quarrying activities earn more than in other sectors.
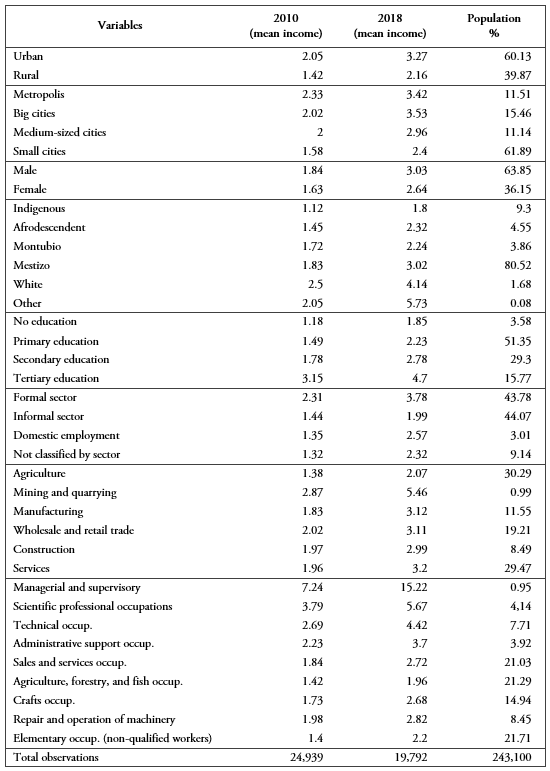
Source: ENEMDU 2010, 2018. Own elaboration.
2.2.2. Independent Variables
To determine the UWP, three approaches of the level of urbanization are used, namely: i. classification of cities by size, ii. population and population density, and iii. number of firms and firm density. The latter has not been used before in empirical literature despite the fact that firms generally concentrate in big cities in search of high productive workers, who, in exchange, are paid high wages. This clearly reflects the influence of firms in the UWP (Glaeser & Maré, 2001; Puga, 2010). Regarding the classification of cities by size, four categories are determined according to the Ministry of Urban Development and Dwelling (MIDUVI, 2015) (see Appendix A).
Given that a developing country is concerned, the level of informality of workers is considered. For this study, the informal sector is defined as the establishments with fewer than ten workers and which do not have accounting records or do not have a unique taxpayer number, which is a RUC (in Spanish, Registro Único de Contribuyente). The scant empirical evidence on developing countries shows mixed results about the expected effect of agglomeration economies on informal workers (García, 2019; Duranton, 2016; Bernedo & Patrick, 2017).
Following the standard approach of the wage equation (Mincer, 1974), variables related to the human capital acquired from formal education and in the workplace are included. Based on the vast empirical evidence about wage differences between men and women (Altonji & Blank, 1999; Bacolod & Blum, 2010), gender is included as a dichotomous variable that takes the value of one if the worker is male. Following the literature about wage discrimination (Cain, 1986), a categorical variable of ethnicity with Mestizo as the reference category is included. As the heterogeneity of wages across individuals might also be explained by the differences in job characteristics, job categories6 and economic activity7 are taken into account.
2.3. Methodology
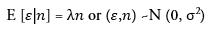
Using a pool of data from 2010 to 2018 for the nominal wage and from 2015 to 2018 for the real wage, the UWP is estimated. Although empirical studies on urban wage payment commonly use the panel data methodology to address the estimation bias that emerges from non-zero correlations between density and city and worker effects (Combes et al., 2011), the individuals8 surveyed in each quarter of the ENEMDU survey are not the same. Therefore, it is not possible to construct a panel data in our case. In spite of that, to partly solve the unobserved heterogeneity issue, important variables that capture worker and natural regional characteristics are included. Additionally, due to the fact that only individuals who receive income from employment are considered, an auto-selected sample is generated, which may lead to biased coefficients when using OLS (Freije et al., 2004). To deal with this issue, a bias sample selection correction is carried out following Heckman (1979). It consists of the inclusion of Mill’s inverse reason obtained from the estimation of the probability of participation in the labor market in the wage equation estimations (for more details, see Appendix B). The estimation results (Tables 4 and 5) show that this term turned out to be statistically significant; therefore, it should remain in the wage models to solve the selection bias problem.
Four approaches are applied as presented in the following model specifications.
Equation (1) is used to estimate the UWP considering the classification of cities by size.
 [1]
[1]where is the hourly wage of worker i in the logarithm; is the type of city by size (metropolis, big cities, medium cities, and small cities) where worker i lives; is the constant term; contains the individual, academic, and labor characteristics of worker i; are the natural region effects; and is the error term. This equation is estimated using the Ordinary Least Squares method and clustered robust errors by canton.
The equation (2)/(3) is used to estimate the UWP on wages considering the cantonal population density/firm density.
 [2]
[2]
 [3]
[3]Where is the population/number of firms in logarithm of the canton where worker is located and is the coefficient reflecting the elasticity of wages with respect to the population density/firm density. For comparison with the existing literature, the population and number of firms are also analyzed. The instrumental variable method is employed to address two matters: 1) the endogeneity issue that may appear for two reasons: circular causation between wages and the proxy variable of the urban premium, and 2) the omission of variables affecting the dependent and independent variables. Table 3 indicates that the suspected variables: population density, firm density, population, and number of firms, are endogenous. The instruments employed are both relevant, i.e. correlated with the endogenous variable , and valid, i.e. uncorrelated with the error term. The valid instruments are the government transfers to Decentralized Autonomous Governments by law, other transfers, municipal taxes to motor vehicles, firms’ revenue taxes, taxes for used car purchases, and inheritance taxes. These instruments are theoretically justified since they are correlated with suspected endogenous variables and do not affect the dependent variable of wages. For instance, government transfers to a given municipality, devoted to improving it, are very likely to influence the population distribution of such a municipality. However, government transfers do not have a direct effect on wages of workers, which is the dependent variable. Taxes from firms’ revenues are clearly correlated with the number of firms. In relation to wages, one could reasonably think that taxes that firms pay would affect salaries. However, once those taxes are collected from firms by the municipal government, they are not supposed to affect workers’ wages. Taxes on used car purchases are also related to both the number of inhabitants and the number of firms. A high level of car purchases implies more demand from people. Taxes on motor vehicles are related to the number of inhabitants in each municipality as vehicle congestion is related to the level of population. Both taxes on motor vehicles and on the purchase of cars, once collected by municipal governments, do not affect the level of wages. Finally, inheritance taxes are correlated with the population mass as the probability of death is higher in large populations. They clearly do not affect the level of wages, either.
To verify their econometric validity, the condition of relevance is tested through the correlations. Table 4 shows that, indeed, the instruments are relevant since the correlations between them and the endogenous variables are significant. According to the Cragg-Donald Wald weak identification statistic, which is shown at the bottom of Table 6, we reject the null hypothesis that the used instruments are weak at 10% (statistic higher than the critical value 19.93). They are also exogenous as shown by the Sargan test, also presented at the bottom of Table 6. It is worth noting that the instruments differ from one model to another as the dependent variables and the sub samples are not the same.

Source: Own elaboration.

Source: Own elaboration. Note: Significance is represented by: ***p<0.01, **p<0.05, *p<0.1.
3. Results
OLS estimation results with classification of cities are presented in Table 5. In columns 1 and 3, the aggregated classification of cities is presented. In columns 2 and 4, a disaggregated classification by main cities is shown. Nominal and real hourly wages are employed as dependent variables, using the same sample from 2015 to 2018. This analysis regarding the difference between real and nominal wages is conducted only for the city size approach as deflators are specific for cities. The instrumental variable estimations using the population and firms are presented in Table 6.
Regardless of the employed measure, the results verify the existence of the urban wage premium in Ecuador. Workers employed in metropolis earn 9.8%9 more than workers employed in small cities. This wage differential decreases to 7% between workers in big cities and workers in small cities. In the case of medium-sized cities, the coefficient is statistically not significant. This fact denotes that workers might be indifferent between living in small towns and medium-sized ones. For workers to benefit from a wage premium, they must move to large cities with a population higher than 234,000 inhabitants.

The clustered standard errors by canton are in parentheses and the significance is represented by: ***p<0.01, **p<0.05, *p<0.1. Worker characteristics such as experience, experience2, schooling years, and a dummy for men are included but not presented here due to space limitations.
More specifically, workers located in the cities of Quito, Guayaquil, and Cuenca earn 17%, 3.6%, and 12% more than workers located in small cities, respectively. An average worker located in a small city with a predicted nominal hourly wage of US$2.3 can receive US$0.39 more per hour if he/she works in Quito, US$0.08 more per hour if he/she moves to Guayaquil, and US$0.27 more per hour if he/she moves to Cuenca. Although the most populated city in Ecuador is Guayaquil, this city does not generate the highest urban wage premium. This indicates that negative effects might take place within this city that could be related to the disorganized urban growth that involves slums, crime, and insecurity. Likewise, a negative and non-significant effect is produced on wages in Portoviejo, either nominal or real. Despite being a big city, assumed to lead a UWP, this city has a high level of poverty of 65% that might hamper the positive effect of the growing population. In this sense, the size of the city does not matter for better wages if the socio-economic conditions are not adequate. Conversely, the urbanization rate can reduce the poverty (Jiménez & Alvarado, 2018). Thus, poverty is one of the specific characteristics of developing countries that can negatively influence the UWP. In fact, in Ecuador, 75 cantons out of a total of 221 are in a poverty trap according to Correa-Quezada et al. (2018). Regarding the rest of cities that are presented in descending order by population, the UWP is lower in cities with less population.
As expected, inflation reduces the effect of the urban wage premium in a few cities, such as Quito, Guayaquil, and Machala. For instance, in Machala, instead of earning US$0.11 per hour, workers earn US$0.10 per hour in real terms. This translates to US$1.6 per month. In other cities, such as Cuenca, Santo Domingo, and Manta, the effect of the urban wage premium is larger for real wages than for nominal wages. In these cities, inflation does not hamper the benefits of agglomeration economies. Overall, the small difference between real and nominal wages might indicate that inflation does not act as a strong ejection factor in big cities.
Table 6 presents the instrumental variable estimations with population in column (1), population density in column (2), the number of firms in column (3), and firm density in column (4), for different samples: full sample including formal, informal, and self-employed workers; only salaried workers; only informal workers; and only self-employed workers. The results for control variables are presented in Appendix C.
For the whole sample, the estimation of the nominal wage elasticity10 with respect to cantonal population is 0.0458 and with respect to the number of firms is 0.0436. In average terms, an increase of 1% in cantonal population (number of firms) of 8,190 inhabitants (441 firms) leads to an increase in the nominal monthly wage11 of an average worker (who earns US$333.5) of US$15, approximately. The similar magnitudes obtained from the population and the number of firms corroborates that the latter is valid. Firms compete for workers through wages, affecting the urban premium more directly than the population. These estimates are higher compared to 0.039, obtained by Matano et al. (2020), who use the same sample for Ecuador. The difference could be due to the fact that they use Functional Urban Areas (FUA) meanwhile in this study, cantons are used. As for density measures, stronger agglomeration effects are obtained. The wage elasticity with respect to population density/firm density is 0.105/0.0775.
Given that not all workers are affected by agglomeration economies to the same extent, different groups of workers are analyzed, namely salaried workers, informal workers, and self-employed workers. Regarding salaried workers, the wage elasticity with respect to population/number of firms is 0.053/0.049 and with respect to population density/firm density is 0.121/0.088. By comparing with other studies for developing countries that also focus on salaried workers, these results are in line with Duranton (2016) and García (2019), who obtained estimates of 0.05 and 0.04, respectively, for Colombia; and Combes et al. (2013) and Chauvin et al. (2017), who also obtained a higher effect when using employment density with 0.10 and 0.19, respectively, for China. Other studies that focus on agglomeration effects on productivity present estimates of 0.07 for Chile (Saito & Gopinath, 2009); 0.042 for Mexico (Ahrend, et al., 2014); and 0.05 for Ecuador (Guevara-Rosero et al., 2018). For developed countries, estimates of wage elasticities with respect to population range from 0.01 to 0.04 (De la Roca & Puga, 2016; Combes et al., 2010; Glaeser & Resseger, 2010; Krashinsky, 2011; Di Addario & Patacchini, 2008; Ciccone, 2002). A superficial comparison indicates that developing countries have higher urban wage premia than developed ones. However, more evidence for developing countries is needed to confirm this statement.

The canton clustered standard errors are in parentheses and the significance is represented by: ***p<0.01, **p<0.05, *p<0.1. Worker characteristics such as experience, experience2, schooling years, and a dummy for men are included in all samples but not presented here due to space limitations.
Regarding the effect of agglomeration on informal workers, it is lower (0.0248) than that obtained by formal workers (0.053). This verifies the complementarity between city size and skills (Glaeser & Resseger, 2010). Informal workers, who generally attain low levels of education (38% of them complete primary education, 13.6% complete secondary education, and only 1.36% have tertiary education) do not take full advantage of learning potential and knowledge externalities in denser areas. Likewise, formal workers benefit more from the population and firm density (0.12/0.088) than informal workers (0.058, 0.053). Formal workers, who are more educated (11.3% have attained tertiary education), go to denser areas to benefit from knowledge accumulation (Puga, 2010). This result is in line with Matano et al., (2020) who obtained lower benefits of agglomeration externalities for informal workers than for formal ones in Ecuador. Weak agglomeration effects are also observed for self-employed workers. The wage elasticity with respect to population and firm density is 0.07 and 0.0578. This could also be related to the level of education of entrepreneurs. Most of the them have attained only primary education (33%) or secondary education (17%), and only 4% have tertiary education.
4. Conclusions
According to the estimation results, the existence of an urban wage premium is verified using both nominal and real wages. The UWP increases with the city size. Individuals located in metropolis and big cities earn 9.6% and 7% more than those located in small cities, respectively. Interestingly, Guayaquil does not offer the highest wage premium despite being the most populated city. In the particular case of Portoviejo, the urban wage premium is negative and non-significant. In these cities, there are serious issues of crime, insecurity, poverty, slums, and informality which might be deterrent factors to benefit from the UWP. These can be the sources of differences between developed and developing countries that justify the carrying out of rigorous studies of the latter.
The elasticities of wages with respect to population density/cantonal population and firm density/number of firms are estimated at 0.105/0.0458 and 0.0775/0.0436, respectively. Interestingly, the benefits of agglomeration are different across types of workers with a higher effect for formal workers than informal and self-employed workers. This corroborates the complementarity between city size and skills.
As a policy recommendation, it is important to pay more attention to small cities to reduce the wage gaps with respect to bigger cities. To do so, policies that encourage greater investment, attract firms, and create employment in these areas are needed. The creation of technical and superior educational institutions in small cities would also encourage young people to remain in their localities without having to migrate to big cities. The development of certain productive sectors located in cities that are lagging behind must be boosted so that individuals can start businesses and generate employment opportunities in those cities. Furthermore, keeping in mind that the urban population is growing accompanied by a demographic dividend, it is important to give adequate conditions to the working-age population and urgently solve the poverty, crime, insecurity, and informality issues in cities of developing countries. Thus, the labor supply can be of high quality and the urban wage premium can be reinforced. Otherwise, the positive effect of the growing population might fade or even be harmful.
For further research on the urban wage premium in cities of developing countries, it is important to extend the analysis by taking into consideration the role of city amenities and social issues such as crime, poverty, and informality.
References
Ahrend, R., Farchy, E., Kaplanis, I., & Lembcke, A. (2014). What Makes Cities More. Productive? Evidence on the Role of Urban Governance from Five OECD Countries. OCDE Regional Development Working Papers 2014/05. https://doi.org/10.1787/2ce4b893-en
Altonji, J., & Blank, R. (1999). Race and Gender in the Labor Market. In O. Ashenfelter & D. Card (Eds.), Handbook of Labor Economics (Vol 3C, pp. 3143-325). Elsevier Science. https://doi.org/10.1016/S1573-4463(99)30039-0
Alvarado, R., & Atienza, M. (2014). The role of market access and human capital in regional wage disparities: Empirical evidence for Ecuador. Serie de Documentos de Trabajo en Economía – UCN, WP2014-04.
Bacolod, M. P., & Blum, B. (2010). Two Sides of the Same Coin: U.S. "Residual" Inequality and the Gender Gap. The Journal of Human Resources, 45 (1), 197-242. https://doi.org/10.3368/jhr.45.1.197
Becker, G. S. (1962). Investment in human capital: A theoretical analysis. Journal of Political Economy, 70(5), 9-49. www.jstor.org/stable/1829103
Bernedo, M., & Patrick, C. (2017). Agglomeration and informality: Evidence from Peruvian firms. Andrew Young School of Policy Studies, Research paper series, working paper 17-13. https://dx.doi.org/10.2139/ssrn.3051839
Cain, G. G. (1986). The Economic Analysis of Labor Market Discrimination: A Survey. In O. Ashenfelter & R. Layard (Eds.), Handbook of Labor Economics, (pp. 693-785). Elsevier Science.
Chauvin, J.P., Glaeser, E. Ma, Y., & Tobio, K. (2017). What is different about urbanization in rich and poor countries? Cities in Brazil, China, India and the United States. Journal of Urban Economics. 98, 17-49. https://doi.org/10.1016/j.jue.2016.05.003
Ciccone, A. (2002). Agglomeration effects in Europe. European Economic Review, 46(2), 213-227. https://doi.org/10.1016/S0014-2921(00)00099-4
Claver-Cortés, E., Marco-Lajara, B., Manresa-Marhuenda, E., García-Lillo, F., & Seva-Larrosa, P. (2017). Location decisions and agglomeration economies: Domestic and foreign companies. Investigaciones Regionales-Journal of Regional Research, 39, 99-135
Combes, P.P., Duranton, G., Gobillon, L., & Roux, S. (2010). Estimating Agglomeration Economies with History, Geology, and Worker Effects. In E. Glaeser (Ed.), Agglomeration Economics. University of Chicago Press.
Combes, P., Duranton, G., & Gobillon, L. (2011). The Identification of Agglomeration Economies. Journal of Economic Geography, 11(2), 253–266. https://doi.org/10.1093/jeg/lbq038
Combes, P-P, Demurger, S., & Li, S. (2013). Urbanisation and Migration Externalities in China. CEPR Discussion Paper 9352.
Correa-Quezada, R., García-Vélez, D., De la Cruz, M., & Álvarez-García, J. (2018). Poverty Traps in the Municipalities of Ecuador: Empirical Evidence. Sustainability, 10 (11), 4316. https://doi.org/10.3390/su10114316
Cruz, B. D. O., & Naticchioni, P. (2012). Falling urban wage premium and inequality trends: evidence for Brazil. Investigaciones Regionales-Journal of Regional Research, 24, 91–113.
D’Costa, S., & Overman, H. G. (2014). The urban wage growth premium: Sorting or learning?. Regional Science and Urban Economics, 48, 168-179. https://doi.org/10.1016/j.regsciurbeco.2014.06.006
De La Roca, J., & Puga, D. (2016). Learning by Working in Big Cities. Review of Economic Studies, 84, 106–142. https://doi.org/10.1093/restud/rdw031
Di Addario, S., & Patacchini, E. (2008). Wages and the City. Evidence from Italy. Labour Economics, 15, 1040–1061. https://doi.org/10.1016/j.labeco.2007.09.003
Duranton, G. (2016). Agglomeration effects in Colombia. Journal of Regional Science, 56(2), 210–238. https://doi.org/10.1111/jors.12239
Economic Commission for Latin America and the Caribbean (ECLAC) (2019). Social Panorama of Latin America, (LC/PUB.2019/22-P/Rev.1), Santiago.
Freije, S., López-calva, L. F., & Rodríguez, C. (2004). Origen de los cambios en la desigualdad salarial urbana, nacional y regional, en México. Secretaría de Desarrollo Social, 10, 1–52.
García, G. (2019). Agglomeration Economies in the Presence of an Informal Sector: the Colombian Case. Revue d'Économie Régionale et Urbaine, février(.), 355-388. https://doi.org/10.3917/reru.192.0355
Glaeser, E. L., & Maré, D. C. (2001). Cities and Skills. Journal of Labor Economics, 19(2), 316–342. http://dx.doi.org/10.1086/319563
Glaeser, E. L. (2010). Introduction. In E. Glaeser (Ed.), Agglomeration Economics (pp. 1–14). University of Chicago Press.
Glaeser, E. L., & Resseger, M. (2010). The complementarity between cities and skills. Journal of Regional Science, 50(1), 221–244. https://doi.org/10.1086/319563
Glaeser, E., & Henderson, J. V. (2017). Urban economics for the developing world: An introduction. Journal of Urban Economics, 98, 1-5. https://doi.org/10.1016/j.jue.2017.01.003
Guevara-Rosero, G. C., Riou, S., & Autant-Bernard, C. (2018). Agglomeration externalities in Ecuador: do urbanization and tertiarization matter?. Regional Studies, 53 (5), 706-719. https://doi.org/10.1080/00343404.2018.1470325
Harris, J. (2014). The messy reality of agglomeration economies in urban informality: Evidence from Nairobi's handicraft industry. World Development, 61, 102–113. https://doi.org/10.1016/j.worlddev.2014.04.001
Heckman, J. (1979). Sample Selection Bias as a Specification Error. Journal of the Econometric Society, 47(1), 153–161. https://doi.org/10.2307/1912352
Jones P., D’Aoust O., Bernard L. (2017). The Urban Wage Premium in Africa. In S. Johnson-Lans (Eds.), Wage Inequality in Africa. Global Perspectives on Wealth and Distribution (pp. 33-53). Palgrave Macmillan. https://doi.org/10.1007/978-3-319-51565-6
Jiménez, J., & Alvarado, R. (2018). Effect of labor productivity and human capital on regional poverty in Ecuador. Investigaciones Regionales-Journal of Regional Research, 40, 141-165.
Krashinsky, H. (2011). Urban agglomeration, wages and selection: Evidence from samples of siblings. Labour Economics, 18(1), 79–92.
Llungo-Ortiz, J. (2018). Inequalities and Regional Policies in Latin America: A review. Investigaciones Regionales-Journal of Regional Research, 41, 11-51.
Melo, P., Graham, D., & Noland, R. (2009). A meta-analysis of estimates of urban agglomeration economies. Regional Science and Urban Economics, 39, 332-342. https://doi.org/10.1016/j.regsciurbeco.2008.12.002
Matano, A., Obaco, M., & Royuela, V. (2020). What drives the spatial wage premium for formal and informal workers? The case of Ecuador. Journal of Regional Science. Accepted Author Manuscript. https://doi.org/10.1111/jors.12486
McKinsey Global Institute. (2011a). Building globally competitive cities: The key to Latin American growth. McKinsey.
McKinsey Global Institute. (2011b). Urban World: Mapping the economic power of cities. McKinsey.
MIDUVI. (2015). National report of Ecuador, Habitat III United Nations Conference about household and sustainble urban development. Quito: Ministerio de Desarrollo Urbano y Vivienda (MIDUVI).
Mincer, J. (1974). Schooling, Experience and Earnings. Columbia University Press.
Obaco, M., Royuela, V., & Vítores, X. (2020). Identifying Functional Urban Areas in Ecuador Using a Varying Travel Time Approach. Geographical Analysis, 52, 107-124. https://doi.org/10.1111/gean.12190
Puga, D. (2010). The magnitude and causes of agglomeration economies. Journal of Regional Science, 50(1), 203–219. https://doi.org/10.1111/j.1467-9787.2009.00657.x
Saito, H., & Gopinath, M. (2009). Plants' self-selection, agglomeration economies and regional productivity in Chile. Journal of Economic Geography, 9 (4), 539-558. https://doi.org/10.1093/jeg/lbp010
Schultz, T. W. (1961). Investment in Human Capital. The American Economic Review, 51(1), 1–17. https://www.jstor.org/stable/1818907
Yankow, J. J. (2006). Why do cities pay more ? An empirical examination of some competing theories of the urban wage premium. Journal of Urban Economics, 60, 139–161. https://doi.org/10.1016/j.jue.2006.03.004
Appendix A: Classification of cities by size

Appendix B: Selection model
In equation (1), all the individuals in working age are taken into account i.e. a total of 362,139 individuals.
 [A.2.1]
where is a binary variable that takes the value of 1 if the individual is employed and declares employment income and 0 if she/he does not participate in the labor market or does not declare a wage, is a set of variables that influence the participation of individuals in the labor and is the error term.
Subsequently, it is assumed that:
 [A.2.2]
Then, the wage equation conditioned to the participation in the labor market is obtained.
 [A.2.3]
where is the inverse Mill´s ratio to correct the auto-selection bias and is included in wage specifications.

The standard errors are in parentheses and the significance is represented by: ***p<0.01, **p<0.05, *p<0.10.
Appendix C: Estimation results for control variables

The clustered standard errors are in parentheses and the significance is represented by: ***p<0.01, **p<0.05, *p<0.1.
Notes
Additional information
JEL Classification: R12; J31; O54.
Corresponding author: carolina.guevara@epn.edu.ec