Artículos

This work is licensed under Creative Commons Attribution-NonCommercial 4.0 International.
Received: 15 May 2017
Accepted: 20 February 2018
Abstract:
The main purpose of this paper is to analyze the importance of social exclusion and its relationship to economic growth in the main Mexican regions. The principal components technique was used to build a multi-dimensional indicator based on the information provided by the Mexican Institute for Statistics and Geography (INEGI), by taking into account the main factors provoking such exclusion. An econometric inference on the regional growth was made using the spatial panel data to find the direct and indirect effects that it has on the social exclusion in the different regions of this country.
JEL Classification: I32; J74; R5.
Keywords: social exclusion, spatial econometrics, economic growth.
Resumen:
El principal propósito de este trabajo es analizar la importancia de la exclusión social y su relación con el crecimiento económico en las principales regiones mexicanas. Mediante la técnica de componentes principales, construimos un indicador multidimensional con la información proporcionada por el INEGI y tomando en cuenta los principales factores que la generan; con los datos de panel espacial hacemos inferencia econométrica sobre el crecimiento regional para encontrar los impactos directos e indirectos que tiene éste sobre la exclusión social en las distintas regiones del país.
Clasificación JEL: I32; J74; R5.
Palabras clave: exclusión social, econometría espacial, crecimiento económico.
1. Introduction
The free market model adopted in the Mexican economy since the mid-eighties and consolidated in 1995 is considered to be selective, since it is based mainly in the application of wage repression policies, privatization of state-owned companies favoring financial capital, mostly foreign, and handover of non-renewable natural resources to private capital.
According to Veltmeyer (2002), factors such as unsatisfactory wages and the increase of social inequalities due to the low income distribution are some of the constants of the free market system. This author considers that this model is oriented to benefit exclusively a small segment of owners and business agents that are capable of competing in the global market neglecting local producers and micro entrepreneurs; they are usually left out of the global competitive framework. In the case of the Mexican economy, the different regions of the country concentrate more of the latter: micro, small and medium enterprises instead of large companies (Andrés-Rosales, et al., 2017). Within this growth model, uncompetitive companies are excluded; this means that they are not considered among the priorities of public policies. The same happens with the labor force, where the most trained and prepared workers enter the dynamics of growth and find a place within competitive companies. In this growth model, lead by the market, people in extreme poverty and with less preparation for the labor market are the most excluded, hence, poverty is part of the first component of this exclusion, understanding as poverty, a state of deprivation, a product of precarious conditions of employment and informal occupations that prevail in the labor market of the different Mexican regions (Ziccardi, 2008).
«Poverty is a condition that undermines the dignity of humans, limits their fundamental freedoms, prevents their basic needs from being met and makes impossible for them to be included and integrated in the society. Poverty is a widespread and persistent structural phenomenon; this is why the research of its levels, trends and determinant factors is fundamental to propose social policy measures searching its eradication» (Aparicio, 2009: 19).
The causes of poverty are diverse, as are the causes of social exclusion, but the slow growth observed in the Mexican economy in the last decades tends to make it more serious. Hence, we set up as our principal hypothesis that the slow economic growth in some of the Mexican regions, combined with the concentration of economic activities and income, make some regions more likely to present a greater social exclusion than others. We also argue that the role of the government through its social programmes has not been enough to reduce such exclusion because it does not focus on people who are outside the system of growth and economic development.
In addition to the above, the main factors that generate poverty are the unemployment, low wages, and precariousness; these factors prevail in the labor market of the country (Ziccardi, 2008). Adopting this perspective, this author points out that the current wage deterioration accompanied by precariousness and informality in employment worsen the poverty situation, which has different consequences in the quality of life of the families an urban environment, such as the reduction of the capacity of acquisition of basic products and services for the families (food, education, health and culture). All this results in more insecurity due to the low income and unemployment, which generates a vicious circle of lower income, lower taxation and lower Government budget to invest in public services and social spending targeting public security, etc. The aforementioned factors, force the families to create different survival strategies, based on the incorporation of a greater number of family members to the labor market, reducing the years of study of young people (Ziccardi, 2008), causing a negative effect with lower preparation for their access to the labor market, having to accept even less wages insufficient enough to have access to the basic food basket, resulting in a greater social exclusion, product of the free market system itself, where the more competitive and productive workers are the ones who survive.
Given that the definition of social exclusion is broader than poverty, the lack of credibility with the poverty indicators generated by Mexican government institutions in recent years only adds to the problem. Institutions such as INEGI have undersized corresponding indicators, which tends to distort reality about the numbers of people in poverty in different regions of the country. Hence, it is necessary to use other indicators for its proper calculation as we do in this work.
The above problem is intended to be discussed and exposed in this work to show the importance of social exclusion, its evolution and the studies performed for the Mexican economy. Thus, we present first the theoretical discussion of social exclusion; later, we expose some of the factors that influence exclusion, followed by the spatial analysis of exclusion and economic growth. Finally, we present the conclusions for this work.
2. Theoretical approximation to the social exclusion debate
According to Sen (2000), the concept of social exclusion dates to 1974 in Europe. A Frenchman, René Lenoir, mentioned that the sector of the population that was marginalized and socially misfit should be included in the policies. This concept included elder people, drug addicts, delinquents, single mothers and all individuals that were not part of the structure and activities of the state (Bel, 2002). However, for Jiménez (2008) the concept dates to even older years, arguing that much of the theoretical contributions to that expression had already been developed by Marx, Engels, Durkheim, Tönnies, Bourdieu and Parkin, making special incidence in the dual alignment of the «social class» and the «inside-out» dynamics.
Authors like Munck (2005) consider that the concept «social exclusion» can be seen as a conservative concept of individual rights which derives in major social problems and crises such as teenage pregnancies or the involvement of children and young people in crime. Then, social exclusion can be seen as the denial of the classical notion of social democracy of the citizens of their civil, political and social rights. This author considers it as a multidimensional concept where several exclusion forms are combined, such as the lack of participation in political decisions and procedures, difficult access to remunerated employment, material resources and integration in the common cultural process. The concept of social exclusion was developed and accepted by several academics and politicians: the initally predominant French concept explicitly based on the sociological studies of Durkheim (1934) and with emphasis on moral integration was called «the social integration» by Ruth Levitas (2005), a model that is focused particularly on the exclusion of labor payment (ibid., 2005). In the same way as Munck (2005), Dell’ Anno and Amendola (2015) consider that the concept refers not only to the material, economic or lack of health, but further, to the lack of social relations and active participation in society.
In Mexico, authors like Cabrera (2005) define social exclusion as a dynamic and cumulative process with barriers and difficulties that separate individuals, families, groups and regions, with unequal social relations. This concept has suffered considerable transformations resembling certain phenomenon related with the existing poverty. Castells (2001: 98) defines social exclusion as «the process by which certain individuals and groups are systematically prevented from accessing positions that would allow them to subsist autonomously within the social levels determined by institutions and values in a given context». Usually, «that position is associated with the possibility of gaining access to a relatively regular paid job at least for one member of a stable family unit».
In Latin America, following Munck (2005), the term that resembles social exclusion is «marginality», a concept used by the Economic Commission for Latin America and the Caribbean (ECLAC) in the 1970s, to describe the consequences of concentration in urban areas, where people of scarce resources cannot be settled in the center of the cities, only in the peripheral areas that usually lack of basic services and infrastructure, generating poverty belts (Faria, 1995). If we compare the two meanings, we can say that social exclusion implies an obstacle to accesing economic, social and patrimonial benefits, among others, for a certain group of people. This obstacle can be caused by the hoarding of these benefits by other people or by discrimination for instance; in most cases, social exclusion is related to the current dynamics of economic growth, which are not redistributive or equitable. On the other hand, marginalization is a consequence of social exclusion; when some people cannot be part of social benefits, they become deprived of certain goods and services that are the right of the whole society, such as housing, health, education, income, etc. These people are marginalized within economic growth and development because they do not have the skills demanded by the economic system. Hence, social exclusion is considered multidimensional as it encompasses marginalization, poverty and social backwardness.
Another important component of social exclusion is labor precariousness. Economic dynamism, and globalization itself, involves precariousness as a form of maintaining international advantage (concept that is not considered within the definition of poverty), since the cost of capital (cutting edge technology) increases and the only cost that can be manipulated is labor. According to Porciles et al. (2007), high wages are a result of the level of education reached by the labor force, and are accompanied by an increase in the workers’ health and the reactivation of their competitiveness. But, the most important implication of high salaries is that they strengthen the domestic market and allow production, consumption and employment to be driven by endogenous factors (aggregate demand) and not by exogenous factors (exports), at the time that they serve as a shock buffer for external disturbances. In turn, this generates a virtuous circle of growth, which implies greater preparation of human capital, competitiveness and productivity of the workers, and, in consequence, a higher effective demand. However, the case of the Mexican economy is exactly the opposite: greater precariousness of the labor force generated by slow economic growth and a weak internal market that increasingly tends to exacerbate social exclusion in the country and its regions.
Therefore, social exclusion is a dynamic and cumulative process of barriers and difficulties that separate people, families, groups and population from the social life in territories where they settle, affecting certain regions with unequal relations with the rest of the society (Cabrera, 2005). The exclusion is a dynamic concept that depends not only on the current situations but it can also affect the future’s perspective (Atkinson, 1998). For Bel (2002), it is a result of the rupture of three factors: i) a structural factor, defined as the structures or relations of power (financial, economic, political, etc.) that are part of our exclusive environment; ii) the social context, related with demographic transformations that constitute the links that lead to disintegration and rupture in many cases; and, iii) subjectivity itself, the lack of love, communication or expectations that generate a loss of sense and meaning of life, uncertainty about the future, and so on. On the structural factor, it can be added that it is a feature of the system; the most remarkable of the structural circuit would be: a) Exit from the labor market in the form of unemployment, underemployment, precarious employment, and so on; b) imbalance in the distribution of income; and c) lack of social protection.
It can be also said that social exclusion can adopt different meanings and be applied to different situations, which implies that it is difficult to measure. Nonetheless, there are a few studies that have related social exclusion to economic growth; authors like Dell’Anno and Amendola (2015); Atkinson (2003); Atkinson, et al. (2010); Bourguignon and Chakravarty (2003); Bossert, et al., (2007) and Berghman (1995), have performed inferences and approximations regarding the subject. In this paper, we will make an approximation for the Mexican economy; we will consider factors such as living and housing conditions of people who cannot leave the situation of exclusion in the short term due to its pervasiveness.
Poverty and social exclusion have particularities in common (Jiménez, 2010); they are not necessarily synonymous but they have intersectional spaces given by their role in the social exclusion processes. While poverty implies merely an economic aspect, social exclusion is multidimensional and covers more characteristics that can be defined depending on the type of marginality analyzed. Along the same lines, poverty implies a status, while social exclusion is a «process» of social fragmentation (Bel, 2002). While the definition of poverty is more focused on the material and economic aspect of these people, and their situation within the productive sphere. For example, in Mexico, poverty used to be classified as food poverty, capacities poverty and patrimonial poverty. The first type is determined by the insufficient access to the cost of a «Basic Food Basket», which is supposed to satisfy the nutritional require- ments of the people; the second type allows determining whether the family income satisfies the education, health and food needs. Patrimonial poverty is the insufficiency of disposable income to acquire the Basic Food Basket, as well as the ability to cover the necessary expenses in health, clothing, housing, transportation and education (Aparicio, 2009 and Coneval, 2016). Other classifications consider the concept of absolute poverty as the lack of basic goods and services for the workers and their families, while some others call it relative poverty (Townsend, 1970). However, at the beginning of the 1980s, Sen (1984) criticized the pure notions of relative poverty, arguing that there is an irreducible core in the idea of poverty, characterized by hunger and starvation.
Unlike social exclusion, which is the absence of participation in the economic, political, cultural and social structure, Cabrera (2002) considers that poverty is characterized by deprivation of material and economic resources and when there is a lack of citizen rights. In addition, he refers to the inside-outside dynamics of the society in the participation of people and groups in different integration spheres, such as labor market, social and family relations or housing (García, 2003).
In summary, following to Dell’Anno and Amendola (2015), we observe that social exclusion borrows theoretical discussions from scarcity and poverty theories. Although these theories are related, their concepts of inequity and poverty found in Atkinson (1998) and Sen (1998, 2000), among others, are not equivalent. Hence, we use the definition of social exclusion as an involuntary phenomenon, not transient, of individuals and groups on aspects such as politics, economics and social processes that limit their total participation in society and in the regions where they live (Atkinson and Marlier, 2010). The concept refers to the comparison of groups or individuals and emphasizes the quality of their relationships. They can be considered socially excluded from the society where they live if there is a greater discontinuity in their relations with the rest of society, a low degree of social participation and lack of socioeconomic integration (Dell’Anno and Amendola, 2015).
3. The role of territory in social exclusion
The outcomes of economic development are not equally distributed in the national territory (Polese, 1998). This implies that economic growth is concentrated only in certain economic regions. Richardson (1986) mentions that the spatial economy is very heterogeneous because the population and industries are not uniformly scattered in space, they are agglomerated in specific locations, leading to the exclusion from the economic system of those territories and regions that do not have the capacity to attract industries and population. In that regard, Sen (2000) and Rubio (2003) considered that one of the sectors most affected by the phenomenon of social exclusion was the primary sector (peasants, farmers, and rural population in general). This is the utmost importance, given that the regions (taken as states) of southern Mexico are more focused on traditional agriculture, while those of the north and center of the country concentrate the industries. This implies a differential integration to the growth model undertaken in 1995 (North American Free Trade Agreement, NAFTA), which in some way exacerbates the exclusion of regions. Added to this, within each of these regions there are people who do not have the skills required by the economic model, which exacerbates their exclusion within the implemented economic system.
The concept that Polese (1998) calls «regional disparities» arises from that phenomenon, and is commonly used to denote welfare or development inequalities between regions. In addition to the above, the increase of income within a region «causes a progressive transfer of demand to urban products. This shift in demand generates an increase in the demand of urban land, which has an impact on urban land prices. The attraction of labor to the city is reflected in higher wages in the city than in the countryside. These higher salaries and the migratory movements that accompany them are the reflection of a continuous process of population mismatch and the evolution in the composition of the demand» (Polese, 1998: 44), where the «excluded» people do not have chance to enter to this dynamic by the impossibility of emigrating, and, if they do so, they have to live in the periphery, since they do not have the skills that the system requires to be included in the growth dynamics of the free market.
Despite its importance, measuring social exclusion is complicated; some authors like Dell’Anno and Amendola (2015) use a comprehensive measure of five indicators: employment, poverty, income inequality, education and health. For the case of Mexico, we consider that using the type of precarious housing, drainage and drinking water systems are the most suitable variables for characterizing social exclusion. These are characteristics that can be observed in the poverty belts and rural areas, which are a sign of a close relation of exclusion with poverty levels and other deficiencies (Cabrera, 2005).
The variables that we use for our indicator are also justified by Sen (2000, cited by Neville, 2007), since he considers that exclusion is related with the place of residence, housing and other services, such as nutrition, health, education and employment; without leaving behind the social and political participation (although in this case, we do not use it for our index), with the freedom «to do» and «to be», which, in conjunction, represent the multidimensional and multifactorial characteristics.
Finally within our proposal, we return to the ideas of Levitas (2005), who identifies two opposite perspectives influencing government policies. 1) The redistributive point of view emphasizes low income as the main cause of exclusion. It refers to excluded people as «those who deserve poverty» and implies that their problems must be addressed through the system of social benefits; and 2) The social integration perspective considers unemployment as the main cause of exclusion, which means that people are excluded not only because they do not have a job or their income is very low, but also because they have experienced long or prolonged periods in this situation and have little chance of improvement in the future (Turok et al., 1999).
The authors who have made econometric estimations about social exclusion are few. Within the literature we find Aya (2010); who makes different econometric estimations using the Ordinary Least Squares estimator (OLS). The author uses different endogenous variables such as: lack of basic needs, material deprivation, housing, subjective poverty, exclusion from the system, lack of activities and lack of social relations. As exogenous, the author used variables such as equivalent household income, sex, age, and work status, among others. The main findings of this author are: «sections of the population which are most vulnerable to social exclusion are not necessarily vulnerable in terms of income poverty. Young people face a higher risk of material and housing deprivation compared to other age groups. The elderly, who are the far poorest in terms of income poverty in Japan, face less risk of material and other types of deprivation. One of the groups most at risk of social exclusion is men in their 50s» (Aya, 2010: 28). However, social exclusion in Japan is very different from the most vulnerable groups in Mexico. Hence, we group variables that could be considered as those that adequately capture social exclusion.
4. Data and the model approach
4.1. Data
Veltmeyer (2002) considers that the five main possible forms of social exclusion are: (1) lack of access to labor markets, which is reflected in the labor force participation rate; (2) lack of access to job opportunities, which is reflected in the unemployment rate; (3) lack of access to «decent or good quality jobs», more clearly reflected in the evidence of overemployment and underemployment rates, and in the growth and prevalence of «eventual» jobs (involuntary shorted working time, halftime, temporary, etc.) with a high degree of informality and low wages, as well as «self-employment»; (4) reduction of access to social services and forms of social development, such as education, health and social security (see below), and (5) inability of household members to afford their basic needs, reflected in relative and absolute poverty indicators.
For Mexico, León et al. (2008) proposes in his paper Poverty and Social Exclusion in Mexico, a series of indicators that were constructed from the available information. For the accomplishment of the empirical work, the author used the statistical information from the National Household Income and Expenditure Survey (ENIGH, for its acronym in Spanish) in Mexico. The index of social exclusion includes some of the following social variables: a) Households with walls of inadequate materials; b) Households with roofs of inadequate materials; c) Households with permanent leaks; d) Households with uncoated floor; e) Households without an indoor kitchen; f) Households whose members sleep in the kitchen; g) Households whose members live in a borrowed house; h) Households without sanitary services (toilet, latrine or similar); i) Households without private sanitary services; j) Households without drainage; k) Households without electricity service, l) Households without any type of telephone service.
Considering the recommendations of several theorists and analyzing both of the indexes proposed above and their importance for this study, we observe that there is no mention of the lack of access to: 1) a basic food basket, and 2) potable piped water services inside the household, which we do include in our proposed indicator (as shown in Table 1). In the construction of the social exclusion index we use data from the National Population Censuses collected by INEGI in the years 2005, 2010 and 2015, as well as the Economic Censuses of 2004 and 2014 collected by INEGI as well. For the calculation of the index we use the Principal Components Analysis (PCA).
Variables used for the social exclusion index
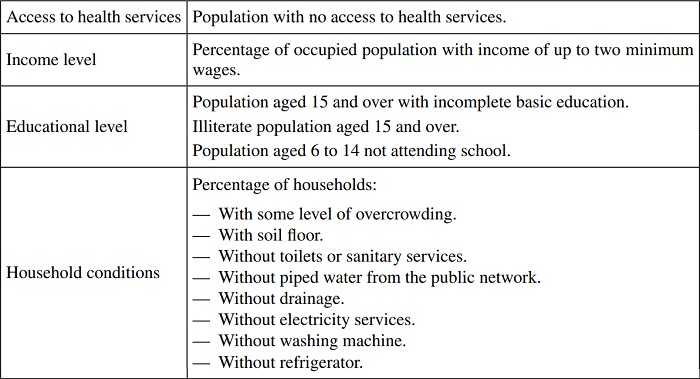
Source: INEGI, National Population Census, different periods.
Unlike the marginalization index (MI) calculated by the National Population Council (CONAPO, for its acronym in Spanish), we include additional variables such as: a) population not beneficiary of health services, which implies that this sector of the population is excluded from the public health system, making them more vulnerable; b) population aged 6 to 14 not attending school, which limits their ability to prepare themselves and limits their access to the labor market in a competitive way; c) households without washing machines and refrigerator, which could ease their living conditions and influence the welfare of their members. In the econometric estimation we use both indicators: the one that we build with the principal components methodology and the marginality index that CONAPO generates as endogenous variables. The Marginalization Index, according to CONAPO (2010), «is understood as the set of social problems (disadvantages) of a community or locality and refers to groups of people and families». Marginality refers to marginalized individuals, par- ticularly urban ones, understood as those who are on the edge and are not part of the rural areas that expelled them, nor of the city that does not receive them. It refers to those individuals who are not in the structure of society; they only occupy a part of the territory, and are outside the social, economic and political patterns. In this way, the marginalization index seeks to establish an analytical parameter that allows understanding when a sector of society is in a situation where opportunities for development are not present, nor is the ability to find them.
Another indicator that Mexican institutions provide is the index of social lag which according to Coneval (National Council of Social Development Policy), is a measure in which a single index adds variables of education, access to health services, housing quality, housing spaces, basic services, and assets in the household. In other words, it provides the summary of four social deficiencies of the CONEVAL poverty measurement: educational lag, access to health services, access to basic services in housing and quality and spaces in housing.
It is not a measure of poverty, since it does not incorporate the indicators of income, social security and food; it allows having information of disaggregated social indicators up to the local level, with which CONEVAL contributes with the generation of data for decision making in social policy, especially to analyze the inequality of social coverage that subsists in the national territory.
In the construction of the index of social exclusion (SEI) we use Principal Components Analysis (PCA) which is a multivariate statistical technique that reduces the size of a high set of variables, called factors or components (Pérez, 2008). This means, once these patterns in the data are found, the data is compressed by reducing the number of dimensions without much loss of information. Salas (2014) mentions that, given a set {x1, x2,..., xn} of observations in Rp, we look for a set of vectors {z1, z2,..., zn}, elements of Rp, so that the vector z1 has the highest possible proportion of the total variance of the data {x1, x2,..., xn}, the vector z2 has the greatest variance among the vectors that satisfy the condition of being orthogonal to z1 and such that the covariance between z1 and z2 is 0. Similarly, the vector zj (j p) has the greatest variance between the vectors that satisfy the condition of being orthogonal to zj-1 and such that the covariate between zj and zj-1 is 0. The objective of this type of analysis is to determine if the first components account for the greatest possible variability without a significant loss of information (Salas, 2014).
Within the calculation, the first step is to make a graph of i with respect to i, selecting the components until the rest have approximately the same value. The idea is to look for an elbow in the graph until finding a point where the eigenvalues are almost equal to the smallest value. The Elbow or Spree Diagram (Figure 1) shows the component number from which the additional contribution is smaller each time. In the case of Figure 1 (made for 2005), from the second component onwards, the contributions of the additional components are increasingly smaller.
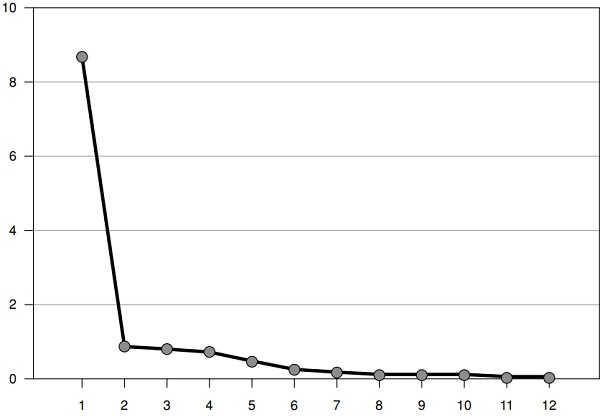
Figure 1
Scree plot 2005
As a third step, the average variance is used to determine a threshold; then, the values greater than that threshold are selected. In the case of the correlation matrix, the mean value corresponds to 1. The matrix of components obtained indicates that the correlation coefficients of the original variables are typified with principal components.
Finally, the KMO test is a mechanism to measure if the partial correlations between the variables considered are small. Its value oscillates between 0 and 1 and a value greater than 0.5 percent is sought, since a lower value indicates that there is a diffuse correlation, which limits the value of the transformation process by principal components. For our exercise in 2005 we found a KMO of 0.754, which justifies the use of this method.
4.2. Model Approach
The importance of the panel data according to Wooldrige (2002) is that they allow the capture of unobservable heterogeneity, either between economic or study agents over time. This technique offers several advantages, such as the ability to control for heterogeneity and allow for more variability reducing the issue of multicollinearity and providing more degrees of freedom (Baltagi, 2005). The variables sometimes present spatial heterogeneity and spatial autocorrelation when we work with cross-sectional observation and spatial units (Anselin, 1988), so the technique is limited and its spatialization is necessary. If we incorporate the spatial lag of our variable of interest as Anselin (1988), Lesage and Pace (2009), Giuseppe (2014) and Elhorst (2014) suggest, we obtain the following equation:
 (1)
(1)Where utis the error component and is defined as:
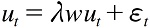 (2)
(2)Where ytis a Nt×1 vector of the dependent variable, lN is a constant term and xtare the independent variables; and are coeficients and tis an error term. In this case, is the spatial autorregresive term, and scalar is the spatial autocorrelation term.
Within equations 1 and 2, the heart of the spatial estimation is the spatial weights matrix (or connectivity matrix); its definition is of vital importance. W is a positive square matrix whose dimension depends on the size of the data sample and describes the arrangement of possible interactions between spatial units. The elements wijare the spatial weights; when there is no neighborhood they are equal to zero. The elements of the main diagonal are zero because the possibility of self-proximity is excluded. Following Anselin (1988), each element of the matrix is defined as .
Where N(i) is a series of neighbors j. By definition we have that wij= 0, although different types of neighborhoods are feasible and it is possible to incorporate different types of variables that are not limited only to the contiguity. Among the options we find the matrix of spatial weights using time and distance. Despite other options, the most common is to use a first order contiguity. In addition to the above, Anselin (1988) considers that the fewer neighbors a region has, the greater the influence they exert individually on the central unit. Finally, it is important to note that we work with a normalized contiguity matrix, which implies that the sum of the rows is equal to one and represents a smoothing of the neighbors’ impacts.
In previous equations, wytand wxtrepresent the spatially weighted dependent and independent variable in the matrix form respectively. Following Parajuli and Haynes’ (2017) notation, and based on the value of , and , different types of models can be specified:
If = 0 and = 0: Spatial autorregressive model (SAR).
If = 0 and = 0: Spatial error model (SEM).
If = 0: Spatial Durbin Model (SDM).
If = 0, = 0 and = 0: Non spatial model.
With the SDM we can determine the influence of the exogenous variables gener- ated within a region; this is known as direct impacts, while indirect impacts measure the influence of the exogenous variables of the neighbors on the endogenous variable of a given region. With this model we can obtain «the loop feedback effect» (Anselin, 1988, Lesage and Pace, 2009, Giuseppe, 2014, Goodchild and Haining, 2004, and Fisher and Getis, 2010).
Finally, the advantage of panel data according to authors such as Wooldrige (2002), Mendoza and Quintana (2016), Hsiao (2003) and Carbajal and De Jesus (2017) is that they can be interpreted through their error components, which means that the term uit can be decomposed in the following way:
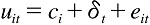 (3)
(3)Where represents the individual or unit of study in cross-sectional data, cirepresents an unibservable variable that remains constant over time for each observation (unobservable individual effect), trepresents the non-quantifiable effects that vary in the time but not between units of study and, eit refers to the error term (Carbajal and de Jesus, 2017). In this way, the general static panel model has two sources of het- erogeneity between the cross-sectional i elements: for the individual constants ci, and for the existing individual relation parameters ibetween the endogenous variable yitand the exogenous variables xit(Mendoza and Quintana, 2016).
From the different assumptions about the specific effects of ci, Carbajal and De Jesus (2017) mention three possibilities: a) when ci= 0, which implies the inexistence of observable heterogeneity among individuals (pool effect); b) when ciis assumed as a fixed and different effect for each individual, so that the linear model is the same for all individuals but the intercept is specific for each of them; in this case, the non-observable heterogeneity is included in the constant of the model; and c) when ciis treated as a non-observable random variable that varies among individuals but not in time; in this case, unobservable differences are incorporated into the disturbances. As mentioned by Baltagi (2005) and Carbajal and De Jesus (2017), most applications with panel data use the error component model in one direction and assume that t= 01.
In our approach, we follow authors who have analyzed the relationship with economic disparities and income distribution, as an example Dell’Anno and Amendola (2015) cites Aghion, et al. (1999), Temple (1999) and Ehrhart (2009) in the applied studies. For the Mexican economy we have the studies of Cruz (2013), Diaz (2002), Esquivel (2015) and Tello (2009).
Following Dell’Anno and Amendola (2015), Campos and Monroy-Gomez-Franco (2016) and Dahlquist (2013), we take the social exclusion index sei = ln(SEI) as an endogenous variable and relate it with some economic indicators, the gdp per capita [gdpc = ln(gdpc)] and other exogenous variables, such as the social backwardness index (sbi), the employment specialization index in manufacturing sector ceva = (eij/ej)/(ei/et), the manufacturing productive specialization index clvaman = (vaij/vaj)/(vai/vat), and the manufacturing remuneration that is expressed in logarithm, where i = manufacturing sector, j = states and t = sector total. Our objective is to [rem = In(REM)] analyse the relationship between inequality and the per capita gdp, including the social exclusion index as indicator of this existent inequality in several Mexican regions. We also use as an endogenous variable a marginalization index mi = ln(MI).
5. Empirical evidence
5.1. Exploratory analysis of social exclusion and economic growth
Figure 2 shows the spatial distribution of GDP per capita, the social exclusion index and the marginalization index for the period 2005-2015. In the first map we visualize the highest concentration of GDP per capita in the darkest color; here we find the states of Campeche, Quintana Roo, Tabasco, Tamaulipas, Nuevo Leon, Coahuila, Sonora, Baja California and Baja California Sur. In general, we can observe that the values of the Marginalization Index are lower than the Social Exclusion Index (black and white bar graph in states); the highest values of this last index are located in the southern part of the country.
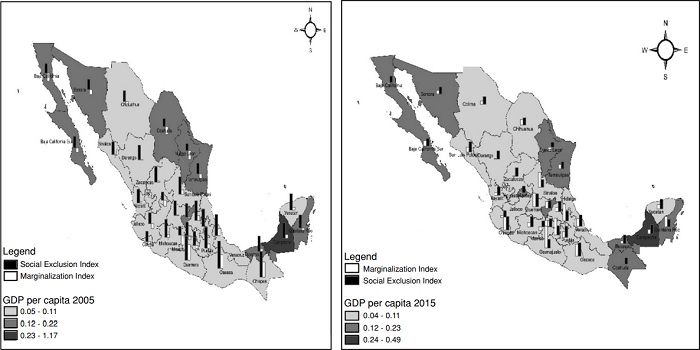
Figure 2
GDP per capita, social exclusion, and marginalization index, 2005 and 2015
Source: own elaboration with data of population and housing census from INEGI.
If we focus on the second map that refers to 2015, we find a high per capita GDP concentration in only 7 states (darker color); the highest values of both mi and sei are concentrated in central and southern Mexico. It is important to highlight that the values of these indices are almost the same in the states of Guerrero, Oaxaca and Chiapas, where we find coincidence of the indicators that we elaborate and the ones that the Mexican institutions provide.
Finally, if we apply the Moran’s I test to the endogenous variables of our model, sei and mi, we find for the first indicator a Moran’s I value of 0.48 (0.00) for 2005, which is maintained for 2010 and 2015, 0.50 (0.00) and 0.48 (0.00) respectively; which is a sign of spatial autocorrelation, given that the null hypothesis of spatial autocorrelation is rejected. For the case of the marginalization index, we find no evidence of spatial autocorrelation in any of the periods analyzed with the Moran’s local I.
5.2. Econometric estimation
There are a number of issues that have to be accounted for while calibrating a panel data model. The fixed effects model is generally preferred when there is a specific set of cross-sectional observations (Baltagi 2005, Parajuli and Haynes, 2017). In this study, the fixed effects models will be adopted according to Hausman Test.
In the choice of the final model we used the following criteria: a) estimation of the model by period, where the Lagrange Multiplier (lag) and Robust LM (lag) tests showed better statistical significance than the Lagrange Multiplier (error) and Robust LM (error) in the three periods; b) we take into account the statistical significance of the coefficients of the indirect impacts (i) in addition to the statistical significance of the spatial autocorrelation parameters (t and m); c) the models SAR and SDM will be calibrated, for this we use log-likelihood, Akaike Information Criterion (AIC) and Bayesian Information Criteria (BIC) to select the appropriate model (Parajuli and Haynes, 2017).
Finally, the Hausman test determines if the model is the fixed-effects model or the random-effects model, given the 1-3 model of p-value < 5% significance level, we use the fixed effects estimator. The statement of Parajuli and Haynes (2017: 69) is also taken into account: «As the unit of observation is not randomly selected, the fixed effects estimation makes sense. It should also be noted that the observation period is short and hence unit root analysis of individual time series is often not effective». The SXMLE module in Stata will be used for estimation purposes, following Belotti et al. (2016) and Parajuli and Haynes (2017).
The main findings of the models Spatial Lag (SAR) and Spatial Durbin Model (SDM) can be observed in Table 2. It is important to emphasize in the econometric test that the exogenous variables included in the model maintain a statistical significance if the endogenous variable is the social exclusion index (sei). This was not observed with the marginality index (mi) since the exogenous variables are not significant. In order to test this, we made several exercises and estimated eight models in total: models 1 to 4 use sei as an endogenous variable, while models 5 to 8 use the marginalization index mi.
Spatial panel models, 2005-2015
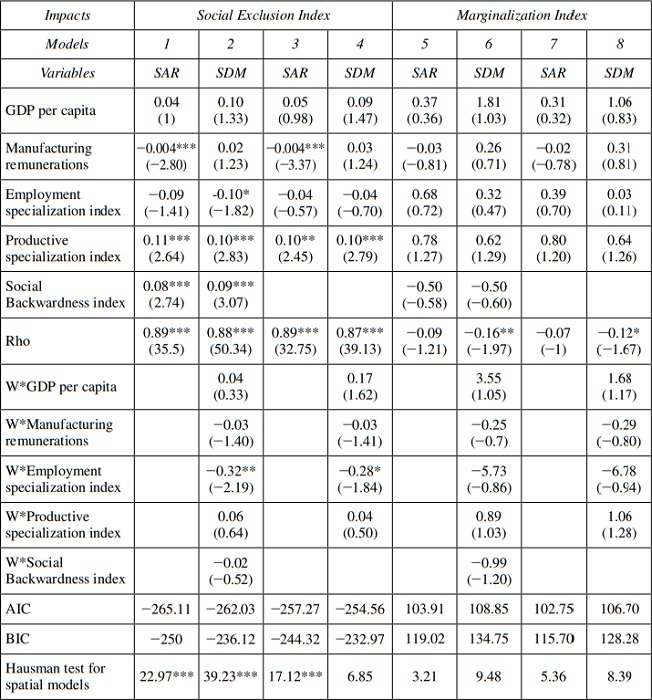
***, **, *: are the levels of significance of 1%, 5% and 10% respectively.
t statistics of each estimated coefficient are shown in parentheses.
Source: Authors’ elaboration based on information from the economic and population censuses.Table 2 shows the estimated values of the fixed effects SAR and fixed effects SDM, in which the logarithm of social exclusion index is the dependent variable. Based in AIC and BIC values, the preferred model is the fixed effects SAR (Model 1). In this model, the spatial dependence associated with the social exclusion index (t) is positive and statistically significant and suggest that the social exclusion is spatially endogenous with respect to individual counties. Manufacturing remunerations, productive specialization index and social backwardness index are statistically significant where the first is negatively associated with the social exclusion and the last two variables are positively associated.
It is important to note that the SDM estimates are not interpreted as partial derivatives as in the classical regression technique (see Lesage and Pace, 2009 and Parajuli and Haynes, 2017). Following Lesage and Pace (2009) a change in a single observation (region) associated with any given explanatory variable will affect the region by itself (a direct impact) and potentially affect all other regions indirectly (an indirect impact). This is one of the benefits of the spatial analysis, where, unlike the classical estimation (OLS) we can obtain the impact of the regions on a particular variable. Instead, the direct, indirect, and total effects, as show in Table 3, are interpreted (using the SAR model).
Estimated direct, indirect, and total effects
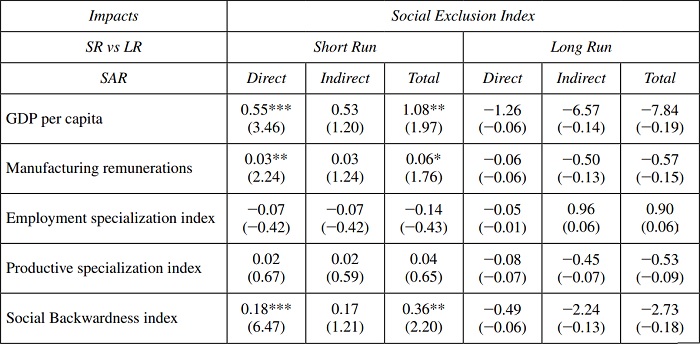
***, **, *: are the levels of significance of 1%, 5% and 10% respectively.
t statistics of each estimated coefficient are shown in parentheses.
Source: Authors’ elaboration based on information from the economic and population censuses.We found the direct impact caused by GDP per capita to be 0.55 and statistically significant, although the indirect impact is not significant; the total impact is of 1.08 in the short term, but in the long term none of them were significant and this is because we have a short panel and not a long one. The direct impact of manufacturing remuneration also tends to exacerbate social exclusion given the coefficient of 0.03, which is positive and significant; the total short-term impact is 0.06. In the same way, the direct impact of the social backwardness index is positive and significant as with the previous coefficients. The difference between the coefficient estimated from the Social Backwardness index (0.08) and the direct effect estimated (0.18) is 0.1, which reflects a positive feedback to a county itself in terms of social lag. Although this value is very small it implies that an increase in social backwardness results in an increase in social exclusion among Mexican regions.
6. Conclusions
Social exclusion is one of the issues of concern for several specialists in the field of poverty, given that there are no adequate ways to insert them into the labor market and into the productive system. This is because the determinants of exclusion are not adequately known and the only focus is on analyzing poverty. Excluded people are not immersed in the productive system; hence, the growth of GDP per capita does not tend to influence their improvement or inclusion as we saw with the empirical evidence. Remunerations in the manufacturing sector tend to negatively influence the increase in social exclusion given their statistical significance; however, their contribution has been too small.
In the same way, the productive specialization index tends to exacerbate social exclusion, which implies that seeking the consolidation of productive sectors, although good for the economy and for the people who work in these sectors, does not solve the problem of those who are excluded. The free market adopted in recent decades in the Mexican economy, which is focused on competitiveness with a minimalist role of the State, where free market forces are the guarantors of population well-being and of the good distribution of productive resources, and where the most competitive and the fittest survive, work only for the population that is not excluded. Hence, it is necessary that excluded people, with the characteristics we mention in this work, be initially supported by the government and encouraged to move forward, given that the productive structure of the country by itself will not do so, as evidenced by the empirical work of this research. If this is not done, social exclusion will affect not only one region, but there will be a positive spill-over effect of this problem.
Within the findings, what draws our attention is that the social indicator provided by the Mexican government (marginalization index), when used as an exogenous variable within the model, is not significant (in addition to being under-dimensioned). On the contrary, we see a negative correlation of rho, which shows a non-spatial behavior, contrary to the indicator that we constructed. This would make a big difference in policy recommendations, given that if this indicator is used to address the poverty and exclusion problems in the different Mexican regions, it would lead to a bias in the proposals, and would show a decrease in these indicators in certain regions such as we saw on the maps, where the opposite occurs. Hence, the construction of indicators should be improved to really capture the problem of exclusion. What we show here is only a proposal and our contribution revolves around the need to improve the construction of indicators, which really capture the problems of the regions. Although it is an arduous task, we believe that analyzing the true causes of poverty and exclusion in different regions could be possible if there were government participation and a true alliance with the academic sector interested in the subject.
In addition, there are characteristics of particular localities and spatial barriers to external opportunities that damage people’s life opportunities and make it more difficult for them to improve their income when they do not enter into this regional growth dynamic. Living in a neighbourhood where most of the people are poor can make conditions even worse for the individuals, since local services and establishments are prone to be smaller in number and worse in quality.
The meaning of «place» is a recurring topic in the debate regarding social exclusion and requires specific consideration. Economic policies need to integrate the population (as in this case), to specialize and enable people to have access to the dynamics of economic development led by the free market, since simple economic growth cannot do it by itself, it sharpens it. There are several forms in which people and communities are excluded because they live in certain disadvantaged areas. Addressing these problems requires the recognition of the importance of places of residence, together with the spatial organization of towns and cities.
The ideal scenario would be to reverse this situation, but it has to be with a government truly engaged and concerned about excluded people and that targets these individuals to include them in the dynamics of growth and development. Otherwise the implementation of different social policies and programmes that have been implemented in the country will not be enough to integrate them. Overcoming this barrier involves recomposing the dual and polarized productive structure. It involves working on many aspects, for example, integrating local producers into the value chains (which could not only generate profits for micro-entrepreneurs, but also generate jobs in regions that are not integrated in the national and international dynamism). Focus should be made on the growth of the export industry to generate wages for the rest of the economy instead of limited growth that benefits only large transnationals. Otherwise, all recommendations on wages, employment and the labour market that are made and provided will remain in the void.
Referencias
Aghion, P., Caroli, E., and Garcia-Peñalosa, C. (1999): «Inequality and Economic Growth: The perspective of the new growth theories», Journal of Economics Literature, 37, 1615-1660.
Andrés-Rosales, R., Quintana-Romero, L., Namkwon, M., and Hewings, J. D. G. (2017): SMEs’ Productivity in the Mexican Regions: A Spatial Panel Data Approach, Documento de trabajo, 1-26.
Anselin, L. (1987): «Spatial Dependence and Spatial Heterogeneity, a Closer Look at Alternative Approaches», Working Paper, Department of Geography, University of California, Santa Barbara.
— (1988): Spatial econometrics methods and models, California, Kluwer Academic Publishers.
Anselin, L., Le Gallo, J., and Jayet, H. (2008): «Spatial panel (Capter 19)», in L. Mátyás and P. Sevestre (eds.), The econometrics of panel data, Berlin Heidelberg, Springer-Verlag.
Aparicio, R. (2009): «La pobreza por ingresos», en R., Aparicio, V. Villarespe, and C. Urzúa (coords.), Pobreza en México: magnitud y perfiles, México, Consejo Nacional de Evaluación de las Políticas de Desarrollo Social, Universidad Nacional Autónoma de México, Instituto de Investigaciones Económicas, Instituto Tecnológico y de Estudios Superiores de Monterrey.
Atkinson, A. B. (1998): «Social exclusion, poverty and unemployment», en A. B. Atkinson, y J. Hills (eds.), Exclusion, employment and opportunity, Case Paper 4,1-20.
— (2003): «Multidimensional deprivation: contrasting social welfare and counting approaches», Journal of Economic Inequality, 1, 51-65.
Atkinson, A. B., and Marlier, E. (2010): Analysing and measuring social inclusion in a global context, New York, Department of Economic and Social Affairs, United Nations (UNDE- SA).
Aya, K. A. (2010): «Social exclusion and earkuer disadvantages: an empirical study of poverty ans social exclusion in Japan», Social Science Japan Journal, 13 (1), 5-30.
Baltagi, B. H. (2005): Econometrics analysis of panel data, West Sussex, UK, Jojn Wiley & Sons.
Bel, A. C. (2002): Exclusión social origen y características, Facultad de Letras, Universidad de Murcia, http://enxarxats.intersindical.org/nee/CE_exclusio.pdf, consultado el 30 de enero de 2016.
Belotti, F., Hughes, G., and Piano, A. (2016): «Spatial panel data models using state», CEIS Research Papers, 14(5)1-40.
Berlin, G. L. A. (2003): El concepto de exclusión social. Análisis económico de la exclusión social, Madrid, Consejo Económico y Social.
Berghman, J. (1995): «Social exclusion in Europe: Policy context and analytical framwork», en G. Room (ed.), Beyond the threshold: The measurement and analysis of social exclusion, Bristol, Policy Press, 10-28.
Bossert, W., D’Ambrosio, C., and Peragine, V. (2007): «Deprivation and social exclusion», Economica, 74, 777-803.
Bourguignon, F., and Chakravarty, S. (2003): «The measurement of multidimensional poverty», Journal of Economic Inequelity, 1, 25-49.
Cabrera, C. P. (2002): «Cárcel y Exclusión social», Revista del Ministerio de Trabajo y Asuntos Sociales, 35, 83-120.
— (2005): Nuevas tecnologías y exclusión social. Un estudio sobre las posibilidades de las TIC en la lucha por la inclusión social en España, Madrid, Universidad Pontificia.
Campos, V. R. M., y Monroy-Gómez-Franco, L. A. (2016): «La relación entre el crecimiento económico y la pobreza en México», Investigación Económica, vol. LXXV (298), oct.- dic., 77-111.
Carbajal, Y., and De Jesús, L. (2017): «Empleo manufacturero en la región centro de México. Una estimación por gran división», Contaduría y Administración, 62, 880-901.
Castells, M. (2001): La era de la información. Fin de milenio, vol. 3, Madrid, Alianza Editorial.
Conapo (2010): Consejo Nacional de Población y vivienda, file:///F:/2017/articulos%20para%20publicar/exclusi%C3%B3n%20social/marginlidad%20vs%20marginacion.pdf.
Coneval: Consejo Nacional Para la Evaluación de la política de desarrollo social, http://www.coneval.org.mx/Paginas/principal.aspx.
Cravo, A. T., Gourlay, A., and Becker, B. (2012): «SMEs and Regional Economic Growth in Brazil», Small Bus Econ, 38, 217-230.
Cruz M. J. N. (2013): Distribución del ingreso y los modelos de desarrollo en México, Instituto de Investigaciones Económicas - UNAM, 1.ª ed., 188 pp.
Dahlquist, M. (2013): Does economic growth reduce poverty. An empirical analysis of the relationship between poverty and economic growth across low and middle-income countries, illustrated by the case of Brasil, Sodertorn University, 1-48.
Dell’Anno R., and Amendola A. (2015): «Social exclusion and economic Growth: an empirical investigation in European economies», Review of Income and Wealth, series 61(2), june, 274-301.
Díaz, L. M. (2002): «Globalización y pobreza: Dicotomía de desarrollo en América Latina y México», Espacio Abierto, 11(2).
Durkheim E. (1934): «On the Division of Labor in Society», American Journal of Sociology, 40(3), 319-328.
Ehrhart, C. (2009): «The effects of inequality on growth: A survey of the theoretical and empirical literature», Society for the Study of Economic Inequality, ECINEQ Working Paper Series, 2009-107.
Elhorst, J. P. (2014): Spatial Econometrics. From cross-sectional data to spatial panels, The Newtherlands, Springer.
Erthur C., and Koch, W. (2007): «Growth, technological independence and spatial externalities: theory and evidence», Journal of Applied Econmetrics, 22(2), 1033-1062.
Esquivel, G. (2015): «Desigualdad extrema en México: concentración del poder económico y político», Reporte de Oxfam México, 23, 1-43.
Faria, V. (1995): «Social exclusion and Latin American analyses of poverty and deprivation», en C. Gore, G. Rodgers y J. B. Figueiredo (eds.), Social exclusion, rhetoric, reality, re- sponses, Genova, International Institute for Labour Studies.
Fisher, M. M., and Getis, A. (2010): Handbook of applied spatial analysis, springer.
García, L. A. (2003): «El concepto de exclusión social», en VVAA, Análisis económico de la exclusión social, Madrid, Consejo Económico y Social, 1-26.
Giuseppe, A. (2014): A primer spatial econometrics with application in R, England, Palgrave Macmillan.
Goodchild, F. M., and Haining, R. (2004): «GIS and spatial data analysis: converging perspective», Paper in Regional Science, 83(1), 363-385.
Hsiao, C. (2003): Analysis of panel data, Third edition, California, Cambridge University Press.
Jiménez, R. M. (2008), Theoretical approach to social exclusion: complexity and ambiguity of the term. Consequences for the education, Departamento de Pedagogía. Facultad de Ciencias de la Educación, Universidad de Granada, Campus de Cartuja.
Leon, M. A., Domínguez, D. J., and Núñez, V. (2008): Poverty and social exclusion in Mexico, España, Universidad de Alcalá (UAH).
Lesage, J., and Pace, K. R. (2009): Introduction to spatial econometrics, London, CRC Press/ Taylor and Francis Group.
Levitas, R. (2005): The inclusive Society? Social exclusion and new labor, second edition, Palgrave Macmillan, UK.
López-Bazo, E., Vaya, E., and Artis, M. (2004): «Regional externalities and growth: evidence form European regions», Journal of Regional Science, 44(1), 43-73.
Mendoza, G. M., and Quintana, R. L. (2016): «Modelos panel y sus aplicaciones en R», en G. M. Mendoza y R. L. Quintana, Econometría aplicada utilizando R, México, FES Acatlán-Saree.
Millo, G., y Piras, G. (2012): «SPLM: Spatial panel data models in R», Journal of Statistical Software, april, 47(1), 1-38.
Munck, R. (2005): Globalization and social exclusion: a transformation a list perspective, USA, Kumarina Press.
Neville, A. (2007): «Amartya K. Sen and Social Exclusion», en Development in Practice, vol. 17, No. 2 Abril, 249-255.
Parajuli, J., and Haynes, K. E. (2017): «Panel data models of new firm formation in new England», Region, 4(3), 65-76.
Pérez, C. (2008): Técnicas de Análisis multivariante de datos: aplicaciones con SPSS, Madrid, Pearson Prentice Hall.
Pérez, J., and Mora, M. (2006): «Exclusión social, desigualdades y excedente laboral. Reflexiones analíticas sobre América Latina», en Revista Mexicana de Sociología, 68(3), julio-septiembre, 431-465.
Polése, M. (1998): Economía urbana y regional: introducción a la relación entre territorio y desarrollo, Cartago, LUR (Libro Universitario Regional).
Porciles, G., Vinicios, M. D., and Meirelles, A. J. A. (2007): «Technology gap, real wages, and learning in a balance-of-payments-constrained growth model», Journal of Post Keynesian Economics, Spring, 29(3), 473, 473-500.
Richardson, H. W. (1986): Economía regional y urbana, Madrid, Alianza Editorial.
Rubio, B. (2003): Explotados y excluidos. Los campesinos latinoamericanos en la fase agroexportadora neoliberal, México, Plaza y Valdés.
Salas, C. (2014): «Análisis de components principals: una aplicación para construir un índice estatal de precariedad laboral en México», en R. L. Quintana y R. Andrés-Rosales, Técnicas modernas de análisis regional, México D. F., Plaza y Valdés.
Sen, A. (1984): Social exclusion: concept, application, and scrutiny, Master of Trinity College, Cambridge, and Lamont University Professor Emeritus, Harvard University.
— (1998): Social exclusion and economic measurement, document presentado en el 25th Gen- eral Conference of International Association for Research in Income and Wealth, Cambridge UK.
— (2000): Social Exclusion: Concept, Application, and Scrutiny, Manila, Asian Development Bank (Social Development Papers, 1).
Tello, C. (2009): Sobre la desigualdad en México, Facultad de Economía-UNAM.
Temple, J. (1999): «The new groth evidence», Journal of Economic Literature, 37, 112-56.
Townsend P. (1970): Poverty in the United of Kingdom. A survey of household resources and stands of living, Grand Bretaña, Hazell Watson and Viney.
Turok, I., Kearns, A., and Goodlad, R. (1999): «Social Exclusion: In What Sense a Planning Problem?», The Town Planning Review, vol. 70, No. 3, A National Spatial Planning Frame- work for the UK, Jul, 363-384.
Veltmeyer, H. (2002): «Social exclusion and models of development in Latin America», Canadian Journal of Latin American and Caribbean Studies / Revue canadienne des études latino-américaines et caraïbes, 27(54), 251-280.
Wooldridge, J. M. (2002): Econometric Analysis of cross section and panel data, Cambridge, Massachesetts, London, England, The MIT Press.
Ziccardi, A. (2008): «Pobreza urbana y Políticas de inclusión social en las comunidades complejas», Revista Bitácora Urbano Territorial, vol. 13, núm. 2, junio-diciembre, 93-108 Colombia, Universidad Nacional de Colombia Bogotá.
Notes
