Articles
Do the novelty and type of innovation affect the performance of firms? A case study for Ecuador
Do the novelty and type of innovation affect the performance of firms? A case study for Ecuador
Investigaciones Regionales - Journal of Regional Research, núm. 52, pp. 81-102, 2022
Asociación Española de Ciencia Regional

Esta obra está bajo una Licencia Creative Commons Atribución-NoComercial 4.0 Internacional.
Recepción: 25 Enero 2021
Aprobación: 02 Agosto 2021
Resumen: Dado que la innovación es un motor de la productividad que conduce al crecimiento económico, se estudia el caso de un país en desarrollo como el Ecuador. El objetivo de este artículo es medir el efecto causal de la innovación en la productividad de las empresas distinguiendo el tipo de innovación, es decir, in productos, procesos, organización y marketing. Para ello se estima un modelo de conmutación endógena usando la Encuesta de Actividades de Ciencia, Tecnología e Innovación(STIA, 2011, 2014). Los resultados indican que la pérdida de productividad es mayor para las empresas innovadoras si dejan de innovar que la ganancia de productividad de las empresas no innovadoras si se dedican a la innovación. La diferencia entre pérdidas y ganancias de productividad depende del tipo de innovación.
Palabras clave: Productividad, innovación, empresa, América Latina.
Abstract: Since innovation is a productivity driver that leads to economic growth, the case of a developing country, Ecuador, is studied. The aim of this paper is to measure the causal effect of innovation on firms’ productivity by distinguishing the type of innovation, namely, in products, in process, in organization and in marketing. To do so, an endogenous switching model is estimated using the Science, Technology and Innovation Activity Survey. The results indicate that the productivity loss is higher for innovating firms if they stop innovating than the productivity gain of non-innovating firms if they engage in innovation. The difference between the productivity losses and gains depends on the type of innovation.
Keywords: Productivity, innovation, firms, Latin America.
Introduction
Innovation has been considered a key factor for economies (Romer, 1994; Schumpeter, 1934) since it boosts the productivity of firms through the reduction of production costs and allows them to access new markets. Particularly, in developing countries, innovation might play a crucial role in the catching-up process since it is an important tool to achieve industrialization (Chataway & Wield, 2000). In many studies, it has been demonstrated that the gap in terms of income and productivity across countries has increased (Landes, 1998). One factor of such divergence might be the level of innovation. Developing countries might find innovation very costly since they face limitations on technology and human capital (Fazlıoğlu et al., 2018). Those countries, then, have low levels of innovation and tend to fall behind. In fact, in 2018[1], it was found that there is a positive correlation of 0.278. This implies that countries with a higher level of innovation also have higher GDPs. In addition, according to Euromonitor International, the Latin American average was $US 18,351 and the average for the OECD countries was $US 77,929. Such poor performance raises policy concerns that call for explanation and action. So far, the existent literature for developing Latin American countries show a significantly positive effect of innovation on firms’ performance (Alvarez et al., 2010; A Cassoni & Ramada, 2010; Chudnovsky et al., 2006; Correa, Sánchez, et al., 2005; G Crespi & Zuniga, 2012; J De Negri et al., 2007; Raffo et al., 2008) and a non-significant effect (Alvarez, Bravo-Ortega, & Navarro, 2010). While some of these studies take into account the type of innovation, namely, product and process, to the best of our knowledge, no attention has been paid to the effect of the novelty of innovations on the productivity in firms of Latin American developing countries. This is unfortunate since not only the type but also the novelty of innovations matter for productivity results (Chudnovsky et al., 2006; Fazlıoğlu et al., 2018; Hall et al., 2009; Mohnen & Hall, 2013). Especially, in developing countries, the way how innovation is conducted determines the results. Previous literature for developed countries has focused on the novelty, considering the environment to which a product is new, either new to the firm or new to the market (Fazlıoğlu et al., 2018). In this study, new and significantly improved products determine the degree of novelty of innovations. This approach is chosen for Ecuador since according to the Global Competitiveness Report, Ecuador is positioned as efficiency-driven economy which develops more efficient production process and increase product quality. Ecuador is not yet positioned as innovation-driven economy where firms compete through innovation (Schwab, 2009). In Ecuador only 46% of firms engaged in innovation and many of them developed only significantly improved innovations (60% out of the 46%). Ecuadorian firms are more likely to be innovation adopters or adapters (Crowley & McCann, 2018).
Motivated by these facts, this study aims to measure the causal effect of innovation by types and novelty degree on the productivity of firms in Ecuador. The case study of Ecuador is pertinent since it is among the lowest positions in terms of innovation in the world, occupying the 99th position out of 129 in 2019 (Dutta & Wunsch-Vincent, 2019). This negative outcome occurs in spite of the fact that in 2008, Ecuador's Constitution established the importance of a national science, technology, and innovation system, to develop technologies and innovations that boost national production, increase efficiency and productivity, and improve quality of life. Although a national policy on science, technology and innovation exists, innovation is still a field that needs attention, not only by the government but also by the entrepreneurial and financial sectors (Chudnovsky et al., 2006; Fazlıoğlu et al., 2018; Hall et al., 2009; Mohnen & Hall, 2013). Furthermore, to better understand the mechanisms that determine firms’ productivity and how self-selection of innovative firms influences the level of productivity, the question that arises is what other factors explain the labor productivity of innovating and non-innovating firms. So far, the knowledge about how firms undertake innovation activities is quite limited in Ecuador, causing innovation policies to be ineffective. Not only firm characteristics affect their level of productivity but also external factors such as the agglomeration economies surrounding them (Guevara Rosero, 2021; Sánchez Serra, 2016). This study analyses the effect of agglomeration economies derived from specialization, diversity and competition for both innovating and non-innovating firms.
To estimate the effect of innovation on labor productivity, following the Crepon et al., (1998) model, a novel and valid econometric approach, the endogenous switching model, is employed. This methodology allows controlling the endogeneity issue. For the case of Ecuador, we used unexplored data: the Science, Technology and Innovation Activity Survey (STIA, 2011, 2014) in the editions of 2011 and 2014. The findings show that while innovating firms obtain productivity gains from innovation, non-innovating firms show productivity losses from not innovating. Hence, public policies have to be aimed towards non-innovating firms in order to fulfill what Ecuadorian constitution establishes and their complementary legislation. This process should start with the innovation of products which generate a higher productivity gains for these firms and then incentives for innovation in process are necessary so that firms can sustain these gains. The innovation in process must be radical; otherwise, firms do not obtain productivity gains. Moreover, incentives for innovating firms must continue so they do not experience productivity losses from ceasing to innovate. Once firms engage in innovation, either new or significantly improved, they need to remain active in practicing innovation.
This paper is organized as follows: Section 2 presents the theoretical background regarding the role of innovation in productivity. Section 3 describes data and methodology. Section 4 discusses the results and Section 5 concludes.
The role of innovation on productivity
The role of innovation has been largely highlighted in the macroeconomic sphere. Solow (1957), Romer (1994) and Schumpeter (1934) have demonstrated that technological innovation is central for aggregate economic growth. However, innovation is conducted by firms in the microeconomic sphere. Firms that innovate can increase their productivity and gain competitivity in markets through the reduction of production costs and the increase of efficiency in operating activities (Lugones, G., Suárez, D., y Gregorini, 2007).
According to the empirical evidence, the effect of innovation on productivity may vary depending on the national context and on the type of innovation, namely, product innovation, process innovation, organizational innovation, marketing innovation, incremental and radical innovation. In developing countries, most of the empirical evidence show a significantly positive effect of innovation on firms’ performance and very few a non-significant effect. Raffo, Lhuillery, & Miotti, (2008) analyze the cases of Brazil, Mexico and Argentina and obtained that while product innovation has a positive and significant effect for the labor productivity in Brazil and Mexico, it is not significant for Argentina. The significant effect for Brazil, using both an innovation dichotomous variable for innovation and the intensity of product innovation (number of new products) is confirmed by Correa, Sanchez, & Singh, (2005) and De Negri, Esteves, & Freitas, (2007). The Argentinean case was also studied by Chudnovsky et al., (2006) with a larger period of study than the one used by Raffo, Lhuillery, & Miotti, (2008). The former obtained that labor productivity was, on average, 14.1% higher in innovators than in non-innovators, ceteris paribus. Higher statistical significance is found for innovators having introduced both product and process innovation (Alvarez et al., 2010; Adriana Cassoni & Ramada-Sarasola, 2010; Chudnovsky et al., 2006; Gustavo Crespi & Zuniga, 2012). Crespi & Zuniga (2012) in their study conducted for Latin American countries (Argentina, Chile, Colombia, Uruguay, Panama and Costa Rica) and using a structural recursive model CDM, show a positive impact of technological innovation on productivity for all countries, except for Costa Rica. In addition, a positive impact of non-technological innovation on productivity was found only for Argentina and Colombia. Interestingly, the elasticities of productivity with respect to product and process innovation in these countries range between 24% and 192%. These results are above the elasticity reported for industrialized countries (studies on Spain report an elasticity of 18%). It seems that social rates of return on innovation are much higher in developing countries than in developed ones. The productivity gap with respect to the technological frontier in developing countries is high so that an introduction of technological innovation can boost firm productivity in a large proportion (Gustavo Crespi & Zuniga, 2012). The positive effect of innovation in Uruguay was confirmed by Cassoni & Ramada-Sarasola (2010), who obtained a stronger effect of process innovation than product innovation on the growth rate of labor productivity. For the Peruvian case, Espinoza Peña (2007) also show a significantly positive effect of the innovation sales on the added value per employee. However, for the Chilean case, Alvarez, Bravo-Ortega, & Navarro (2010) found no effect of product innovation on productivity but a positive effect of process innovation. The authors highlight a failure of R&D to significantly improve innovation outcomes and productivity in developing countries. This could explained by the fact that R&D investment is in many cases prohibitive (both in terms of the financial costs and the human capital needed) and, due to its cumulative effects, it could require longer time horizons to demonstrate results.
The effect of innovation on productivity will be different depending on the degree of novelty of the innovation (Fazlıoğlu et al., 2018). New products/processes are expected to increase productivity to a larger extent than significantly improved products or processes. However, the empirical evidence is mixed. On the one hand, Guisado-González, Vila-Alonso, & Guisado-Tato (2016) and Duguet (2001) show that radical innovation has a positive effect whereas incremental innovation is not significant. On the other hand, Fazlıoğlu et al. (2018) show that the productivity gain of radical innovation, conceived as new to the market, is lower for firms that engage in this type of innovation than the productivity gain for firms that do not radically innovate.
Regarding product innovation, the introduction of a new product can improve productivity since the new source of demand can generate economies of scale in the production. New products satisfy an immediate or latent need so the demand exists (Hall et al., 2009; Mairesse & Robin, 2009). As for process innovation, a positive effect on productivity occurs since it is directly related to both the reduction of costs or delivery as well as to quality improvement (Parisi et al., 2006). If an innovating firm operates in the elastic part of the demand curve, a reduction of prices can increase sales more than proportionally and in turn, productivity increases (Chudnovsky et al., 2006; Crowley & Mccann, 2015; Masso & Vahter, 2008; Mohnen & Hall, 2013). The studies considering both types of innovation show mixed results. Some studies indicate a stronger effect of process innovation (Adriana Cassoni & Ramada-Sarasola, 2010; Hall et al., 2009; Schwab, 2009) whereas other studies show a stronger effect of product innovation as concluded from a large sample of studies analyzed by Hall (2011) and Mohnen & Hall (2013). Organizational innovation can lead to a positive effect on productivity as it focuses on process and equipment renovation, information management and collaboration within the firm (Masso & Vahter, 2008; Piva & Vivarelli, 2002). Marketing innovation focuses on customer needs, or simply on the new positioning of a company's product in the market so the implementation of a new marketing method can impact productivity through its complementary relationship with other types of innovation (Mohnen & Hall, 2013). These non-technological innovations, organizational and marketing, have lower effects than technological innovations, product and process (Fazlıoğlu et al., 2018; Greenan & Guellec, 1998).
Data and Methodology
The Science, Technology and Innovation Activity survey (STIA, 2011, 2014) in the editions of 2011 and 2014 are used. This survey accounts for information from 7,055 firms for 2014 and 2,815 firms for 2011. After dropping missing data, a pooled data of 7,957 observations is used; 1,744 from the 2011 edition and 6,213 from the 2014 edition.
3.1. Dependent Variables
As aforementioned, the switching endogenous model consists of an estimation of two simultaneous equations. In our setting, six endogenous switching models for six innovation variables are estimated, considering the type and the novelty of innovations. In the first equations, the six dependent variables are dichotomous that take the value of 1 if the firm
innovated in: 1) new product, 2) significantly improved product, 3) new process, 4) significantly improved process, 5) new forms of organization and 6) marketing that includes new methods of distribution or sales. In the second equation, the dependent variable for all six models is labor productivity.
The dependent variable of innovation obtained from the STIA survey follows the OSLO manual definition. It is defined as the introduction of new or improved products or processes that differ significantly from the unit’s previous products and processes. In this study, the novelty of products is given by its characteristic of new product or significantly improved product. This novelty definition is different from that of Fazlıoğlu et al., (2018), who analyze novelty by the environment to which a product is novel, to the firm or to the market. The first type of novelty is chosen because in Ecuador a significantly improved product or process is a big step of innovation.
Regarding our data from 7,957 firms, 14% introduce new products while 28% improve products that already exist. Likewise, 13% design new processes while 23% improve existing processes. Additionally, 26% of firms innovate in organization and 22% innovate in marketing. It is worth noting that the types of innovation are not mutually exclusive, i.e. a firm could innovate in more than one type of innovation. The labor productivity of firms is on average US$ 306,804.
Appendix A shows the mean statistic for these variables between innovating and non-innovating firms with the corresponding difference test. Here, some key features that explain these Ecuadorian firms’ decision to innovate are identified. For example, innovating firms are more intensive in capital, either human, physical or foreign, than non-innovating firms. The proportion of innovating firms that sell their products abroad and work through corporate groups is larger than those of non-innovating firms. Innovating firms are larger and have more years in the market than non-innovating ones. In addition, a larger proportion of innovating firms have conducted market analysis, training and consulting activities than non-innovating firms. Interestingly, innovating firms record a lower labor productivity than non-innovating firms. One possible reason for this is the higher number of workers present in innovating firms. However, it should be recalled that this difference and all those mentioned above are illustrative and could be unbiased due to the non-randomness of the sample.
3.2. Model Specification
[Para la comprensión de este apartado es necesario consultar el artículo en PDF por la inclusión de símbolos matemáticos en la explicación, que no están en esta versión.]
Results
Table 1 shows the results of productivity of the endogenous switching model[4] for innovative firms, by types of innovation, in columns (1)–(6) and non-innovative firms in columns (7)-(12). It is worth noting that these results show correlational relationships. Comparisons between innovating and non-innovating firms cannot be done since the samples of firms are not mutually exclusive. For instance, a firm that innovates in products could also innovate in other types of innovation and a firm that do not innovate in products could innovate in other types of innovation.
The results show that a 1% increase in human capital has a productivity improvement effect in innovating firms between 50% and 99.9% depending on the segment of innovation. Workers with high levels of education have abilities and knowledge to develop more efficient process and products (Alderete, M; Gutiérrez, 2012; Yang et al., 2010; Yunus et al., 2014). Productivity increases of non-innovating firms range between 102.7% and 118.2% if human capital grows by 1%. This can be explained by diminishing marginal effects. As shown in the descriptive statistics of Appendix A, non-innovating firms have lower levels of human capital, so due to decreasing marginal returns, a 1% increase in human capital has a larger productivity effect than in innovating firms where human capital is larger. The same occurs with the intensity of innovation. Firms that engage in innovation of new products and new processes obtain less productivity gains than firms that engage in innovation of significantly improved products and processes.
The productivity effect of fixed capital ranges between 2% and 3.6%. The investment in capital increases the productivity as its aim is to increase the efficiency of the production process in terms of time, operation costs and labor costs (Benavente, 2005). The effect of fixed capital is also significant for non-innovating firms, which shows that this type of investment generates positive productivity returns regardless whether a firm innovates or not. On average, the productivity effect of having foreign capital for innovating firms is 43.4% whereas for non-innovating firms, it is 34.1%. This shows that technology can be internalized in innovating firms (Alderete M, Gutiérrez L, 2012; Chong-Sup, 1997). By contrast, expenditures on machinery and equipment have a negative effect on labor productivity. A priori, a positive effect was expected as this type of investment can reduce labor cost, reduce time process and, consequently, improve productivity (Ludym et al., 2018). One possible reason for this result is the high proportion of firms that belong to the service sector in Ecuador. These firms may not need to invest large amounts in machinery or equipment, but in other specialized resources (e.g. training).
The age of firms has a positive and significant effect on the labor productivity. As firms mature, they are more productive, possibly due to the experience and learning acquired over time. According to Crowley & McCann (2018), older firms that innovate in services are less productive in transition economies.
The operation in multiplant organization improves the level of productivity of firms. Among innovating firms, larger effects of multiplant for firms that innovate in products (19.7%) and significantly improve in process (13.1%) are obtained. In these types of innovation, a decentralized production that splits the production process in phases and localizes in favorable places can be more efficient (Crowley & Mccann, 2015; Rosales, 2018).
Belonging to a corporate group increases the productivity of innovating firms and non- innovating firms. This effect is very similar among innovating firms and among non-innovating firms which shows that the network of firms is a key element for any firm (Amsden & Hikino, 1994; Khanna & Yafeh, 2007), regardless if it innovates or not. Regarding the types of industries, as expected, the retail and wholesale industries have better performance than the other industries (Bachmann, 2016; Crowley & Mccann, 2015), considering both samples: innovating and non-innovating firms.
Regarding agglomeration economies, diversity economies have a significant effect on firms that innovate in products and in marketing. This result is in line with Frenken et al. (2007), who stated that the exchange and complementarity of different technologies and knowledge types might boost the innovation of products. The effect of specialization is negative for the productivity of non-innovating firms, which could indicate that knowledge is protected and cannot be transferred in concentrations of firms of the same industry. The competition has a strong positive effect on the productivity of innovating firms that improve significantly products and process and innovate in marketing. Competition intensity is inducing these firms to innovate and develop better production processes to be more efficient so they can stay in the market (Porter, 1980; Porter 1990; Tang, 2006). It is worth noting that competition externalities also benefit non-innovating firms. As for diversity externalities, they have a non-significant effect on both non-innovating and innovating firms, except for a significant effect on the productivity of firms that innovate in products. This result is in line with Frenken et al. (2007), who stated that the exchange and complementarity of different technologies and knowledge types might boost the innovation of products. Finally, density economies have a significant effect on all non-innovating firms, increasing their productivity by 2% and 3%. In densely populated zones, the great availability of labor force, infrastructure and public goods and services can make these firms more productive (Guevara et al., 2018; Harrison et al., 1996; Isard, 1956). The non-significant effect of density economies for innovating firms indicates that agglomeration of innovating and non-innovating firms does not favor the former. Perhaps, the agglomeration of only innovating firms is need.
Table 1.
Estimation of Productivity for Innovating and Non-innovating Firms
| Dependent variable | 1 | 2 | 3 | 4 | 5 | 6 | 7 | 8 | 9 | 10 | 11 | 12 |
| Labor productivity | Firms that innovate in products | Firms that significantly improve products | Firms that innovate in process | Firms that significantly improve process | Firms that innovate in organization | Firms that innovate in marketing | Firms that do not innovate in products | Firms that do not significantly improve products | Firms that do not innovate in process | Firms that do not significantly improve process | Firms that do not innovate in organization | Firms that do not innovate in marketing |
| Human capital | 0,50*** | 0,823*** | 0,650*** | 0,999*** | 0,895*** | 0,841*** | 1,033*** | 1,055*** | 1,082*** | 1,027*** | 1,084*** | 1,182*** |
| (0,124 | (0,10) | (0,1207) | (0,092) | (0,088) | (0,106) | (0,052) | (0,053) | (0,05055) | (0,053) | (0,057) | (0,06) | |
| Ln. Fixed capital | 0,0246*** | 0,0305*** | 0,0256** | 0,0364*** | 0,0206*** | 0,0208*** | 0,0211*** | 0,0181*** | 0,0199*** | 0,0135*** | 0,0218*** | 0,0310*** |
| (0,0065) | (0,006) | (0,0080) | (0,0057) | (0,0051) | (0,006) | (0,0025) | (0 0026) | (0,0025) | (0,0027) | (0,00309) | (0,003) | |
| Machinery and equip. | -0,315** | -0,216** | -0,162 | -0,157 | -0,209*** | -0,194** | -0,339*** | -0,334*** | -0,361*** | -0,518*** | -0,181*** | -0,0403 |
| (0,098) | (0,79) | (0,11) | (0,090) | (0,061) | (0,07) | (0,042) | (0,045) | (0,0394) | (0,057) | (0,0457) | (0,042) | |
| Age | 0,0054*** | 0,00687*** | 0,00830** | 0,00745*** | 0,00750*** | 0,00634*** | 0,00453*** | 0,00372*** | 0,00421*** | 0,00366*** | 0,00413** | 0,00433*** |
| (0,0017) | (0,001) | (0,0019) | (0,001) | (0,0014) | (0,0015) | (0,00094) | (0,00098) | (0,0009) | (0,0009) | (0,001) | (0,0009) | |
| Multiplant | 0,197** | 0,0751 | 0,0889 | 0,131** | 0,0986* | 0,0747 | 0,059* | 0,0990*** | 0,104*** | 0,108*** | 0,103** | 0,125*** |
| (0,062) | (0,54) | (0,0644) | (0,05) | (0,048) | (0,052) | (0,029) | (0,030) | (0,0289) | (0,031) | (0,031) | (0,03) | |
| Foreign capital | 0,459*** | 0,446*** | 0,462*** | 0,396*** | 0,488*** | 0,354*** | 0,391*** | 0,417*** | 0,369*** | 0,448*** | 0,408*** | 0,355*** |
| (0,096) | (0,085) | (0,0939) | (0,083) | (0,084) | (0,1) | (0,0498) | (0,050) | (0,0500) | (0,052) | (0,0532) | (0,053) | |
| Corporate group | 0,298*** | 0,244*** | 0,278*** | 0,286*** | 0,247*** | 0,250*** | 0,312*** | 0,317*** | 0,295*** | 0,305*** | 0,332*** | 0,350*** |
| (0,079) | (0,068) | (0,080) | (0,064) | (0,061) | (0,067) | (0,0387) | (0,039) | (0,0387) | (0,041) | (0,0418) | (0,041) | |
| Wholesale and retail | 1,185*** | 1,154*** | 1,146*** | 1,165*** | 1,264*** | 1,232*** | 1,336*** | 1,356*** | 1,281*** | 1,309*** | 1,290*** | 1,353*** |
| (0,119) | (0,103) | (0,0887) | (0,069) | (0,0574) | (0,07) | (0,0340) | (0,034) | (0,0333) | (0,035) | (0,036) | (0,04) | |
| Mining and quarrying | 0,143 | 0,200 | 0,212 | -0,272 | -0,364* | -0,192 | -0,119 | -0,142 | -0,169 | -0,0984 | -0,121 | -0,195* |
| (0,232) | (0,21) | (0,234) | (0,17) | (0,1568) | (0,22) | (0,086) | (0,088) | (0,0863) | (0,091) | (0,092) | (0,09) |
Table 1. cont.
Estimation of Productivity for Innovating and Non-innovating Firms
| Dependent variable | 1 | 2 | 3 | 4 | 5 | 6 | 7 | 8 | 9 | 10 | 11 | 12 |
| Labor productivity | Firms that innovate in products | Firms that significantly improve products | Firms that innovate in process | Firms that significantly improve process | Firms that innovate in organization | Firms that innovate in marketing | Firms that do not innovate in products | Firms that do not significantly improve products | Firms that do not innovate in process | Firms that do not significantly improve process | Firms that do not innovate in organization | Firms that do not innovate in marketing |
| Manufacturing | 0,163* | 0,393*** | 0,275*** | 0,391*** | 0,423*** | 0,325*** | 0,345*** | 0,327*** | 0,322*** | 0,308*** | 0,343*** | 0,365*** |
| (0,074) | (0,063) | (0,0827) | (0,06) | (0,065) | (0,065) | (0,035) | (0,036) | (0,0351) | (0,037) | (0,038) | (0,04) | |
| Specialization | -0,0500 | -0,0567 | 0,0167 | -0,0568 | -0,0473 | 0,0632 | -0,101*** | -0,0631* | -0,0870*** | -0,0840** | -0,0959** | -0,104*** |
| (0,0481) | (0,080) | (0,0583) | (0,046) | (0,039) | (0,066) | (0,026) | (0,24) | (0,0252) | (0,026) | (0,029) | (0,025) | |
| Competition | 0,617 | 1,314*** | 0,524 | 1,163*** | 0,399 | 1,064*** | 0,555*** | 0,587*** | 0,572*** | 0,451** | 0,699*** | 0,208 |
| (0,336) | (0,28) | (0,351) | (0,25) | (0,281) | (0,3) | (0,152) | (0,15) | (0,1512) | (0,16) | (0,160) | (0,17) | |
| Density | 0,0081 | -0,00165 | 0,0137 | -0,0109 | 0,0185 | 0,00235 | 0,0260*** | 0,0165* | 0,0223** | 0,0300*** | 0,0228** | 0,0381*** |
| (0,015) | (0,013) | (0,0156) | (0,011) | (0,0134) | (0,013) | (0,0074) | (0,007) | (0,0074) | (0,008) | (0,0079) | (0,008) | |
| Diversity | 0,200* | -0,0468 | 0,132 | 0,0660 | 0,0795 | 0,187** | 0,00738 | 0,0511 | 0,0217 | 0,0322 | 0,0264 | 0,00263 |
| (0,089) | -0,079 | (0,0977) | (0,073) | (0,061) | (0,07) | (0,0377) | (0,038) | (0,0373) | (0,039) | (0,0415) | (0,04) | |
| Year 2014 | 0,666*** | 0,760*** | 0,749*** | 0,664*** | 0,686*** | 0,774*** | 0,794*** | 0,842*** | 0,782*** | 0,853*** | 0,757*** | 0,780*** |
| (0,068) | (0,060) | (0,0749) | (0,055) | (0,0648) | (0,06) | (0,0334) | (0,035) | (0,033) | (0,035) | (0,036) | (0,03) | |
| Constant | 9,624*** | 9,214*** | 9,042*** | 8,814*** | 9,205*** | 8,995*** | 8,898*** | 8,774*** | 8,889*** | 8,827*** | 8,794*** | 9,074*** |
| (0,323) | (0,27) | (0,376) | (0,24) | (0,2561) | (0,28) | (0,093) | (0,096) | (0,092) | (0,098) | (0,1024) | (0,11) | |
| N. observations | 1073 | 1422 | 983 | 1789 | 2046 | 1658 | 6513 | 6157 | 6600 | 5790 | 5538 | 5929 |
| Wald Chi2 | 31,50 | 24,27 | 30,34 | 22,61 | 7,98 | 11,44 | 31,50 | 24,27 | 30,34 | 22,61 | 7,98 | 11,44 |
| p-value | 0,0000 | 0,0000 | 0,0000 | 0,0000 | 0,0047 | 0,0007 | 0,0000 | 0,0000 | 0,0000 | 0,0000 | 0,0047 | 0,0007 |
| Log Likelihood | -13032 | -13334,476 | -12902,97 | -13619,503 | -14698,49 | -14307,7 | -13032 | -13334,476 | -12902,97 | -13619,503 | -14698,49 | -14307,7 |
The significance of the coefficients is represented by: ***p<0,01, **p<0,05, *p<0,10. The standard errors are in parentheses.
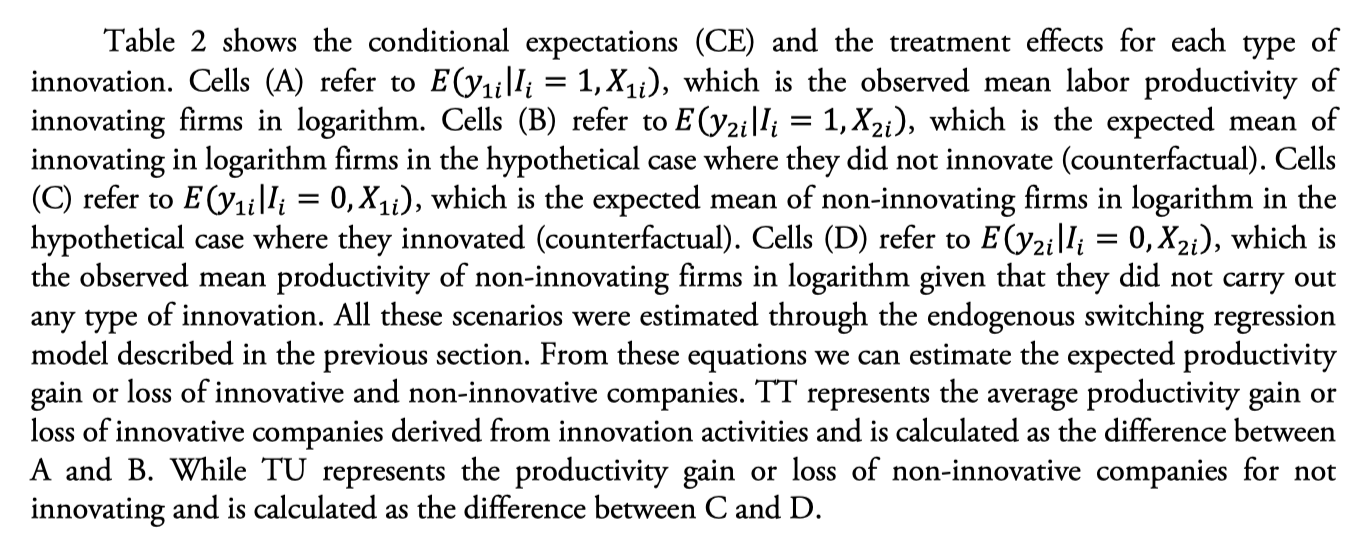
According to the observed outcomes, the average labor productivity of firms that did innovate in new products is 10.77 and the labor productivity of firms that did not innovate in new products is also 10.77. This result is quite surprising since one can expect that the productivity of innovating firms would be higher as in the case of Turkish firms (Fazlıoğlu et al. 2018). Perhaps, these results could change if the size of firms is taken into account. In addition, it is worth noting that the counterfactual scenarios in which innovating firms did not innovate show a lower labor productivity (9.78). As result, the TT effect (A-B) shows that when innovating firms innovate in new products, their productivities increase by 99% with respect to the counterfactual of not innovating. Put differently, if innovating firms did not innovate in new products, they would lose 99% of productivity. As innovation in products can create and expand new demand sources, the decision to not innovate would entail the loss of these opportunities (Hall et al., 2009; Mairesse & Robin, 2009). Likewise, if non-innovating firms had innovated, they would obtain a higher level of labor productivity (11.60). Thus, the TU effect (C-D) shows that if they had innovated in new products, they would have experienced an increase of 83% in their productivities. Even though the productivity level is similar for innovating and non-innovating firms, what matters is the gains or losses in productivity that they can obtain if they innovate and stop innovating, respectively.
Regarding the effect of significantly improved products, the expected labor productivity of innovating firms is lower (10.6) than the labor productivity of non-innovating firms (10.82). However, the TT effecshows that if innovating firms did not innovate, they would lose 77% of labor productivity, 22 percentage points less than the loss from stopping new innovation. The TU effect shows that if non-innovating firms would significantly improve their products, theu would have an increase of labor productivity of 25%.
Table 2.
Conditional Expectations (CE) and Treatment Effects of each type of Innovation
| CE if firm innovates | CE if firm does not innovate | Treatment effects | |
| New innovation in products | |||
| Firms that innovated | (A) 10,77 | (B) 9,78 | TT= 0,99*** |
| Firms that did not innovate | (C) 11,60 | (D) 10,77 | TU=0,83*** |
| Significantly improved innovation in products | |||
| Firms that innovated | (A) 10,60 | (B) 9,83 | TT= 0,77*** |
| Firms that did not innovate | (C) 11,07 | (D) 10,82 | TU=0,25*** |
| New innovation in process | |||
| Firms that innovated | (A) 10,92 | (B) 9,80 | TT= 1,12*** |
| Firms that did not innovate | (C) 11,03 | (D) 10,75 | TU=0,28*** |
Table 2. cont.
Conditional Expectations (CE) and Treatment Effects of each type of Innovation
| CE if firm innovates | CE if firm does not innovate | Treatment effects | |
| Significantly improved innovation in process | |||
| Firms that innovated | (A) 10,75 | (B) 9,81 | TT= 0,94*** |
| Firms that did not innovate | (C) 10,78 | (D) 10,79 | TU=-0,01*** |
| Organizational innovation | |||
| Firms that innovated | (A) 10,90 | (B) 10,35 | TT= 0,55*** |
| Firms that did not innovate | (C) 11,09 | (D) 10,73 | TU=0,36*** |
| Marketing innovation | |||
| Firms that innovated | (A) 10,85 | (B) 11,70 | TT= -0,85*** |
| Firms that did not innovate | (C) 11,37 | (D) 10,75 | TU=0,62*** |
The significance of the treatment effects is represented by: ***p<0.01, **p<0.05, *p<0.10.
(A), (B), (C) and (D) are the conditional expectations (CE) for firm’s productivity. (A) represent the CE of labor productivity for innovative firms, given that they innovated (observed). (B) represent the CE of labor productivity for innovative firms, if they had not innovated (counterfactual). (C) represent the conditional expectation of labor productivity for non-innovative firms, if they had not innovated (counterfactual). (D) represent the conditional expectation of labor productivity for non-innovative firm, given that they did not innovate (observed).
This productivity gain is much lower compared to the 83% productivity increase in engaging in innovation of new products. This result is explained by the fact that the introduction of new goods or services has a direct and more drastic expanding effect on the demand than the significantly improved products and processes innovations. Since the effect of the treatment on the treated (TT) is larger than the effect of the treatment on the untreated (TU) for both new and significantly improved innovation, the productivity loss is higher if they stop innovating in either new or significantly improved products than the productivity gain if they start innovating in products. These evidences are contrary to the findings of Crowley & Mccann (2015) and Fazlıoğlu et al. (2018) for Irish and Turkish firms, respectively, where TU effect is larger than TT effect for product innovation. The superior result of TU over TT in these economies could be explained by the cannibalization effect between new and old products (Mohnen & Hall, 2013). That is to say, that although the increase in demand for new and different products generates an increase in income and therefore an increase in productivity, it could at the same time be reducing the consumption of other products and causing a decrease in their productivity; therefore, the final positive effect of product innovation would be less or even zero. For non-innovative companies, the effects of innovating would only imply significant increases in their level of productivity due to the expansionary effect of demand. Only Crowley & McCann (2018) find similar results for manufacturing sectors in Transition-driven european economies with a greater TT effect.
Regarding innovation in process, the labor productivity of innovating firms is higher (10.92) than the labor productivity of non-innovating firms (10.75). The TT effecs indicates that innovating firms’ innovation in new process causes an increase of 112% in the firm’s productivity. This significant effect could be explained by the fact that innovation in process is devoted to reducing production and distribution costs and to increasing quality, which could result in price reductions that increase sales. It seems that the demand curve is elastic, such that sales increase more than proportionally to the reduction of prices, which leads to higher positive effects in productivity (Chudnovsky et al., 2006; Masso & Vahter, 2008; Mohnen & Hall, 2013). For non-innovating firms, if they had innovated in new processes by changing materials, techniques or information programs, their productivity would increase by 28%. Significant improvement of processes has a positive effect on innovating firms. Their productivity increases by 94%. Interestingly, for non-innovating firms, if they conduct significantly improved process innovations, no productivity gains are obtained. On the contrary, their productivity would reduce by 1%. Small modifications in process do not affect productivity but a process breakthrough can positively influence it. This result is in line with previous studies such as Duguet (2006), Guisado Gonzáles et al., (2015) and Crowley & McCann (2018) for Transition-driven european economies.
Similarly, the TT effect is larger than the TU effect for this type of innovation, indicating that much more is lost when innovating firms stop innovating in processes than what is gained if non-innovating firms innovate in this way. Moreover, if an innovating firm ceases to innovate in process, the negative effect is larger than that of discontinuing innovation in products or organization. This could be explained by the fact that process innovation has a long-term effect since it is applied in all the activities and operations of a firm, constantly, whereas innovation in products might have a momentary effect. Then, losing a long-term positive effect is more detrimental than losing a momentary positive effect. Crowley & Mccann (2015) confirms these findings for Irish firms. Likewise, Crowley & McCann (2018) shows a greater TT effect for both, Innovation-driven and Transition-driven European economies in manufacturing.
With respect to organization innovation, higher labor productivity is expected for innovating firms (10.9) than for non-innovating firms (10.73). Organizational innovation by innovating firms causes an increase of 55% in productivity (TT effect). Such increase could be the result of a renovation of organizational structures that improves the quality and flexibility of operations and, in turn, a reduction of administrative and transaction costs (Masso & Vahter, 2008; Piva & Vivarelli, 2002). This type of innovation can increase the productivity of non-innovating firms by 36% (TU effect). By contrast, Crowley & Mccann (2015) and Fazlıoğlu et al. (2018) obtained that the TU effect is greater than the TT effect. When Ecuadorian firms apply new and better management practicesmonetary savings could be at place.
Regarding marketing innovation, the labor productivity of firms that innovate in marketing is larger (10.85) than that of firms that do not innovate in marketing (10.75). Surprisingly, the counterfactual of innovating firms shows that if they had not innovated, their productivity would be 11.7. Therefore, a negative effect of 85% is obtained. A priori a positive effect was expected since if firms cease to innovate in marketing through strategic actions aimed at capturing more demand, productivity losses are likely. . However, innovation in marketing has a negative effect, this may be due to inefficiencies in the administration and management of resources that end up becoming a cost. Sok et al. (2017) in their study of business performance through marketing, find that the effect of this type of innovation is conditioned by the resources used in different edges related to the client, the product, the market. It is very likely that the marketing innovation activities of Ecuadorian companies are only focused on a single edge, in addition to the disconnection with the other areas of innovation causing inefficiency. As for non-innovating firms, the productivity effect of engaging in marketing innovation is an increase of 62%, which is in line with Fazlıoğlu et al. (2018), where the productivity of non-innovativing Turkish companies, if they had innovated, would generate an increase in their level of productivity. This increase in the level of productivity would occur thanks to the implementation of new sales and distribution methods, as well as design and packaging changes, which could lead to greater efficiency.
To sum up, treatment effects of innovation on innovating and non-innovating firms are positive and significant, except for the treatment effect on the untreated (TU) of significantly improved innovation in process and the treatment effect on the treated (TT) of marketing innovation, which are negative. This implies that for most types of innovation, if non-innovating firms had innovated, they would have had productivity gains. Contrarily, if innovating firms had not innovated, they would have experienced productivity losses. Moreover, for most types of innovation, the effect of the treatment (innovation) on the treated (innovating firms) is higher than the effect of the treatment (innovation) on the untreated (non-innovating firms). This indicates that the damage caused to innovating firms for ceasing to innovate is higher than the gain of starting innovation for non-innovating firms.
Conclusions
By means of an endogenous switching model, the causal effect of innovation on labor productivity is examined. This methodology allowed us to compare real productivities and expected productivities considering hypothetical situations of innovation. Thus, treatment effects are assessed. The treatment of innovation proves to be significant and positive for innovating firms (treated) and non-innovating firms (untreated). This result has two implications: i. engaging in innovation of either products (new or significantly improved), processes (new or significantly improved) and organization increases the productivity of non-innovating firms and ii. ceasing to innovate in these areas decreases the productivity of innovating firms. The second effect is larger than the first one, which indicates that the damage in productivity of ceasing to innovate is larger than the productivity gain of commencing innovation. This productivity damage is especially stronger when stopping innovation in new processes (112%) than when stopping innovation in products (99%), organization (55%) or marketing (-85%). This could be explained by the fact that process innovation has a long-term effect since it is constantly applied in all the activities and operations of a firm, whereas innovation in other areas might have a momentary effect. Then, losing a long-term positive effect is more detrimental than losing a momentary positive effect. Moreover, product innovation by non-innovating firms increases productivity at the highest rate (83%) as compared to innovation in processes (28%), organization (36%) and marketing (62%). Regarding the novelty of innovations, new products and new processes are key strategies that firms should conduct to increase their productivity. Significantly improved products lead to lower positive effects whereas for significantly improved processes, no productivity effect exists.
These findings show that while innovating firms obtain productivity gains from innovation, non-innovating firms have productivity losses from not innovating. The innovation process should start with innovation in products, which generates higher productivity gains for these firms, and then incentives for innovation in process are necessary so that firms can sustain productivity gains. Moreover, incentives for innovating firms must continue so they do not experience productivity losses from ceasing to innovate. In particular, policies that promote innovation in processes should be maintained, either by introducing or improving the technology, software, and methods for supplying and delivering products in order to avoid significant productivity reductions. Likewise, firms have to engage in new innovations of products and specifically in new processes to obtain positive productivity effects. Other productivity factors, apart from innovation, have to be reinforced. Human capital is a key element in improving the productivity of firms as well as foreign capital through FDI. In this regard, it would be necessary to create and reinforce tax benefits. In Ecuador, firms have additional 100% deductions of training expenses aimed to research, development and technological innovation in the income tax. However, only 377 out of around 800,000 firms have taken advantage of this tax benefit in 2019 (Servicio de Rentas Internas, 2021), possibly due to ignorance of the law by taxpayers or because this benefit does not really encourage innovation in firms. So, it is recomnended to evaluate the effectiveness of current incentives, inform taxpayers the existence of these incentives, and establish other ones in order to promote innovation for more firms. For example, the government of India set up the exemption of income tax for 3 years to boost innovation in firms (India Brand Equity Foundation, 2021). In addition, these policies could be accompanied with financial programs, like soft loans with low interest rates and longer payments terms, to support high-risk innovations with high profitability potential.
Likewise, it would be useful to stimulate the formation and participation in corporate groups in order to generate alliances through which new knowledge can be disseminated among firms. According to Dini & Stumpo (2011), the generation of associative practices between firms in the same sector (i.e. horizontal networks) represents an effective method to stimulate innovations in small firms. Here, the associative work between firms generates the adoption of standards in the production process, management models and quality control systems, which allows firms to expand their competitive possibilities. One successful experience is the case of Chile, where it has been possible to adopt productive and marketing technologies in the wine industry through the participation in horizontal networks. Additionaly, the Technology Consortiums (TC) deserve special attention, which represents agreements between firms, the public sector, research institutions, laboratories and universities at the local level. According to Álvarez et al. (2010), these kind of agreements have improved the access to technological knowledge, the access to knowledge in other areas (marketing, international markets, trained personal, etc), and the development of joint technological projects between firms in Argentina, Chile, Colombia and Uruguay.
While this study contributes to the existent literature on the causal effect of types of innovation on productivity, it has some limitations. First, results are focused on firms in general. Further research would be addressed to specific types of firms, by sector or by size. Regarding the results of agglomeration economies, it would be interesting to test the effect of agglomeration economies that come from innovating firms and non-innovating firms.
Appendices
Appendix A. Mean Differences between Innovative and Noninnovative Firms
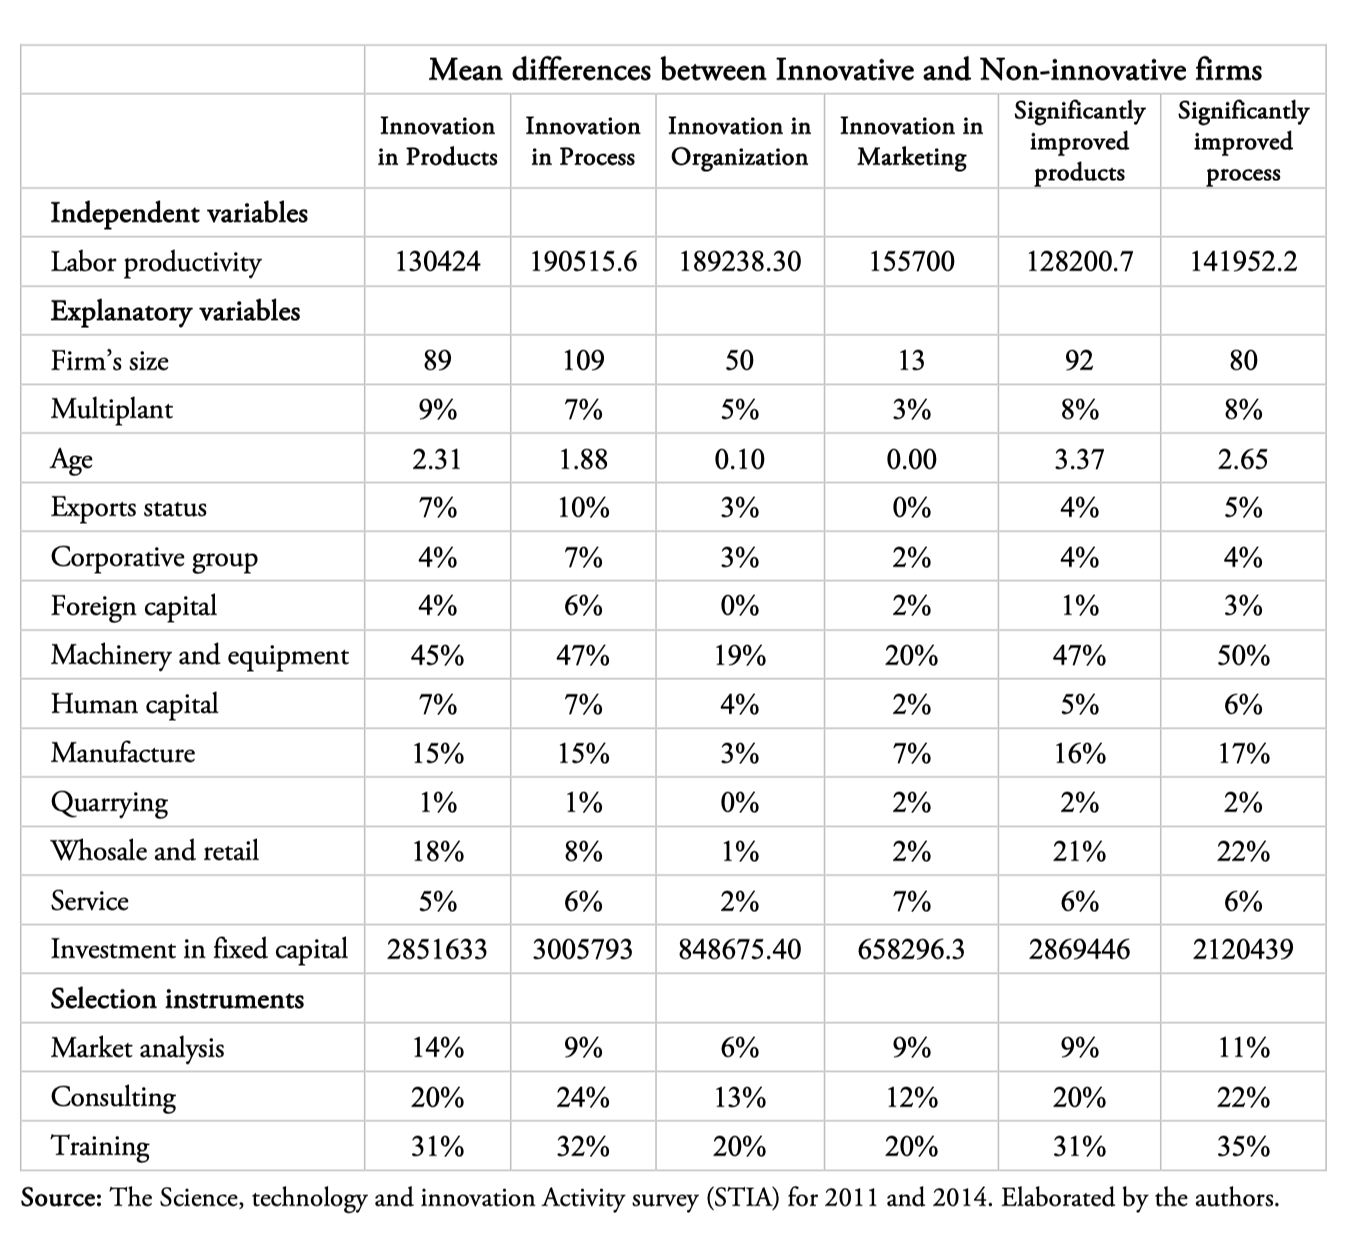
Source: The Science, technology and innovation Activity survey (STIA) for 2011 and 2014. Elaborated by the authors.
Appendix B. Explicative Variables and Expected Results According to Literature
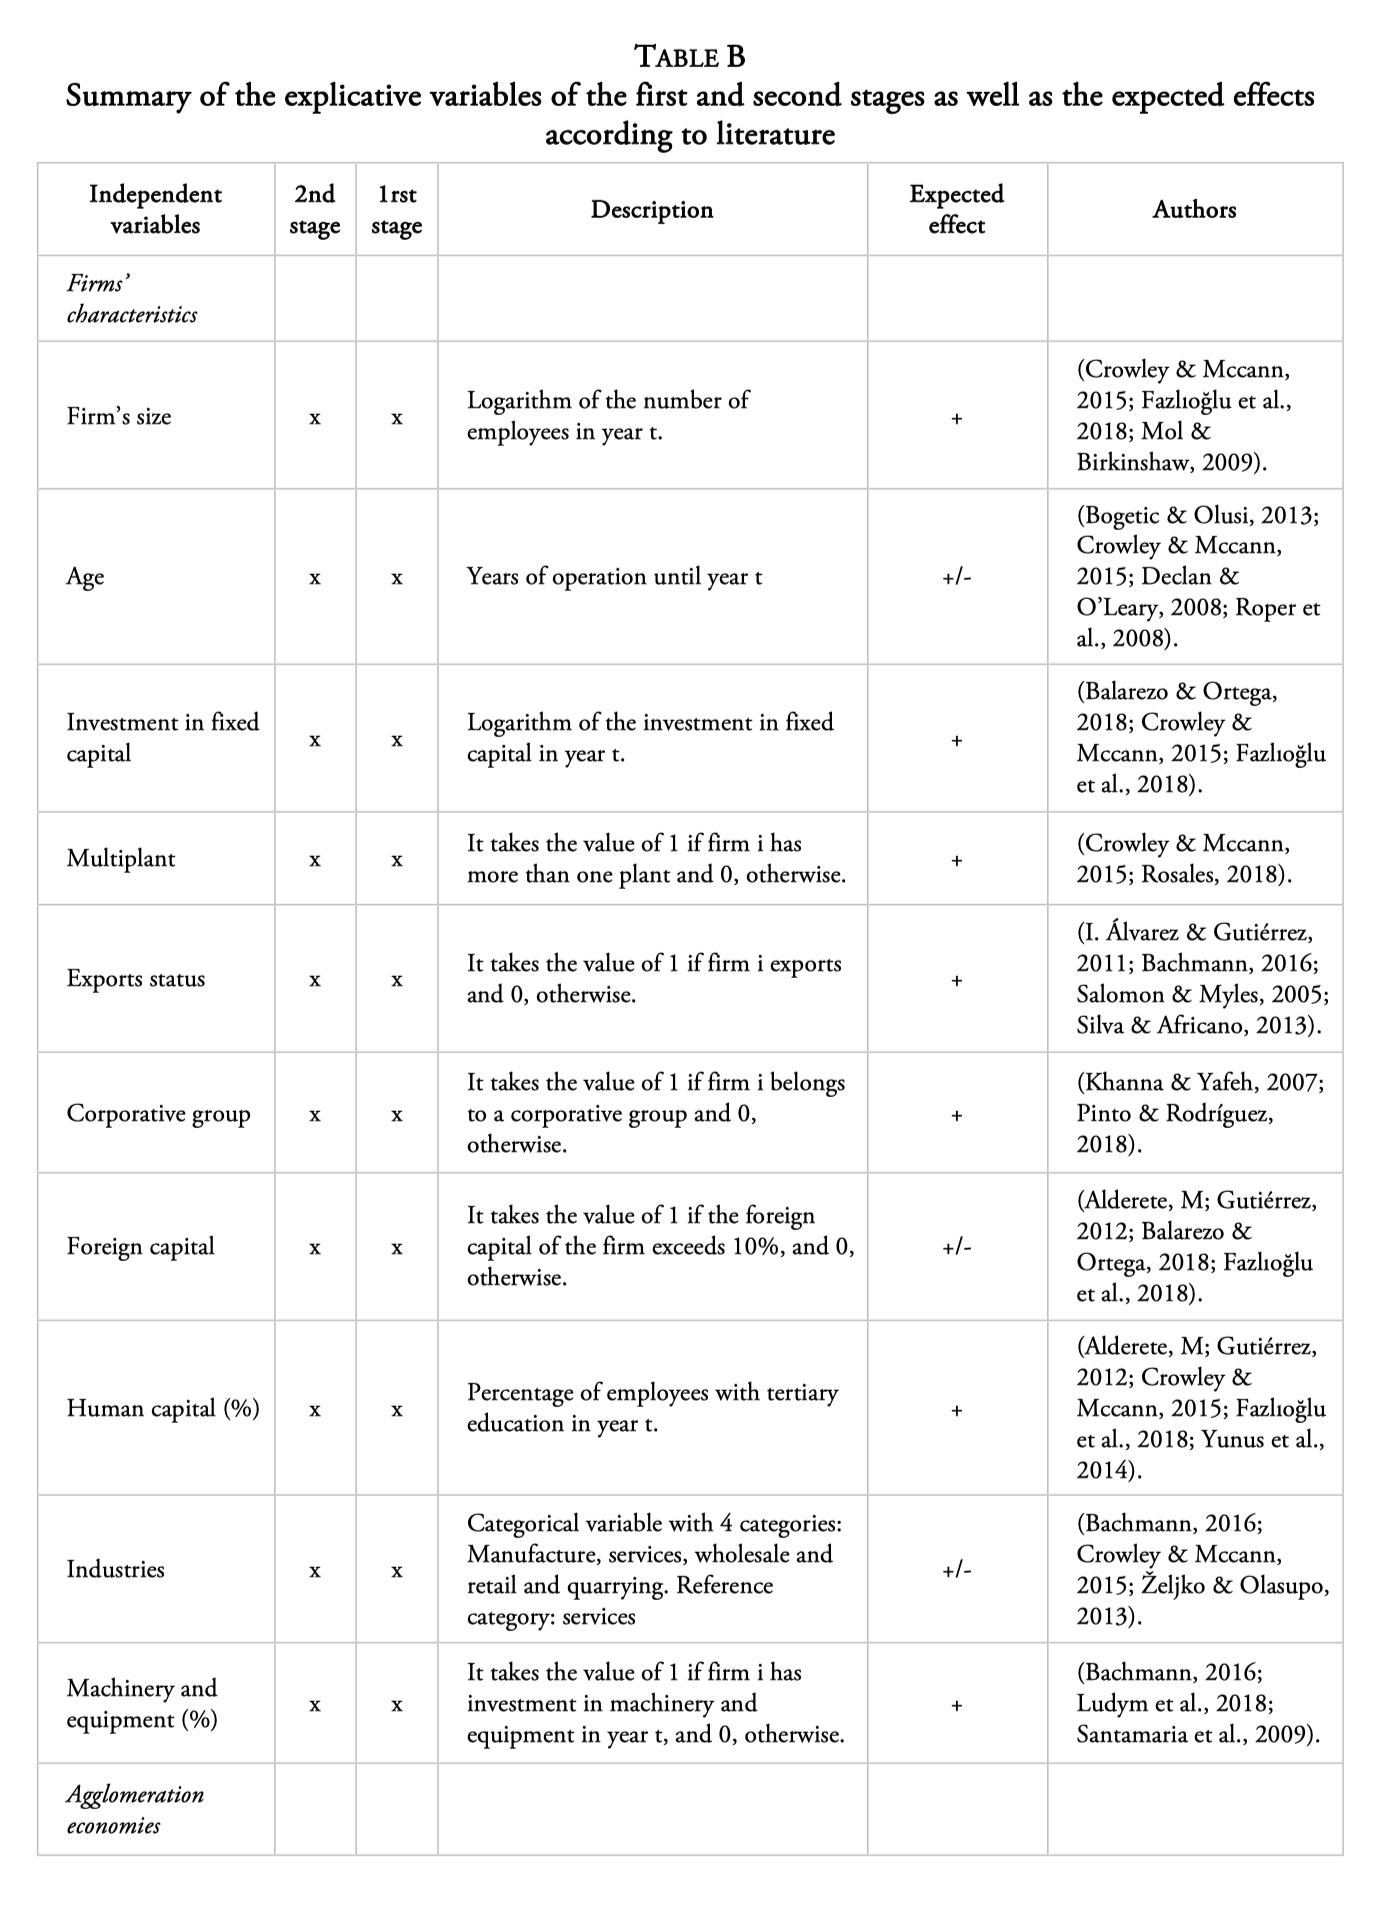
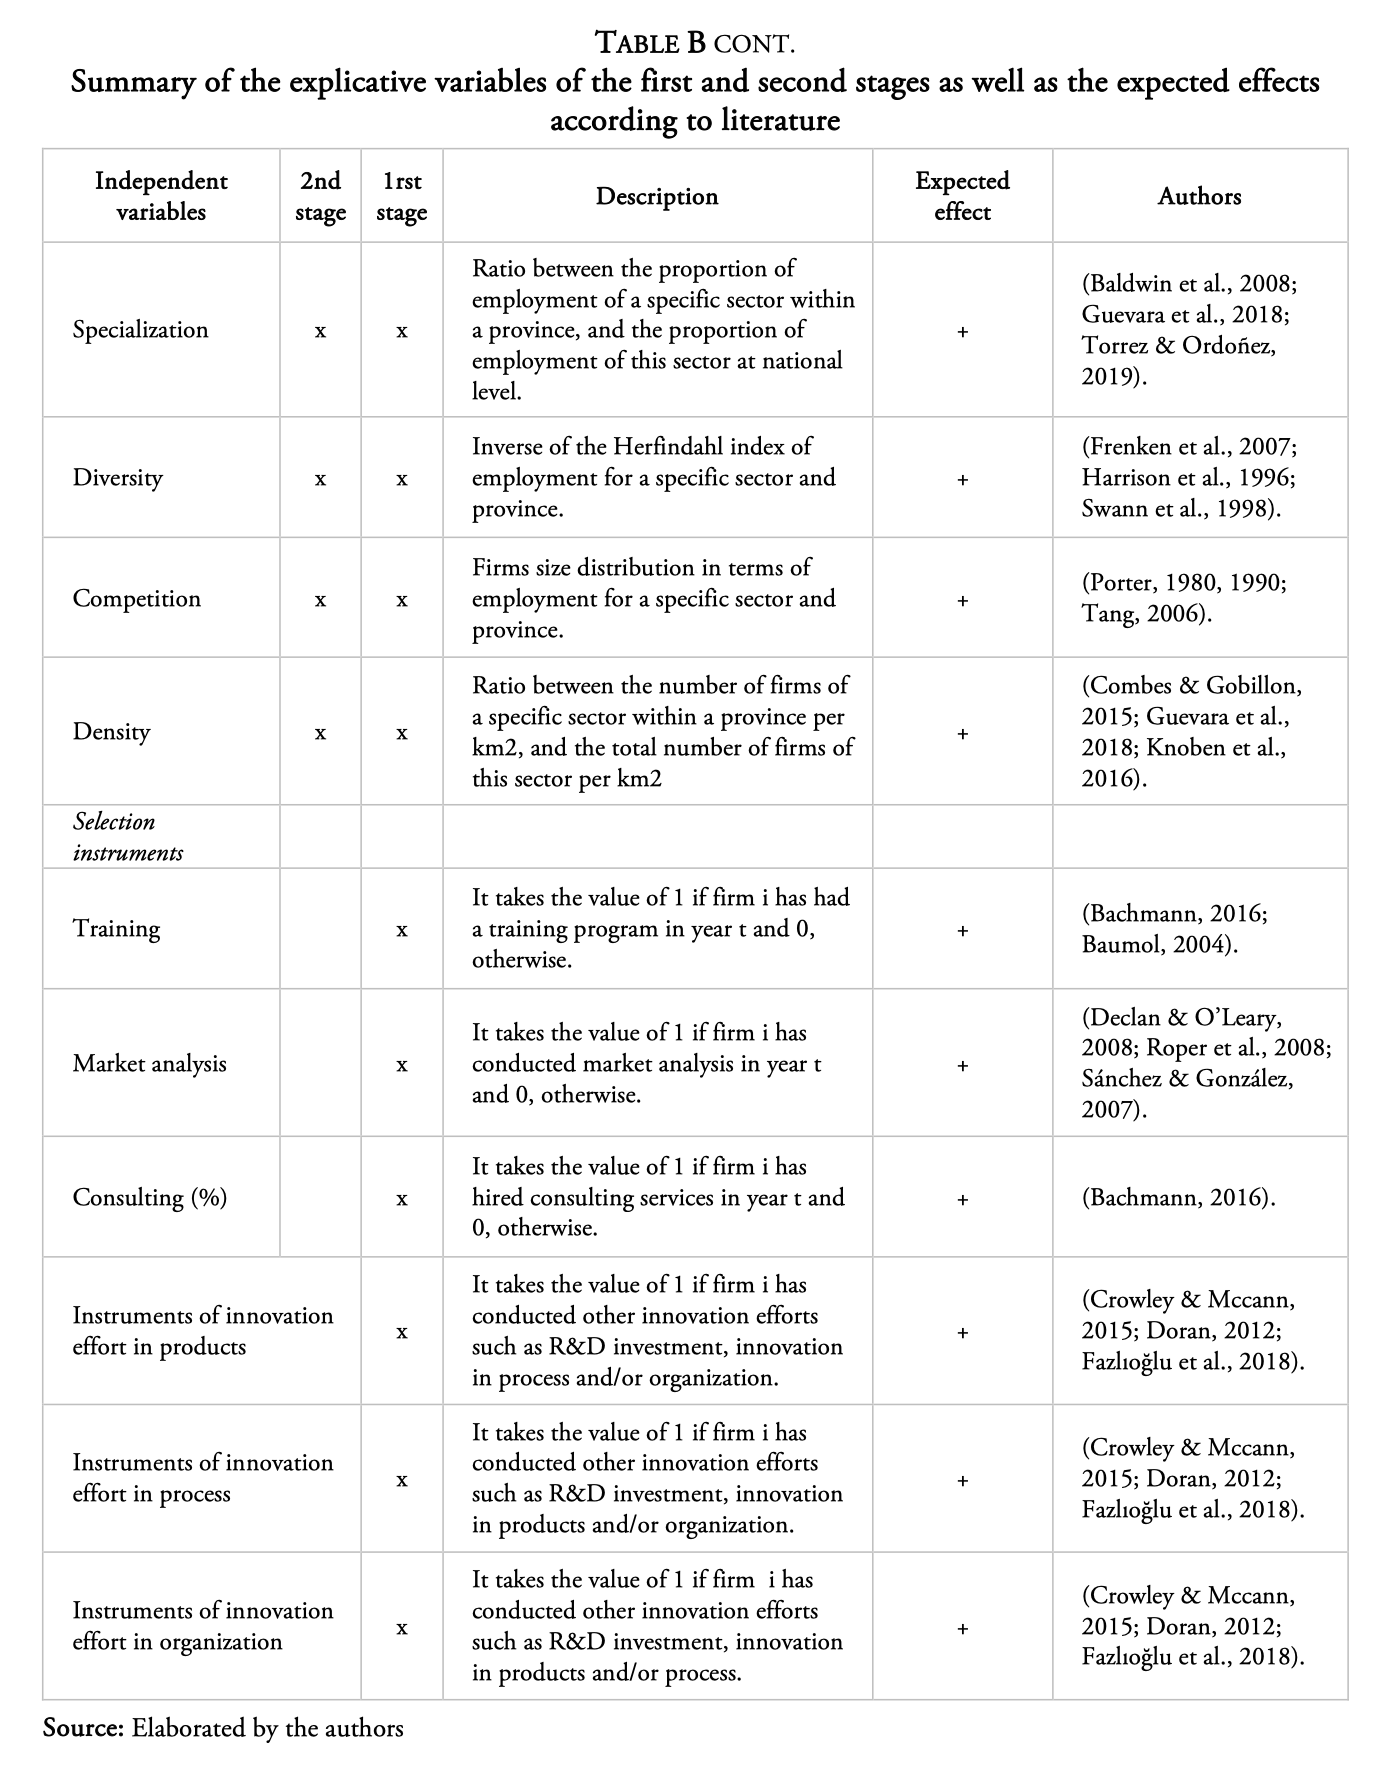
Source: Elaborated by the authors
Appendix C. Multivariate Probit Estimation
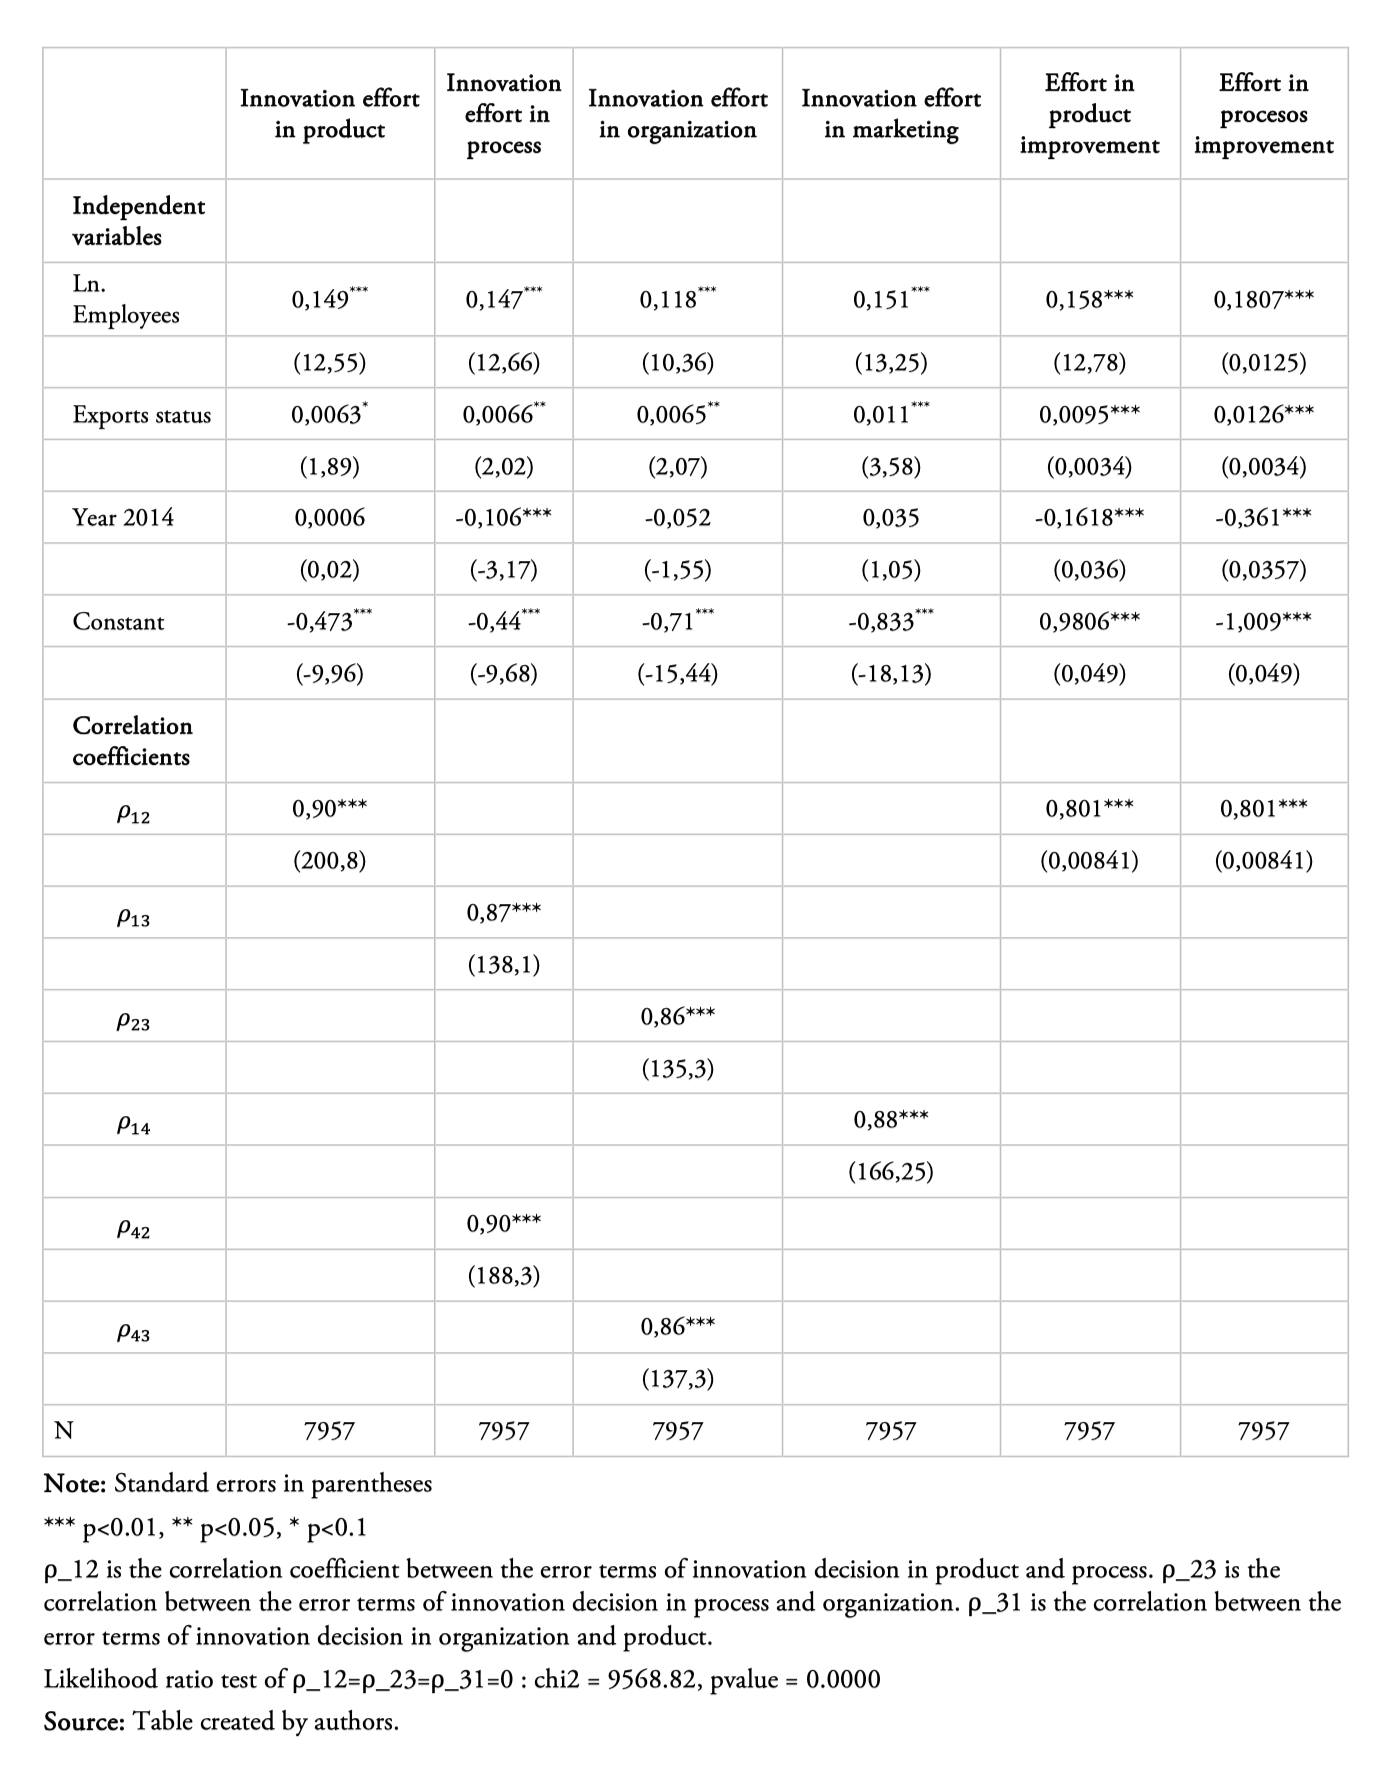
Source: Table created by authors.
Note: Standard errors in parentheses *** p<0.01, ** p<0.05, * p<0.1 ρ_12 is the correlation coefficient between the error terms of innovation decision in product and process. ρ_23 is the correlation between the error terms of innovation decision in process and organization. ρ_31 is the correlation between the error terms of innovation decision in organization and product.Likelihood ratio test of ρ_12=ρ_23=ρ_31=0 : chi2 = 9568.82, pvalue = 0.0000
References
Alderete, M., & Gutiérrez, L. (2012). TIC y productividad en las industrias de servicios en Colombia. Scielo, Lectura de Economía Medellín, 77, 163–188.
Álvarez, I., & Gutiérrez, C. (2011). Factores determinantes de la productividad en la industria española de bienes de equipo. Intituto Complutense de Estudios, Madrid., 1–22.
Álvarez, R., Benavente, J.M., Contreras, C., & Contreras, J. L. (2010). Consorcios Tecnológicos en América Latina: Una primera exploración de los casos de Argentina, Chile, Colombia y Uruguay.
Alvarez, R., Bravo-Ortega, C., & Navarro, L. (2010). Innovation, R&D Investment and Productivity in Chile. SSRN Electronic Journal. https://doi.org/10.2139/ssrn.1818741
Amsden, A., & Hikino, T. (1994). Project execution capability, organizational know-how and conglomerate corporate growth in late industrialization. Industrial and Corporate Change, 3, 111--148.
Bachmann, F. (2016). Los determinates de la innovación: un aporte para la industria argentina. Universidad Nacional de Mar Del Plata, Argentina.
Balarezo, D., & Ortega, M. (2018). Efecto de la cooperación en actividades de innovación sobre la inversión en innovación y el desempeño innovador de las empresas del Ecuador. Evidencia empírica 2012 – 2014. Universidad de Cuenca, Ecuador.
Baldwin, J., Brown, M., & Rigby, D. (2008). Agglomeration Economies: Microdata Panel Estimates from Canadian Manufacturing. Journal of Regional Science, 50(5) https://doi.org.10.1111/j.1467-9787.2010.00675.x
Baumol, W. (2004). Education for innovation: entrepreneurial breakthroughs versus corporate incremental improvements. NBER Book Series Innovation Policy and the Economy, 5, 33–56.
Benavente, J. M. (2005). Investigación y desarrollo, innovación y productividad: Un análisis econométrico a nivel de firma. Universidad de Chile, Departamento de Economía., 32, 39–67.
Bogetic, Z., & Olusi, O. (2013). Drivers of Firm-Level Productivity in Russia’s Manufacturing Sector. In Policy Research Working Paper No. 6572. Washington, DC: World Bank.
Cassoni, A, & Ramada, M. (2010). Innovation, R&D and Productivity: The Uruguayan Manufacturing Sector. IDB Working Paper 191. Washington, DC, United States: Inter- American Development Bank.
Cassoni, A., & Ramada-Sarasola, M. (2010). Innovation, R&D Investment and Productivity: Uruguayan Manufacturing Firms. SSRN Electronic Journal. https://doi.org/10.2139/ssrn.1818742
Chataway, J., & Wield, D. (2000). Industrialization, innovation and development: What does knowledge management change? Journal of International Development, 12, 803–824.
Chong-Sup, K. (1997). Los efectos de la apertura comercial y de la inversión extranjera directa en la productividad del sector manufacturero mexicano. El Trimestre Económico, 64, 365–390.
Chudnovsky, D., López, A., & Pupato, G. (2006). Innovation and productivity in developing countries: A study of argentine manufacturing firmas 1992-2001. Research Policy, 35, 266–288.
Combes, P., & Gobillon, L. (2015). The Empirics of Agglomeration Economies. Handbook of Urban and Regional Economics, 5, 247–348.
Correa, P., Sanchez, I. G., & Singh, H. (2005). Research, Innovation and Productivity: Firm, Level Analysis for Brazil. Mimeo.
Correa, P., Sánchez, I., & Singh, H. (2005). Research, Innovation and Productivity: Firm Level Analysis for Brazil. Mimeographed Document.
Crepon, B., Duguet, E., & Mairesse, J. (1998). Research, Innovation, and Productivity: An Econometric Analysis at the Firm Level. In NBER Working Paper 6696, National Bureau of Economic Research, Inc.
Crespi, G., & Zuniga, P. (2012). Innovation strategies and employment in Latin American firms. Structural Change and Economic Dynamics, 24, 1–17.
Crespi, G., & Zuniga, P. (2012). Innovation and Productivity: Evidence from Six Latin American Countries. World Development, 40(2), 273–290. https://doi.org/10.1016/j.worlddev.2011.07.010
Crowley, F., & McCann, P. (2015). Innovation and Productivity in Irish Firms. Spatial Economic Analysis, 10, 181–204.
Crowley, F., & McCann, P. (2018). Firm innovation and productivity in Europe: evidence from innovation-driven and transition-driven economies. Applied Economics, 50(11), 1203–1221. https://doi.org/10.1080/00036846.2017.1355543
De Negri, J., Esteves, A., & Freitas, F. (2007). Knowledge Production and Firm Growth in Brazil. IPEA Working Paper 21. Instituto de Pesquisas Econômicas Aplicadas. Rio de Janeiro, Brazil.
De Negri, J., Esteves, L., & Freitas, F. (2007). Knowledge production and firm growth in Brazil (Issue 0057). https://econpapers.repec.org/RePEc:fup:wpaper:0057
Declan, J., & O’Leary, E. (2008). Is Irish innovation policy working? Evidence from high-technology. Journal of the Statistical and Social Inquiry Society of Ireland, 37, 1–44.
Di Falco, S., Veronesi, M., & Yesuf, M. (2011). Does Adaptation to Climate Change Provide Food Security? A Micro-Perspective from Ethiopia. American Journal of Agricultural Economics, 93, 829–846.
Dini, M., & Stumpo, G. (2011). Politicas para la innovacion en las pequeñas y medianas empresas en America Latina. In CEPAL-Colección Documentos de proyectos.
Doran, J. (2012). Are Differing Forms of Innovation Complements or Substitutes? European Journal of Innovation Management, 15, 351–371.
Duguet, E. (2001). Knowledge Diffusion, Technological Innovation and TFP Growth at the Firm Level: Evidence from French Manufacturing. SSRN Electronic Journal. https://doi.org/10.2139/ssrn.251307
Duguet, E. (2006). Innovation height, spillovers and TFP growth at the firm level: Evidence from French manufacturing. Economics of Innovation and New Technology, 15, 415–442.
Dutta, S., & Wunsch-Vincent, S. (2019). Global Innovation Index 2019. World Intellectual Property Organization, 12, 37.
Fazlıoğlu, B., Dalgıç, B., & Yereli, A. (2018). The effect of innovation on productivity: evidence from Turkish manufacturing firms. Industry and Innovation, 26, 1–22.
Frenken, K., Van Oort, F., & Verburg, T. (2007). Relate Variety, Unrelated Variety and Regional Economic Growth. Regional Studies, 41, 685–697.
Greenan, N., & Guellec, D. (1998). Firm Organization, Technology And Performance: An Empirical Study ∗. Economics of Innovation and New Technology, 6(4), 313–347. https://doi.org/10.1080/10438599800000024
Guevara, C., Riou, S., & Autant-Bernard, C. (2018). Agglomeration externalities and urbanization in Ecuador: do urbanization and tertiarization matter? ERSA Conference Papers, European Regional Science Association. https://ideas.repec.org/p/wiw/wiwrsa/ersa15p689.html
Guevara Rosero, C. (2021). Determinants of manufacturing micro firms’ productivity in Ecuador. Do industry and canton where they operate matter?
Guisado-González, M., Vila-Alonso, M., & Guisado-Tato, M. (2016). Radical innovation, incremental innovation and training: Analysis of complementarity. Technology in Society, 44, 48–54. https://doi.org/10.1016/j.techsoc.2015.08.003
Guisado Gonzáles, M., Vila, M., & Guisado Tato, M. (2015). Innovation, productive capacity, training and productivity. Cuadernos de Gestión, 16, 77–92.
Hall, B. (2011). Innovation and Productivity (NBER Working Paper No. w17178). https://ssrn.com/abstract=1879040
Hall, B., Lotti, F., & Mairesse, J. (2009). Innovation and productivity in SMEs: empirical evidence for Italy. Small Business Economics, 33, 13–33.
Harrison, B., Kelley, M., & Gant, J. (1996). “Innovative firm behavior and local milieu: exploring the intersection of agglomeration, firm effects, and technological change". Economic Geography, 72, 233–258.
India Brand Equity Foundation. (2021). Startup India - Empowering Startups for Growth. https://www.ibef.org/economy/startup-india
Isard, W. (1956). Location and Space-Economy : A General Theory Relating to Industrial Location, Market Areas, Land Use, Trade, and Urban Structure. Tlie Massachusetts Institute of Technology.
Khanna, T., & Yafeh, Y. (2007). Business Groups in Emerging Markets: Paragons or Parasites? Journal of Economic Literature, 45, 331–372.
Knoben, J., Arikan, A., Oort, F., & Raspe, O. (2016). Agglomeration and firm perfor mance: One firm’s medicine is another firm’s poison. Environment and Planning A, 48, 132–153.
Kremp, E., & Mairesse, J. (2004). Knowledge Management, Innovation, and Productivity: A Firm Level Exploration Based on French Manufacturing CIS3 Data. https://doi.org/10.3386/w10237
Landes, D. (1998). The Wealth and Powerty of Nations.
Lokshin, M., & Sajaia, Z. (2004). Maximum likelihood estimation of endogenous switching regression models. Stata Journal, 4, 282–289.
Ludym, J., Luzardo, M., & Rojas, M. (2018). Factores Determinantes de la Productividad Laboral en Pequeñas y Medianas Empresas de Confecciones del Área Metropolitana de Bucaramanga, Colombia. Información Tecnológica, 29, 175–186.
Lugones, G., Suárez, D., & Gregorini, S. (2007). La innovación como fórmula para mejoras competitivas compatibles con incrementos salariales. Evidencias en el caso argentino.
Mairesse, J., & Robin, S. (2009). Innovation and Productivity: A Firm-level Analysis for French Manufacturing and Services Using CIS3 and CIS4 Data (1998–2000 and 2002–2004). Working Paper, Paris: CREST-ENSAE.
Masso, J., & Vahter, P. (2008). Technological innovation and productivity in late-transition Estonia: econometric evidence from innovation surveys. The European Journal of Development Research, 20, 240–261.
Mohnen, P., & Hall, B. (2013). Innovation and Productivity: An Update. Eurasian Business Review, 3, 47–65.
Mol, M., & Birkinshaw, J. (2009). The sources of management innovation: when firms introduce new management practices. Journal of Business Research, 62, 1269–1280.
Parisi, M. L., Schiantarelli, F., & Sembenelli, A. (2006). Productivity, innovation and R&D: Micro evidence for Italy. European Economic Review, 50(8), 2037–2061. https://doi.org/10.1016/j.euroecorev.2005.08.002
Pinto, J., & Rodríguez, J. (2018). Medición del impacto de la innovación medio ambiental sobre el empleo en Ecuador 2012-2014. X-Pedientes Económicos, 2, 37–61.
Piva, M., & Vivarelli, M. (2002). “The Skill Bias: Comparative Evidence and an Econometric Test.” International Review of Applied Economics, 16, 347–357.
Porter, M. (1980). Competitive Strategy: Techniques for Analyzing Industries and Competitors. New York: Free Press.
Porter, M. (1990). The Competitive Advantage of Nations. Harvard Business Review.
Raffo, J., Lhuillery, S., & Miotti, L. (2008). Northern and southern innovativity: a comparison across European and Latin American countries. The European Journal of Development Research, 20(2), 219–239. https://doi.org/10.1080/09578810802060777
Romer, P. (1994). “The origins of Endogenous Growth.” The Journal of Economic Perspectives, 8, 3–22.
Roper, S., Du, J., & Love, J. (2008). Modelling the innovation value chain. Research Policy, 37, 961–977.
Rosales, F. (2018). Teoría de localización de una planta industrial. Universidad Mariano Galvez, Guatemala.
Salomon, R., & Myles, S. (2005). “Learning by Exporting: New Insights from Examining Firm Innovation “. Journal of Economics & Management Strategy, 14, 431–460.
Sánchez, G., & González, N. (2007). Fuentes externas de innovación: un análisis de la cooperación con clientes en Europa y España. Research Gate.
Sánchez Serra, D. (2016). Location determinants of creative industries’ firms in Spain. Investigaciones Regionales, 34, 23–48.
Santamaria, L., Nieto, M. J., & Barge-Gil, A. (2009). Beyond formal R&D: Taking advantage of other sources of innovation in low- and medium-technology industries. Research Policy, 38, 507–517.
Schumpeter, J. (1934). The Theory of Economic Development. Harvard University Press.
Schwab, K. (2009). The Global Competitiveness Report 2009–2010. In The Global Competitiveness Report 2009-2010. https://ideas.repec.org/a/cai/recosp/reco_pr2_0048.html
Servicio de Rentas Internas. (2021). Manual de Gasto Tributario 2019.
Silva, A., & Africano, A.P. (2013). ¿Las empresas más productivas se autoseleccionan para exportar? Aplicación de una prueba para el caso de Portugal. Investigación Económica, 135–161.
Solow, R. (1957). Technical Change and the Aggregate Production Function. The Review of Economics and Statistics, 39, 312–320.
STIA. (2011). Science, Technology and Innovation Activity Survey. A Report on Scientific Research, Technological Development and Innovation in Ecuador for the Period 2009-2011.
STIA. (2014). Science, Technology and Innovation Activity Survey. A Report on Scientific Research, Technological Development and Innovation in Ecuador for the Period 2012-2014.
Swann, G., Prevezer, M., & Stout, D. (1998). The Dynamics of Industrial Clustering: International Comparisons in Computing and Biotechnology. Oxford University Press.
Tang, J. (2006). Competition and innovation behaviour. Research Policy, 35, 68–82.
Torrez, T., & Ordoñez, J. (2019). Agglomeration economies and urban productivity. REGION, 6, 17–24.
Yang, C.-H., Lin, C.-H., & Ma, D. (2010). R&D, Human Capital Investment and Productivity: Firm‐level Evidence from China’s Electronics Industry. China World Economy, 18, 72–89.
Yunus, N., Said, R., & Law, S. (2014). Do cost of training, education level and R&D investment matter towards influencing labour productivity? Jurnal Ekonomi Malaysia, 133–142.
Željko, B., & Olasupo, O. (2013). Drivers of Firm-Level Productivity in Russia’s Manufacturing Sector. World Bank Policy Research Paper Series, No. 6572.
Información adicional
JEL Classification:: O12; O54; D24