European Regional Policy
Change and Continuity in Quality of Government: Trends in subnational quality of government in EU member states
Change and Continuity in Quality of Government: Trends in subnational quality of government in EU member states
Investigaciones Regionales - Journal of Regional Research, núm. 53, pp. 5-23, 2022
Asociación Española de Ciencia Regional

Esta obra está bajo una Licencia Creative Commons Atribución-NoComercial 4.0 Internacional.
Recepción: 30 Junio 2022
Aprobación: 09 Julio 2022
Abstract: Despite massive investments, studies suggest that anticorruption efforts often times fail and that countries and regions with historically deficient quality of government tend to be stuck in a vicious cycle of high levels of corruption and inadequate public service delivery. However, this study suggests that despite the stickiness of subnational quality of government, regional quality of government does shift over time. Using the 2021 European Quality of Government Index (EQI), and comparing the results to previous rounds of this survey, we show that there has indeed been noticeable shifts in the regional level of Quality of Government both within countries and across time. Overall, we find a slight increase in the perceived quality of government of European regions compared with 2017. However, some regions have evaded the positive trend, most notably in Poland and Hungary, whose response to the pandemic – probably not coincidentally – has involved important infringements of democratic rights and institutions. These changes in Quality of government call for a close mapping of the trends within countries and across regions and a focus on their determinants. To this end, the paper also serves as an introduction to the use of 2021 European Quality of Government (EQI) index, which is the most comprehensive survey to date to measure perceptions of subnational quality of government with a total of 129,000 respondents in 208 NUTS 1 and NUTS 2 regions and all EU 27-member state countries.
Keywords: Europe, regions, corruption, quality of government, time series, measurement, Covid-19.
Resumen:
A pesar de masivas inversiones económicas, los estudios sugieren que los esfuerzos anticorrupción a menudo fracasan y que los países y regiones con una calidad de gobierno históricamente deficiente tienden a quedar atrapados en un círculo vicioso de altos niveles de corrupción y una prestación inadecuada de los servicios públicos. Sin embargo, este artículo sugiere que, a pesar de cierta continuidad en la calidad de gobierno a nivel subnacional, hay cambios sustanciales a lo largo del tiempo. Usando el Índice Europeo de Calidad de Gobierno (EQI) de 2021, y comparando los resultados con oleadas anteriores de esta encuesta, mostramos que, de hecho, ha habido modificaciones notables en el nivel regional de Calidad de Gobierno tanto dentro de los países como a través del tiempo. En general, encontramos un ligero aumento en la percepción ciudadana de la calidad de gobierno de las regiones europeas en comparación con 2017. No obstante, algunas regiones han evadido esta tendencia positiva, sobre todo en Polonia y Hungría, países cuya respuesta a la pandemia, probablemente no por casualidad, ha implicado importantes violaciones de los derechos ciudadanos y libertades democráticas. Estos cambios en la calidad de gobierno exigen un análisis más detallado de las tendencias dentro de cada país, así como de sus causas. Con este objetivo, este artículo también sirve como introducción al uso de la edición de 2021 del Índice Europeo de Calidad de Gobierno (EQI), que es la encuesta más completa hasta la fecha para medir las percepciones ciudadanas de la calidad de gobierno subnacional con un total de 129,000 encuestados en 208 regiones NUTS 1 y NUTS 2, y de los 27 estados miembros de la UE.
Palabras clave: Europa, regiones, corrupción, calidad de gobierno, series temporales, medición, Covid-19.
Introduction
Despite massive investments, studies suggest that anticorruption efforts often times fail and that countries and regions with historically deficient quality of government tend to be stuck in a vicious cycle of high levels of corruption and inadequate public service delivery (Kaufmann et al 2011; Heywood and Rose 2014; Person et al 2013; Bauhr 2017). The continuity of corruption – or, its nemesis, quality of government – leads to perception of shifts being both rare and slow, and that the results of efforts to improve quality of government may take a generation or more to materialize.
In addition to the perception of stickiness, scholars also point out another constant in this literature: it mostly builds on country level data, which indeed runs the risk of masking potentially important and sometimes dramatic differences within countries and across regions (Barca, McCann and Rodríguez‐Pose 2012; McDonnel and Metz 2000; Drápalová and Mascio 2020). Thus, while recent years have seen an increase in the research within social sciences focused on the sub-national level – regions - instead of countries (Rodríguez-Pose 2020), our opportunities to track changes over time in regional quality of government has been very limited, to date. This is concerning, not the least since the quality of government in a territory has been documented as a key factor for understanding its social, economic, political and cultural progress, and thereby human well-being broadly conceived (Bagenholm et al 2021; Holmberg, Rothstein and Nasiritousi 2009), and that regional differences in socio-economic development, are seen as one of the most important threats to the European Union’s future prospects for social and economic cohesion (Iammarino et al 2019).[1]
In order to address both issues (Is quality of government sticky? And are there important subnational differences?), this study explores the results of the most comprehensive effort to date to map regional levels of quality of government in the European Union (EU) analyzing the opinion and direct experience of over 129,000 respondents in a total of 208 regions in all EU 27 member state countries and either the NUTS1 or NUTS2 level. Building on previous rounds of this survey (2010, 2013 and 2017), the data allows us to explore both variation across regions and within regions over time. Although our analysis concurs with the general consensus in the sense that some regions in Europe do indeed shift very little over time, we also document important regional level shifts in the geography of quality of government over time and within countries. As a first step to understand the sources of such shifts, this article maps these changes with the aim of also serving as a guide to the future use of the 2021 European Quality of Government index. In addition, we provide illustrative evidence of the connections between shifts in the index, and events and policy decisions taken by authorities in a region. In particular, we provide some narratives from Spain’s Valencia, which experienced one of the highest increases from the 2017 round to the 2021 one. During these years, Valencia’s regional government put in place numerous pro-quality of government policy initiatives, including the creation of an important anti-fraud agency, which, according to the experts, help to explain the overall improvement of the citizens’ perception of quality of government in the region (Marco and Martínez 2022).
Conceptually, we follow the standard definition of quality of government in the literature, that of Rothstein and Teorell (2008) – i.e. Quality of Government (QoG) understood as impartiality in the exercise of public power. To measure it, we look at citizens’ perceptions and experiences regarding three aspects: impartiality, i.e. that the government upholds an impartial treatment of all citizens irrespective of their personal characteristics or connections; corruption, i.e. that there is no abuse of public office for private gain), and quality, i.e. that the public services are perceived as high-quality. It builds on a previously published data from three previous rounds: 2010 (Charron, Lapuente and Rothstein 2013; Charron, Dijkstra and Lapuente 2014) 2013 (Charron, Dijkstra and Lapuente 2015) and 2017 (Charron, Lapuente and Annoni 2019)[2]. The EQI has had a significant impact on scientific research of territorial differences in several disciplines, becoming, “an instant hit since its release, with several researchers resorting to it as the main indicator of institutional quality across regions of Europe” (Rodriguez-Pose 2020: 374). The data has also been a key feature in the Economic, Social and Territorial Cohesion Reports[3], regularly published by the European Commission to monitor cohesion levels across the European regions.
Our mapping exercise allows us to contribute to the existing knowledge on regional variation in quality of government in several important ways. While the results of the 2021 EQI show that the level of quality of government remains stable over time in several regions, and thereby concurs with the findings of the ‘stickiness’ of QoG, we document surprisingly important changes along several dimensions: over time, between geographic parts of Europe and among regions within countries. We see that perceptions of the overall quality of government has improved in Europe since 2017, thereby lending support for the contention that quality of government may indeed be less sticky than previous research suggests. Furthermore, comparing different parts of Europe, we show that the geography of regional QoG is slowly shifting. While several Eastern European regions seem to be on a rise, several southern European regions see a marked decline. We also show that some countries seem to become more cohesive and converge over time (i.e. Portugal), while we see a remarkable divergence within others, such as Spain. Comparing the two highly economically developed Spanish regions the Basque Country and Catalonia, we find that the Basque country rates among the top 25% regions in Europe, while Catalonia, in contrast, rates just slightly above the 25% lowest performing regions. And these differences have been increasing over time since the first EQI round in 2010, generating a growing discussion among Spanish public administration scholars (Jiménez-Asensio 2021).
Further indications of the precariousness of quality of government are found in many Hungarian and Polish regions, where we find a noticeable decline in the EQI compared to the EU average in most regions. Thus, while the EQI in regions in i.e. Slovenia and Lithuania have increased, Polish and Hungarian regions seem to have largely evaded the general positive trend in quality of government. The response to the Covid 19 pandemic in Poland and Hungary involved– probably not coincidentally – important infringements of democratic rights and institutions (Hellmeier et al. 2021). While it is important to note that quality of government is a concept that should not be conflated with democracy, since democratic countries can also struggle with high levels of corruption and deficient public service delivery, studies suggest that in most international comparisons, liberal democracies fare the best in terms of containing corruption and improving the quality of government (Bauhr and Grimes 2021). Thus, infringement in democratic rights may have had implications for the perceptions of quality of government as well.
A unique feature in the 2021 EQI survey is also that it is the most comprehensive regional-level survey to date on citizens’ perceptions of Covid 19. We included questions on citizens economic and health worries in relation to the pandemic as well as perceptions on how well the government handled the Covid 19 crises. Most of the public discussion during pandemic has focused on “which countries are doing better”, but within country-differences have been sharper than cross-country ones (McCann et al 2021; Charron, Lapuente and Rodriguez-Pose 2022).[4] As the 2021 round took place during the Covid-19 pandemic, we provide indications of some key relationships with regional QoG and perceptions and experiences of citizens before and during the pandemic. We offer a parsimonious, baseline analysis that shows that previous levels of quality of government are strongly associated to perceptions of the COVID-19 pandemic in the region, and that citizens living in territories with higher levels of quality of government (both in previous rounds as in this 2021 one) exhibit lower levels of both health and economic worry compared with regions that have lower levels of quality of government. The quality of government thus could provide a sense of security and/or a reduction in vulnerability that signals resilience in challenging times. Likewise, the pandemic could also impact perceptions of the quality of government. Potentially, reductions in the interactions between citizens and public officials – due lo lockdowns, school closures and other restrictions – could reduce the opportunities for bribery. Much in line with this expectation we find a notable decreases in the self-reported experiences with petty corruption in regions across many EU Member States, including Italy, Czech Republic, Slovakia, Hungary and Bulgaria in the 2021 survey compared with previous waves. Potentially also as a result of increased exposure, visibility and perceived dependency of government institutions, we find that perceptions of QoG regarding health care services improved uniformly since the previous round.[5]
In the following, we present the 2021 round of data in brief, and highlight the key changes vis-à-vis previous rounds. Furthermore, we exploit the time series component of the data to highlight several interesting temporal trends in the data – namely the within-country, regional variation of QoG over time, and the within-region, over time relationship with the EQI on indicators of socio-economic development. Finally, as the 2021 round took place during the Covid-19 pandemic we indicate some key relationships between regional QoG and perceptions and experiences of citizens before and during the pandemic.
The European Quality of Government Index: Continuity and Changes in the 2021 Round
The data for the European Quality of Government Index 2021 relies on over 129,000 respondents in 208 NUTS 1 and NUTS 2 regions in all EU 27 member state countries[6]. Together with national estimates from the World Bank Governance Indicators (Kaufmann, Kraay and Mastruzzi 2011), we report the results for all EU 27 countries, and a total of 208 political units[7]. The core QoG survey questions (also called items) are based on the conceptual framework which understands the concept of QoG as a broad, latent multi-dimensional concept consisting of high impartiality and quality of public service delivery, along with low corruption. The concept also refers to how power is actually exercised, not necessarily the de jure formal rules but rather the de facto rules as perceived and experienced by the citizens. In other words, we can say that the EQI is describes the informal practices of formal institutions. To do this, it relies on European citizens’ perceptions regarding these three concepts and also experiences with corruption, along with the extent to which they rate their public services as impartial and of good quality in the area in which they reside. A full list of the survey questions and how the index is constructed is found in several previous documents (see for example, Charron et al 2014; Charron, Lapuente and Bauhr 2021).
The purpose of the EQI is to provide scholars and policy makers with a comparable metric of sub-national governance that can be used to compare QoG across European regions, such that regions in one country can be compared with regions in any other one. Now that the EQI had four rounds, the data can be used to track changes in regional QoG over time since 2010.
The 2021 EQI data largely builds on the work of previous rounds, although there are several differences.
One, for the first time the survey uses a hybrid survey administration approach. Whereas in previous rounds the EQI relied on computer assisted telephone interviews (CATI) via mobile and landline telephones, we now utilize online survey administration for 50% of the respondents. There are several reasons for this change. First, the online administration is of particular interest for a topic such as the EQI, where sensitive questions about perceptions and experiences with corruption, for example, could be affected by social desirability biases from interviewer-administered surveys, such as face-to-face or over a telephone. Studies show that respondents are more likely to answer truthfully about such sensitive topics when taking self-administered surveys, thus providing more accurate data (Kreuter, Presser, and Tourangeau, 2008; Heerwegh, 2009). Second, the costs and flexibility of online administration are superior to CATI: interviews are considerably cheaper and respondents can answer questions at their own pace without the time constraints of telephone interview[8]. Third, previous rounds of the CATI interviews showed that certain sub-groups of respondents, such as the youngest cohorts, were consistently under-sampled, due to lack of owning a landline and lower rates of response via mobile phones. The use of online administration has led to a greater proportion of the sample containing such groups[9]. With this shift to hybrid administration, the EQI data has increased the sample size considerably – from 78,000 in 2017 to 129,000 in 2021, an increase of more than 65% (see Charron, Lapuente and Bauhr 2021 for more details on the sample). In appendix 4, we assess the differences in perceptions and experiences of QoG across EU regions by survey administration. In sum, we find a high degree of correspondence in terms of the rank order in the EQI produced by both administration types, with just 9% of regions showing significant differences (see Figure A4).
The second major change with respect to previous EQI rounds is that the regional level is now the NUTS 2 in all the EU countries[10]. Compared with previous years, we now report NUTS 2 level data for Sweden, Greece and Slovenia from the NUTS 1 to NUTS 2 level, and Lithuania has added a second NUTS 2 region, thus we report multiple NUTS 2 regions for this member state as well for the first time. These changes allow for more flexibility and observations for research and greater opportunities to explore within-country regional variation.
Third, the EQI survey now samples all EU-27 member states[11]. Previous surveys included only those member states with at least 2 NUTS 2 regions. The 2021 survey has comparable survey data for previously omitted countries: Estonia, Slovenia, Cyprus, Luxembourg, Malta, Lithuania and Latvia, for which we relied on the World Bank Governance Indicators as proxies at the national level. For purposes of comparison over time, we have made retrospective changes to previous years that can be employed to analyze a common set of regions over time (see appendix section 3 for more details). In appendix section 4, we present a further validity check of the data via a comparison of the expert (WGI and ICRG) and citizen (EQI) assessments of QoG at the country level for all member states from the 2021 round, where we find a high degree of corresponds between the two sources.
Fourth, the number of languages offered during questions administration was extended in this round, with a focus on offering the survey in multiple languages in regions where there are sizable linguistic minority communities. In Spain, the EQI is now offered in Catalan and Basque in addition to Spanish; in Italy, respondents in the northern regions may answer in German, if at the border with Austria, or French, if at the border with France; Romanian respondents in the Nord Vest (RO11) and Centru (RO12) regions may now also answering in Hungarian, and respondents in Latvia and Estonia have the option of Russian in addition to their main respective languages. Belgians anywhere may answer in Dutch or French as in all the previous rounds.
The 2021 EQI[12]
The 2021 picture is rather consistent with previous editions of the EQI (see Charron et al. 2014; 2015; 2019), with a north-western area performing better than the south-eastern part of the EU (Figure 1). There are also significant regional differences in some countries - Italy, Spain, Belgium, Ireland, Poland France, including its overseas regions, and Slovenia, in particular – but very little in others, the Nordic countries, especially, but also Austria and Slovakia (for full results, see appendix 5). Slovenia is also a noteworthy case, with the eastern, capital region (SI03) being roughly 0.6 standard deviations above the western region of SI04. Thanks to the new NUTS2 classification in Ireland, for the first time the capital region, Dublin (IE06) is assessed separately from the other two and scores significantly lower than the Southern region (IE05), taken into account the margins of error.
Figure 2 shows the distribution of regional scores by country (countries reordered according to their national value from the best performers, left-hand side, to the worst performer, right-hand side). Regions are displayed in three categories – from less developed to more developed passing through the transition category - according to their GDP per capita. These categories represent the region’s eligibility criterion for EU cohesion policy funding, in particular for the European Regional Development Fund and the European Social Fund both highly relevant in the context of regional investment for jobs and growth. The lower the region’s level of development, the higher the share of European investment funds the regions is eligible to receive. Overall, more developed regions are also those showing the highest levels of EQI, both within and within countries, as can be seen by the prevalence of green and yellow in the left-hand side of the figure.
One interesting observation is that the level of QoG in capital regions varies significantly within countries. We observe that Ljubljana, Lisbon, Vilnius and Prague are actually the best in the country, while many other cases capital regions scores in the middle. At the other end, we several cases where the capital is the poorest performer, which is observed at both ends of the QoG spectrum. From countries with higher levels of QoG, like the Netherlands and Germany where we see Amsterdam and Berlin regions the lowest within-country ranking, while in countries like Poland, Slovakia, Bulgaria and Romania, the capital regions of Warsaw, Bratislava, Sofia and Bucuresti-Ilfov show the lowest levels of QoG.
Figure 1.
The European Quality of Government index (EQI), 2021
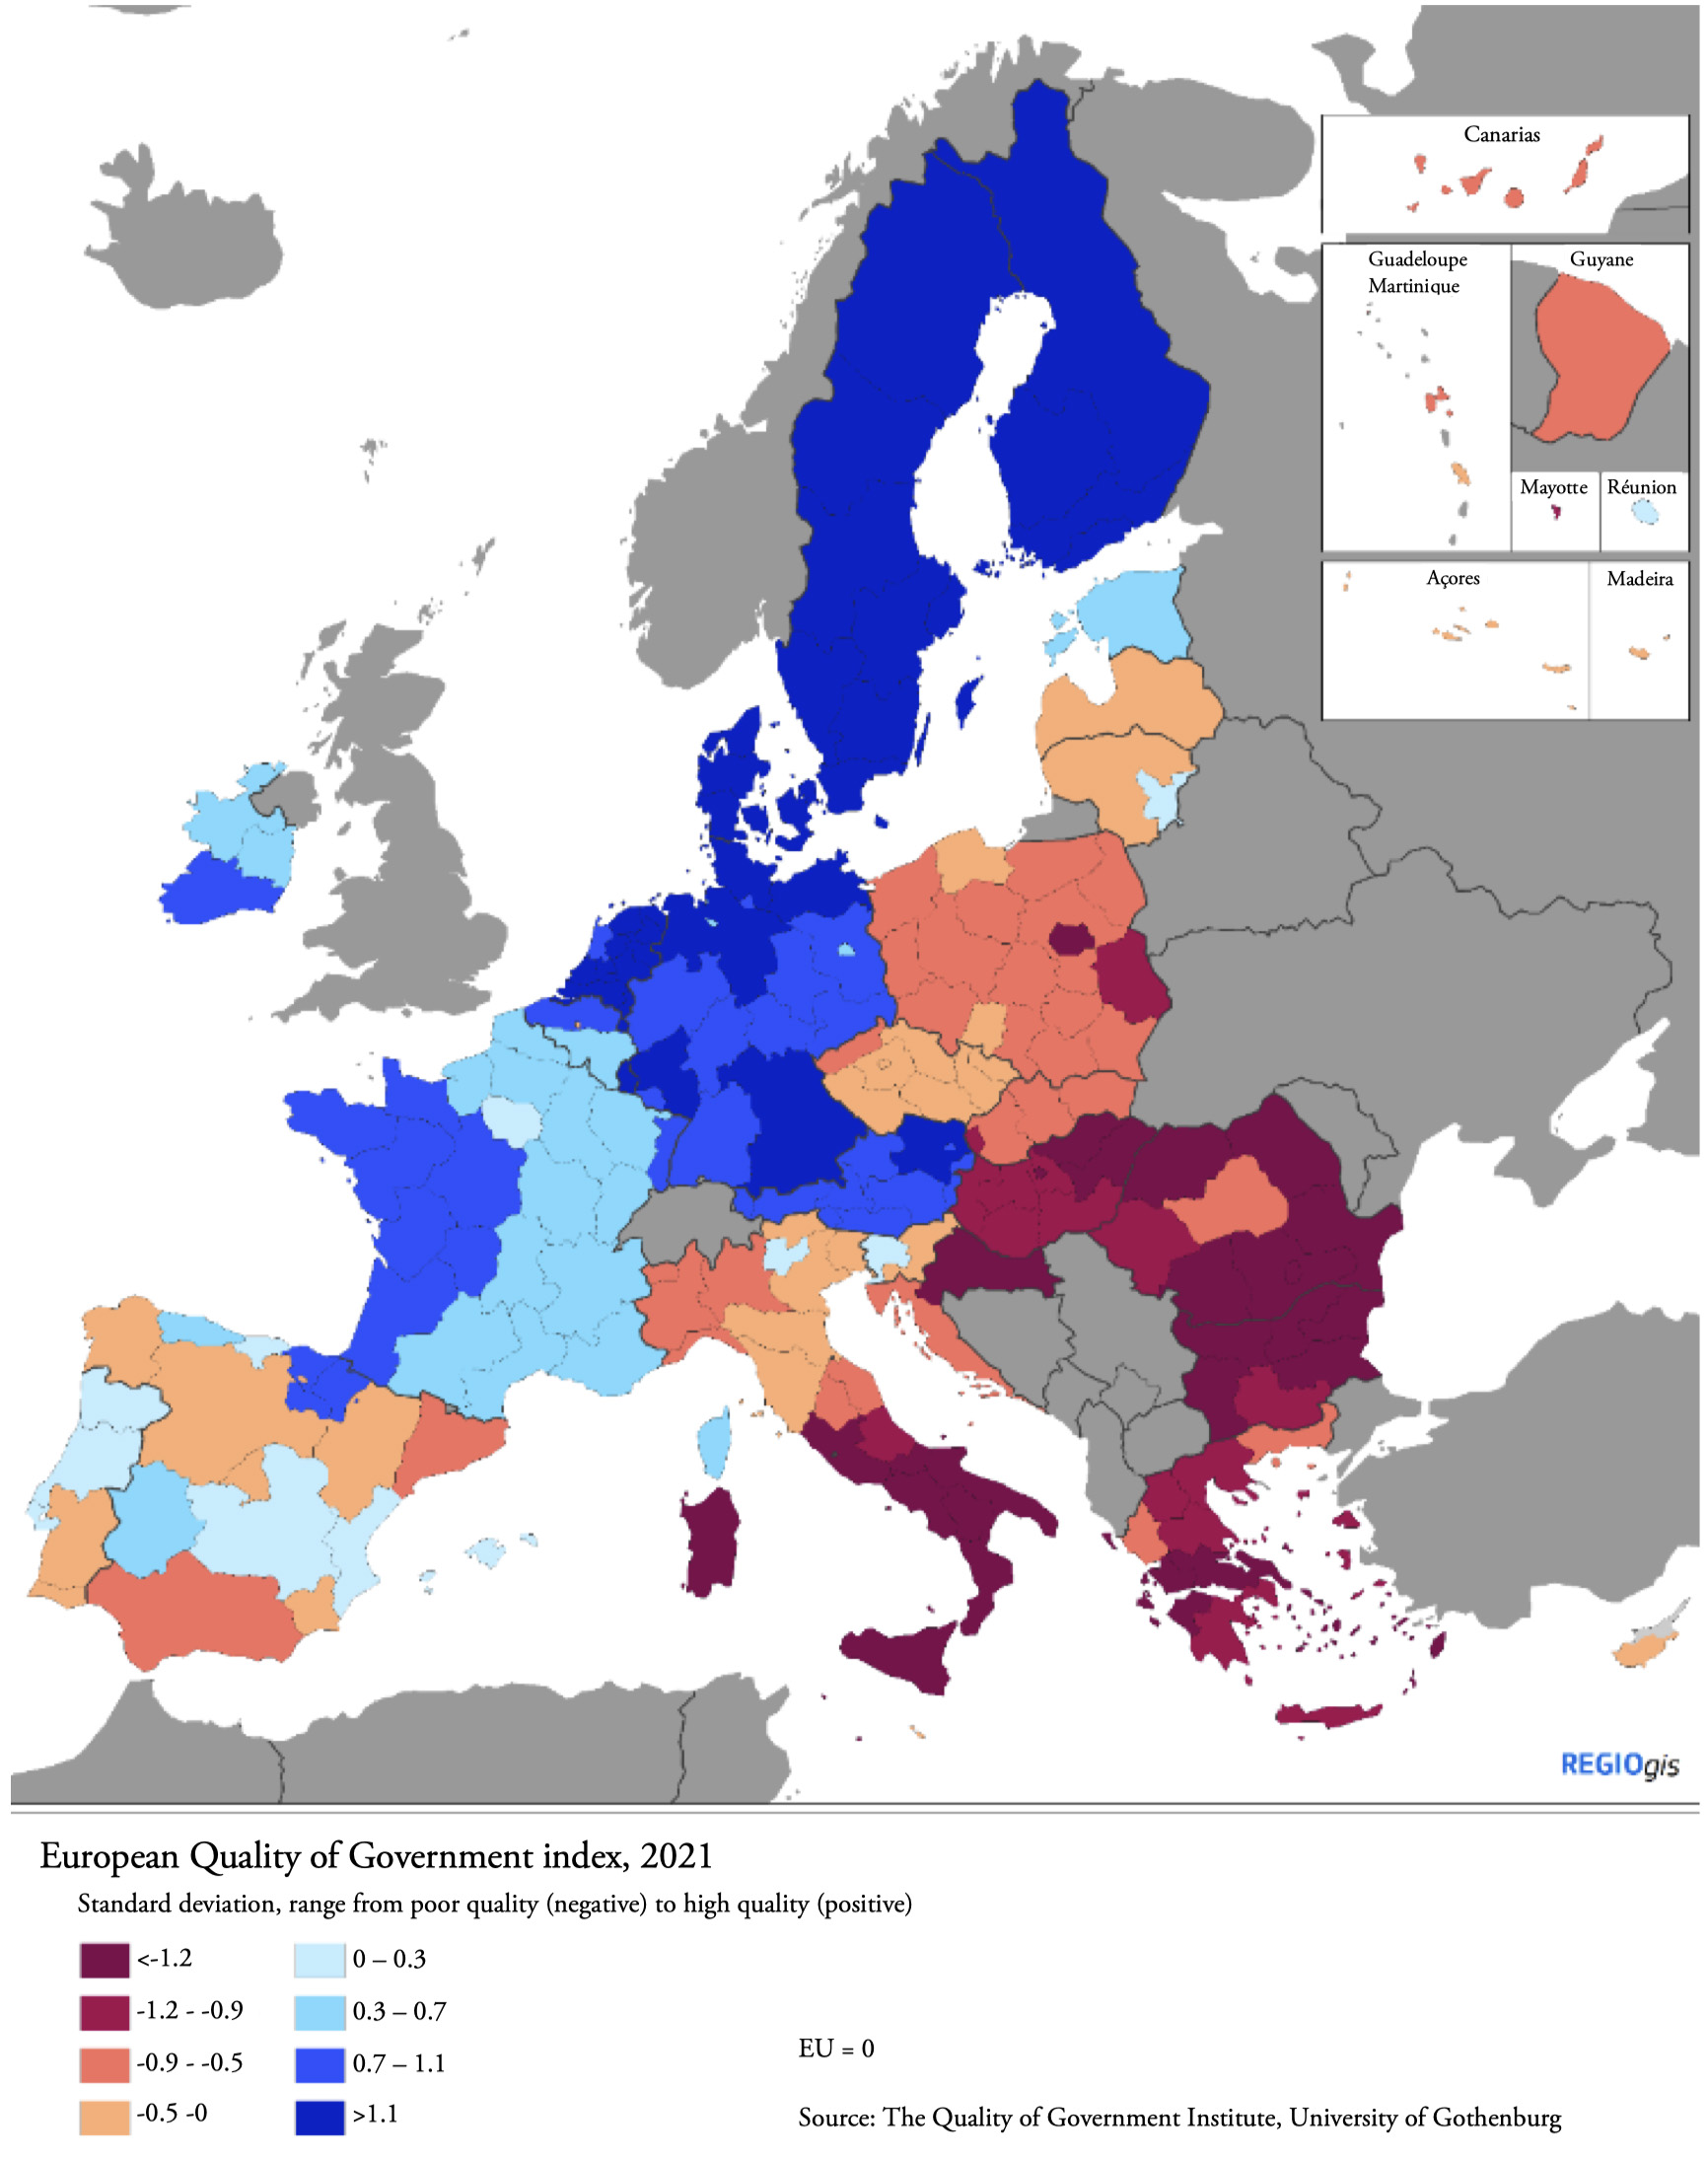
Note: Scores are expressed in z-scores, EU average is therefore equal to 0. Positive (negative) values reflect higher (lower) than the EU average quality of government. One unit of difference is equivalent to one standard deviation of difference.
Figure 2.
Distribution of 2021 EQI scores by region and country
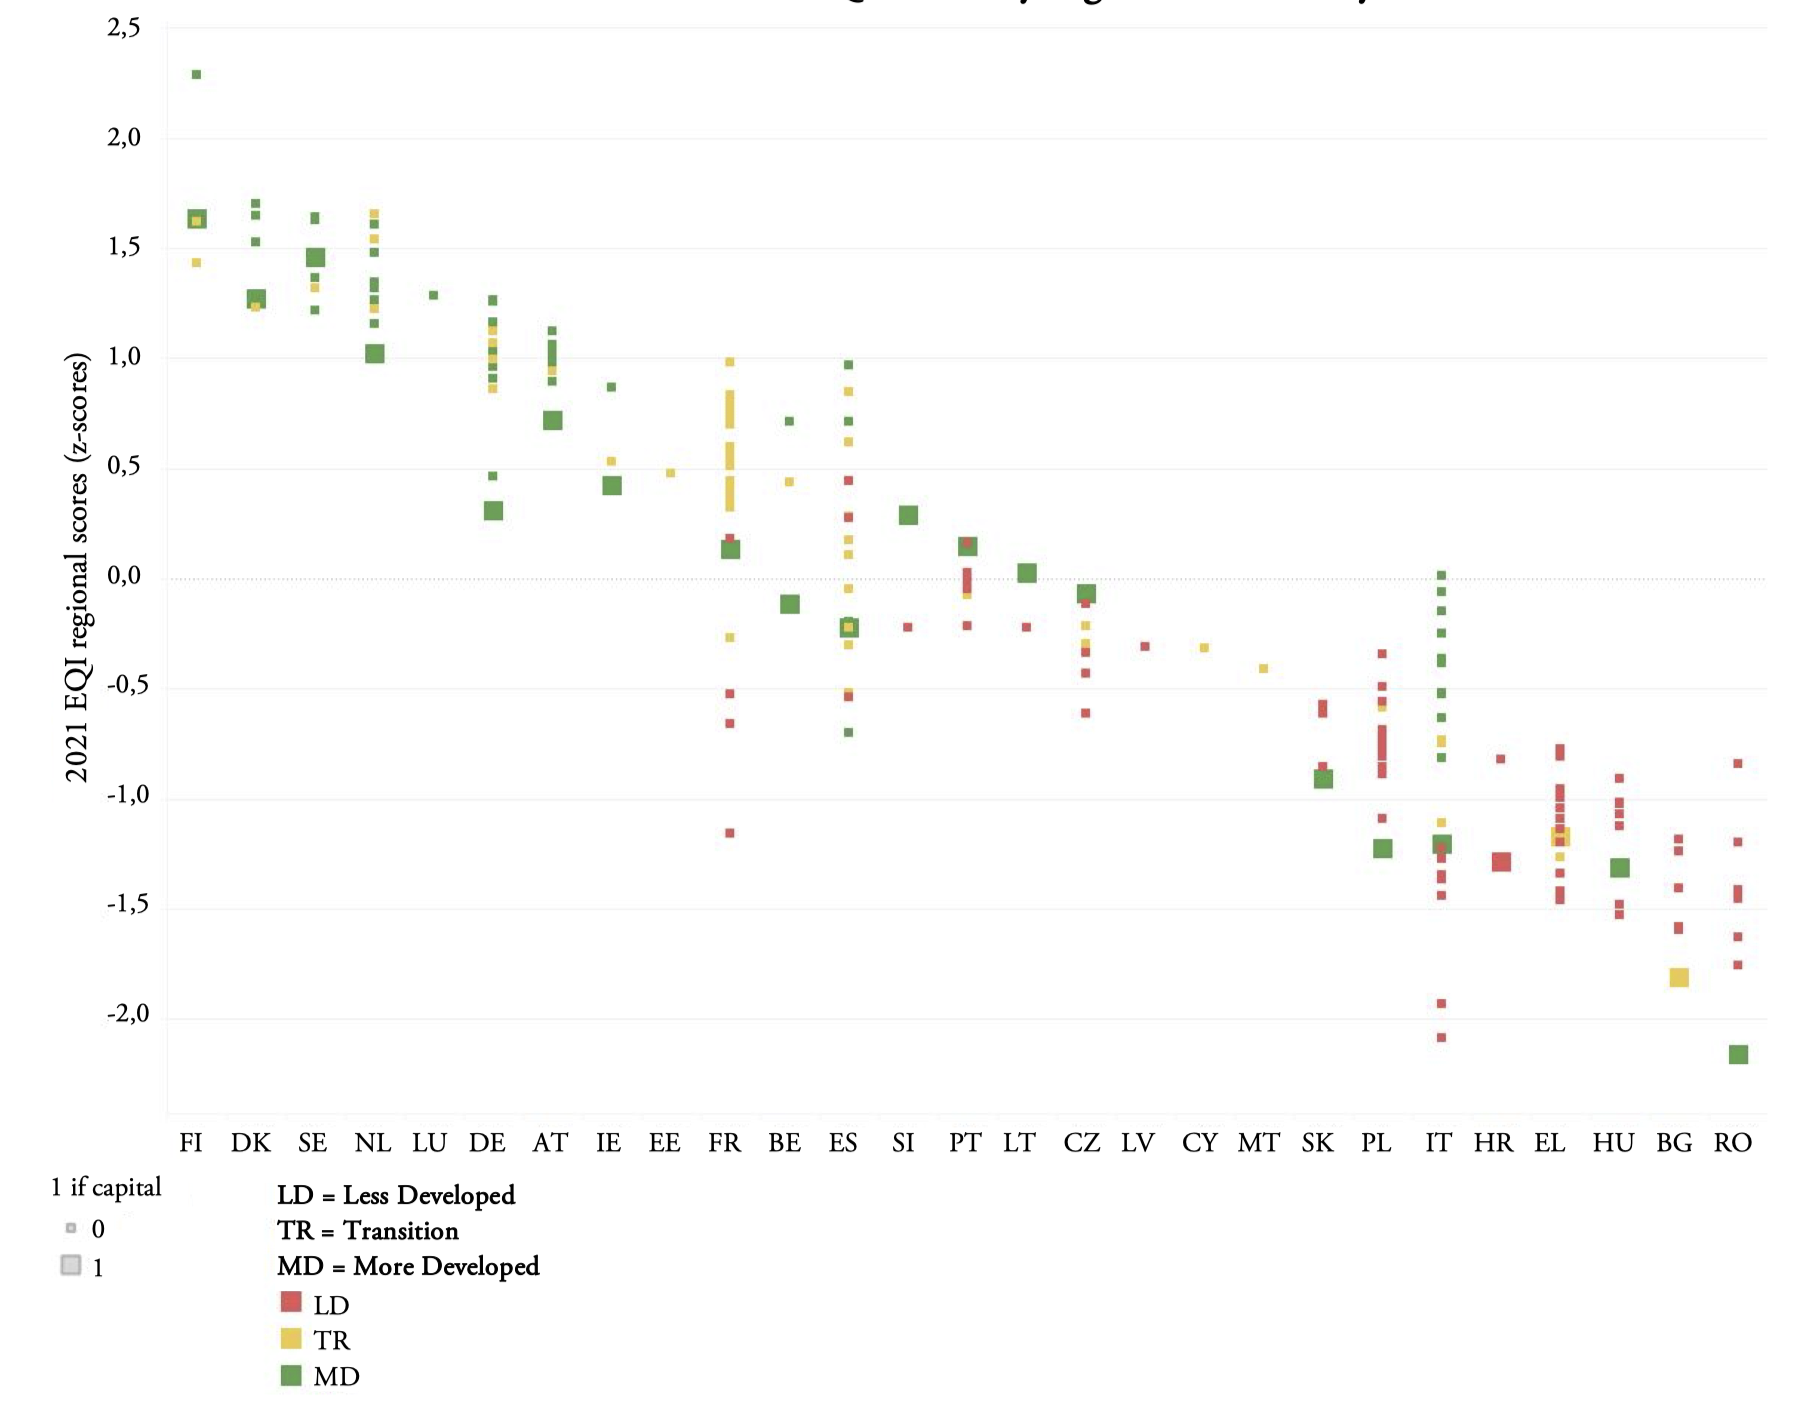
Note: Capital regions are highlighted (larger symbol). Regions are classified according to their category for EU cohesion fund eligibility (see text for explanation). Countries reordered from best (left-hand side) to worst (right-hand side) according to their national average score.
Notable regional trends over time in the EQI
Given the EQI now includes four rounds ranging 11 years in time, we can elucidate more valid temporal patterns in the data. Using the margin of error confidence intervals for the previous rounds 2010-2017 (Figure 3, left side), we can identify statistically significant improvements in the quality of government in the Baltic countries, most of Poland and Germany, the Netherlands, Croatia and some regions in Romania and Bulgaria. By contrast, there was a deterioration between 2010 and 2017 in Austria, Hungary, southern Greece, Cyprus, the southern part of Spain and some regions in Portugal and Italy. More recently, between 2017 and 2021 the index stabilised in the Baltic countries (Figure 3, center) [13] and worsened in most Polish regions, especially in the east of the country. The same is the case the eastern part of Romania, where the capital city region of Bucuresti-Ilfov, had the lowest score in the EU in 2021. On the other hand, there was some improvement in the index over this period in the south of Spain, southern Germany, southern Greece and the south and central parts of Italy. The change in the EQI is analysed separately for the period 2010-2017 and 2017-2021 to highlight recent pattern in quality of government perceptions that may have been caused by the exceptional circumstances due to the Covid-19 pandemic. The overall trends since 2010 are shown by the right-hand side map of Figure 3 that, as expected, are more consistent with the 2010-2017 trends.
Figure 3.
Significant regional increases and decreases in the EQI over time
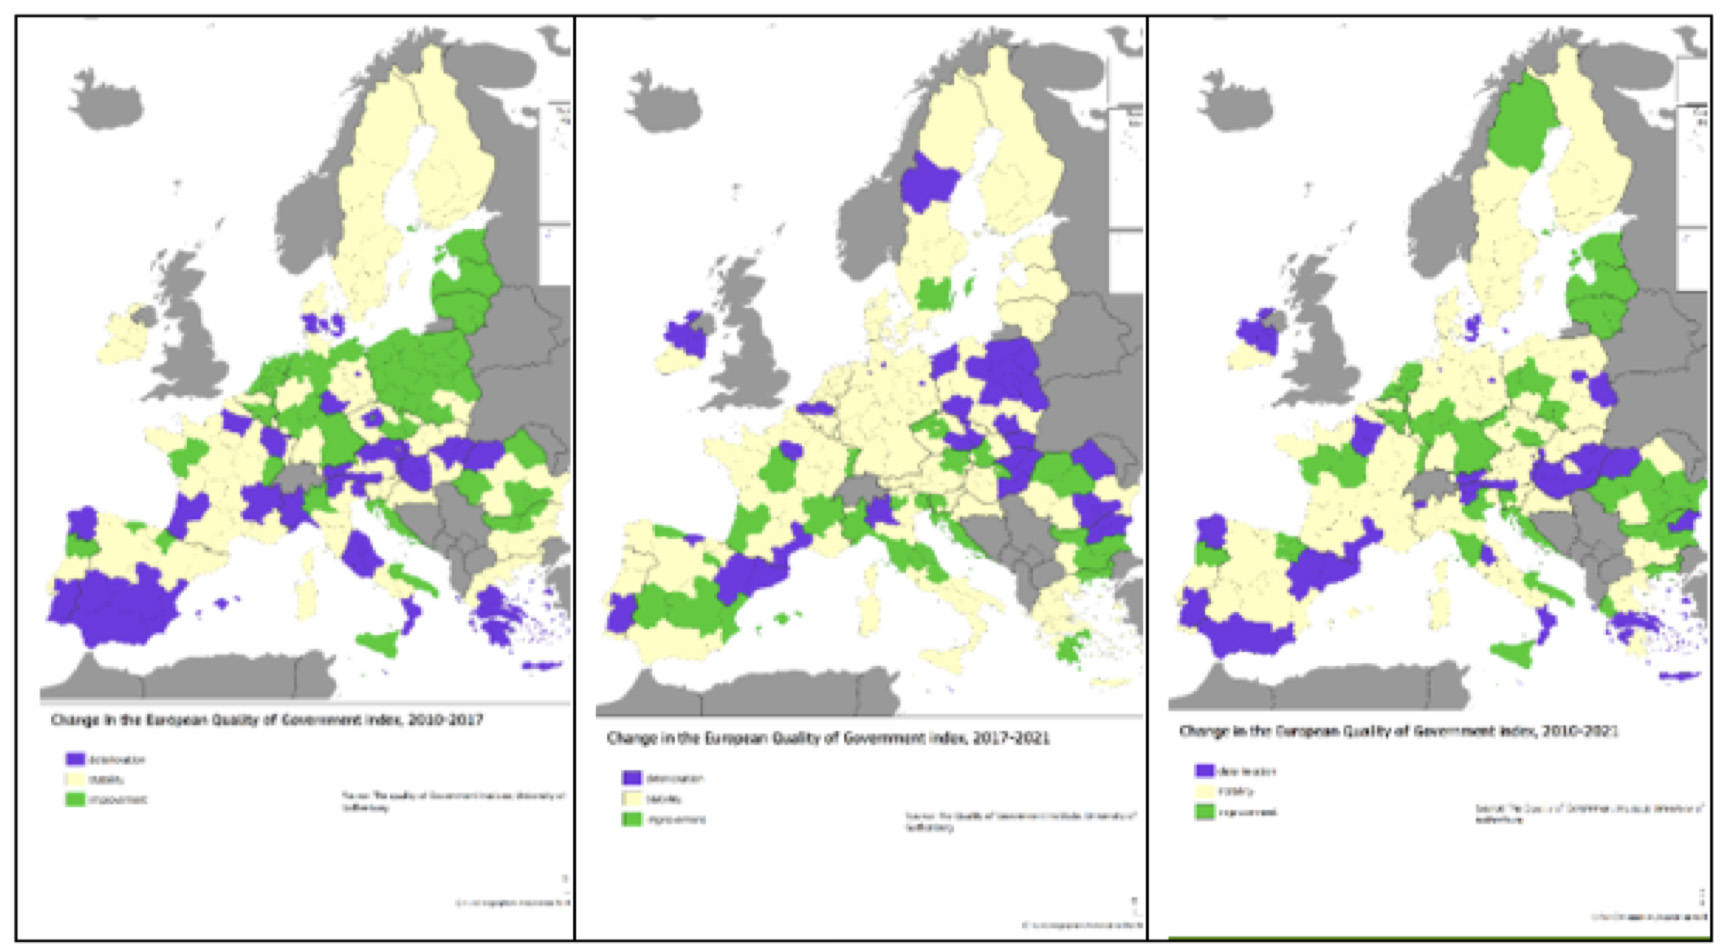
Note: Regions where scores increased (decreased) by more than 0.25 standard deviations in the period are shown on green (purple). Left side is 2010-2017, center is 2017-2021 and the right side is the total change, 2010-2021. Source: DG REGIO based on data by the Quality of Government Institute, University of Gothenburg.
Let us focus on one particularly remarkable improvement: Spain’s Valencia, a region that has moved from below both the Spanish and European average in 2017 to clearly above both averages in 2021. Traditionally Valencia was a region covered with corruption scandals, including 17 cases against the conservative party, which had been in charge of some of the most important administrations -both the regional government and local administrations – from the 1990s (Gasparet 2018). The regional parliament has passed a large battery of measures to foster quality of government and fight corruption, chief among them the creation of the Agency of Prevention and Fight against Fraud and Corruption (AVA) in mid-2017, with has 40 employees and is headed by Joan Llinares, one of the most reputed anti-corruption civil servants in Spain (Bono 2021). Thanks to a regulation protecting whistleblowers that predated the EU legislation (European Union 2019), AVA has 25 protected whistleblowers (Bono 2017), and addressed hundreds of potential cases of corruption and mismanagement. Together with other measures, such as the creation of a Council of Transparency and an Office of Conflict of Interest, and the promulgation of a regional law for controlling lobbies and a regional enlargement of the national law of access to public information, Valencia is now widely seen by experts in public administration and other observers as an example in the improvement of quality of government (Marco and Martinez 2022), which we see is reflected in citizen perceptions.
Moving to the degree of regional divergence/convergence of QoG over time within member states, Table 1 provides two simple measures of within-country regional dispersion – the standard deviation of regional EQI scores, min-max range and the Gini index[14] for each of the four years to date, along with the within and between Member States and overall trends of the Gini index score. Italy remains the country with the greatest degree of within-regional variation in 2021 according to all three dispersion measures, although the variation is down from the high levels of 2013. Although 2021 reveals the fewest number of member states with a min-max range above one standard deviation in the data (4 countries –Italy, Spain, France and Romania), half of the countries that were included in 2017 increased on the standard deviation metric (11 of 22). Within-country convergence and divergence trends are working in different directions depending on the member states. On the one hand, while in some countries we observe the lowest levels of within-country QoG, such as Belgium, Bulgaria, Austria and Portugal on the other hand, we observe the highest levels of regional divergence to date in Poland, Germany, Netherlands, Denmark, Sweden, Slovakia and Croatia.
The above country by country analysis enabled us to find interesting cases of convergence, in the case of Portugal, and divergence, in the case of Spain, of regional QoG levels. The performance of Portuguese regions featured a rather high variability both in 2010 and 2013, with a range above one standard deviation, to a rather limited one in 2017 and especially in 2021, with a range that is less than halved (Figure 4). This converging pattern is largely a result of the higher ranking regions declining and converging to the national average, in particular Alentejo[15]. In Spain conversely, we observe the strongest trends of regional divergence of all EU member states during the time period. The right side of Figure 4 demonstrates the variation of regions with respect to QoG range has roughly doubled since 2013 as strong performers - Pais Vasco, La Rioja, Navarra - have steadily improved, while regions such as Catalonia, Canarias and Andalucía have declined over time.
Figure 4.
Examples of Regional Convergence and Divergence – Portugal and Spain
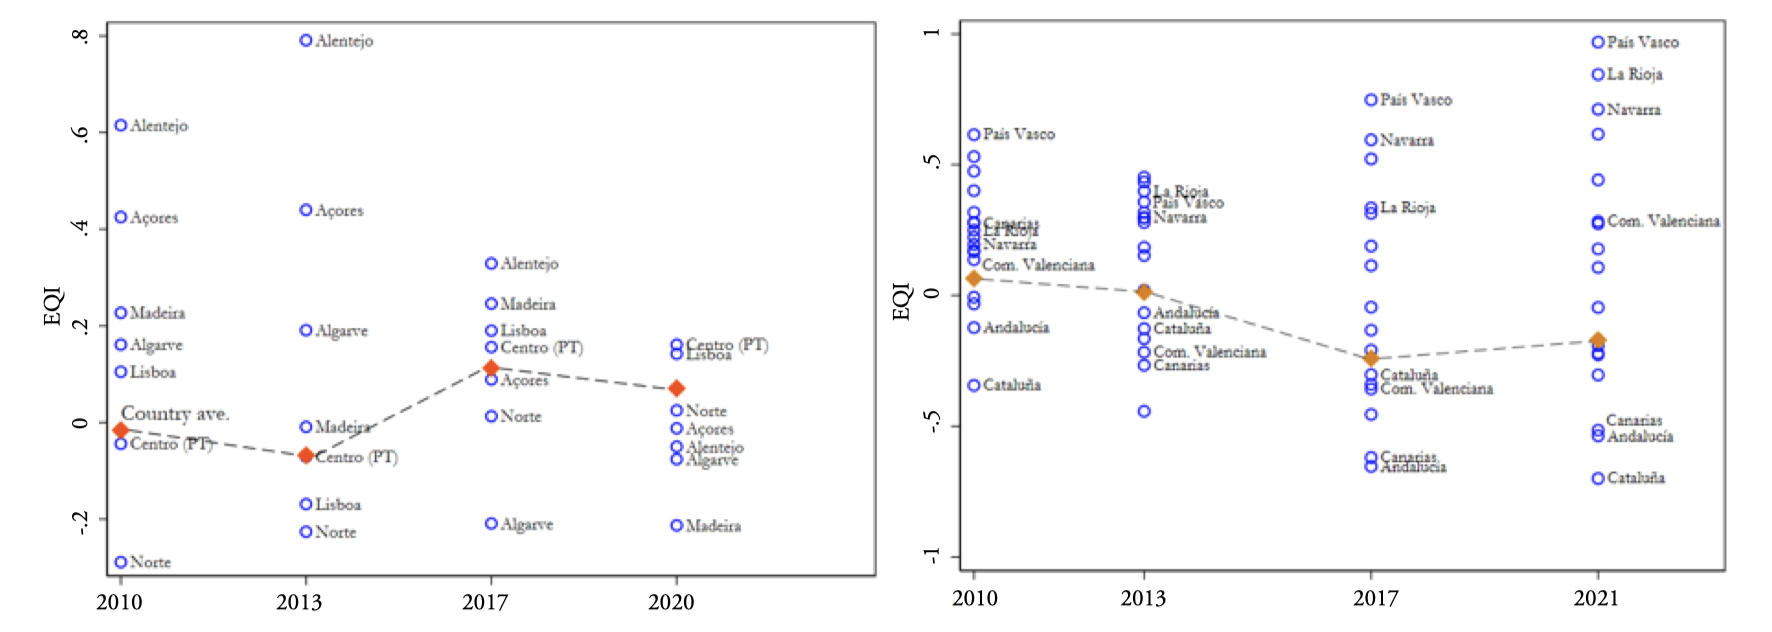
Note: blues circles show regional EQI estimates in Portugal (left) and Spain (right), and red diamond is the population weighted country average of the regional EQI by year. Select regions are noted in Spain.
Finally, we test the dynamic relationship with the EQI and several relevant indicators via cross-sectional, time series panel data analyses. In this case we are not making causal claims, but providing initial descriptive statistical associations over time to stimulate future research. To motivate relevant covariates, we selected key indicators from the EU Cohesion Policy – unemployment rates, GDP per capita (PPP, logged), percentage at risk of poverty, and percentage in material deprivation (from Eurostat, see appendix for more details). We estimate the effects 1) via partial-pooled, random intercept models, which capture the combined spatial and temporal effects of the EQI on our selected outcomes, and 2) via fixed effects models, which capture the average within-regional effects over the 11 year period. In both cases, we include year fixed effects to account for the over trends in key variables and include only a parsimonious set of controls - population density and capital region (for random intercept models).
Table 1.
Measures of Within-country regional dispersion of the EQI over time
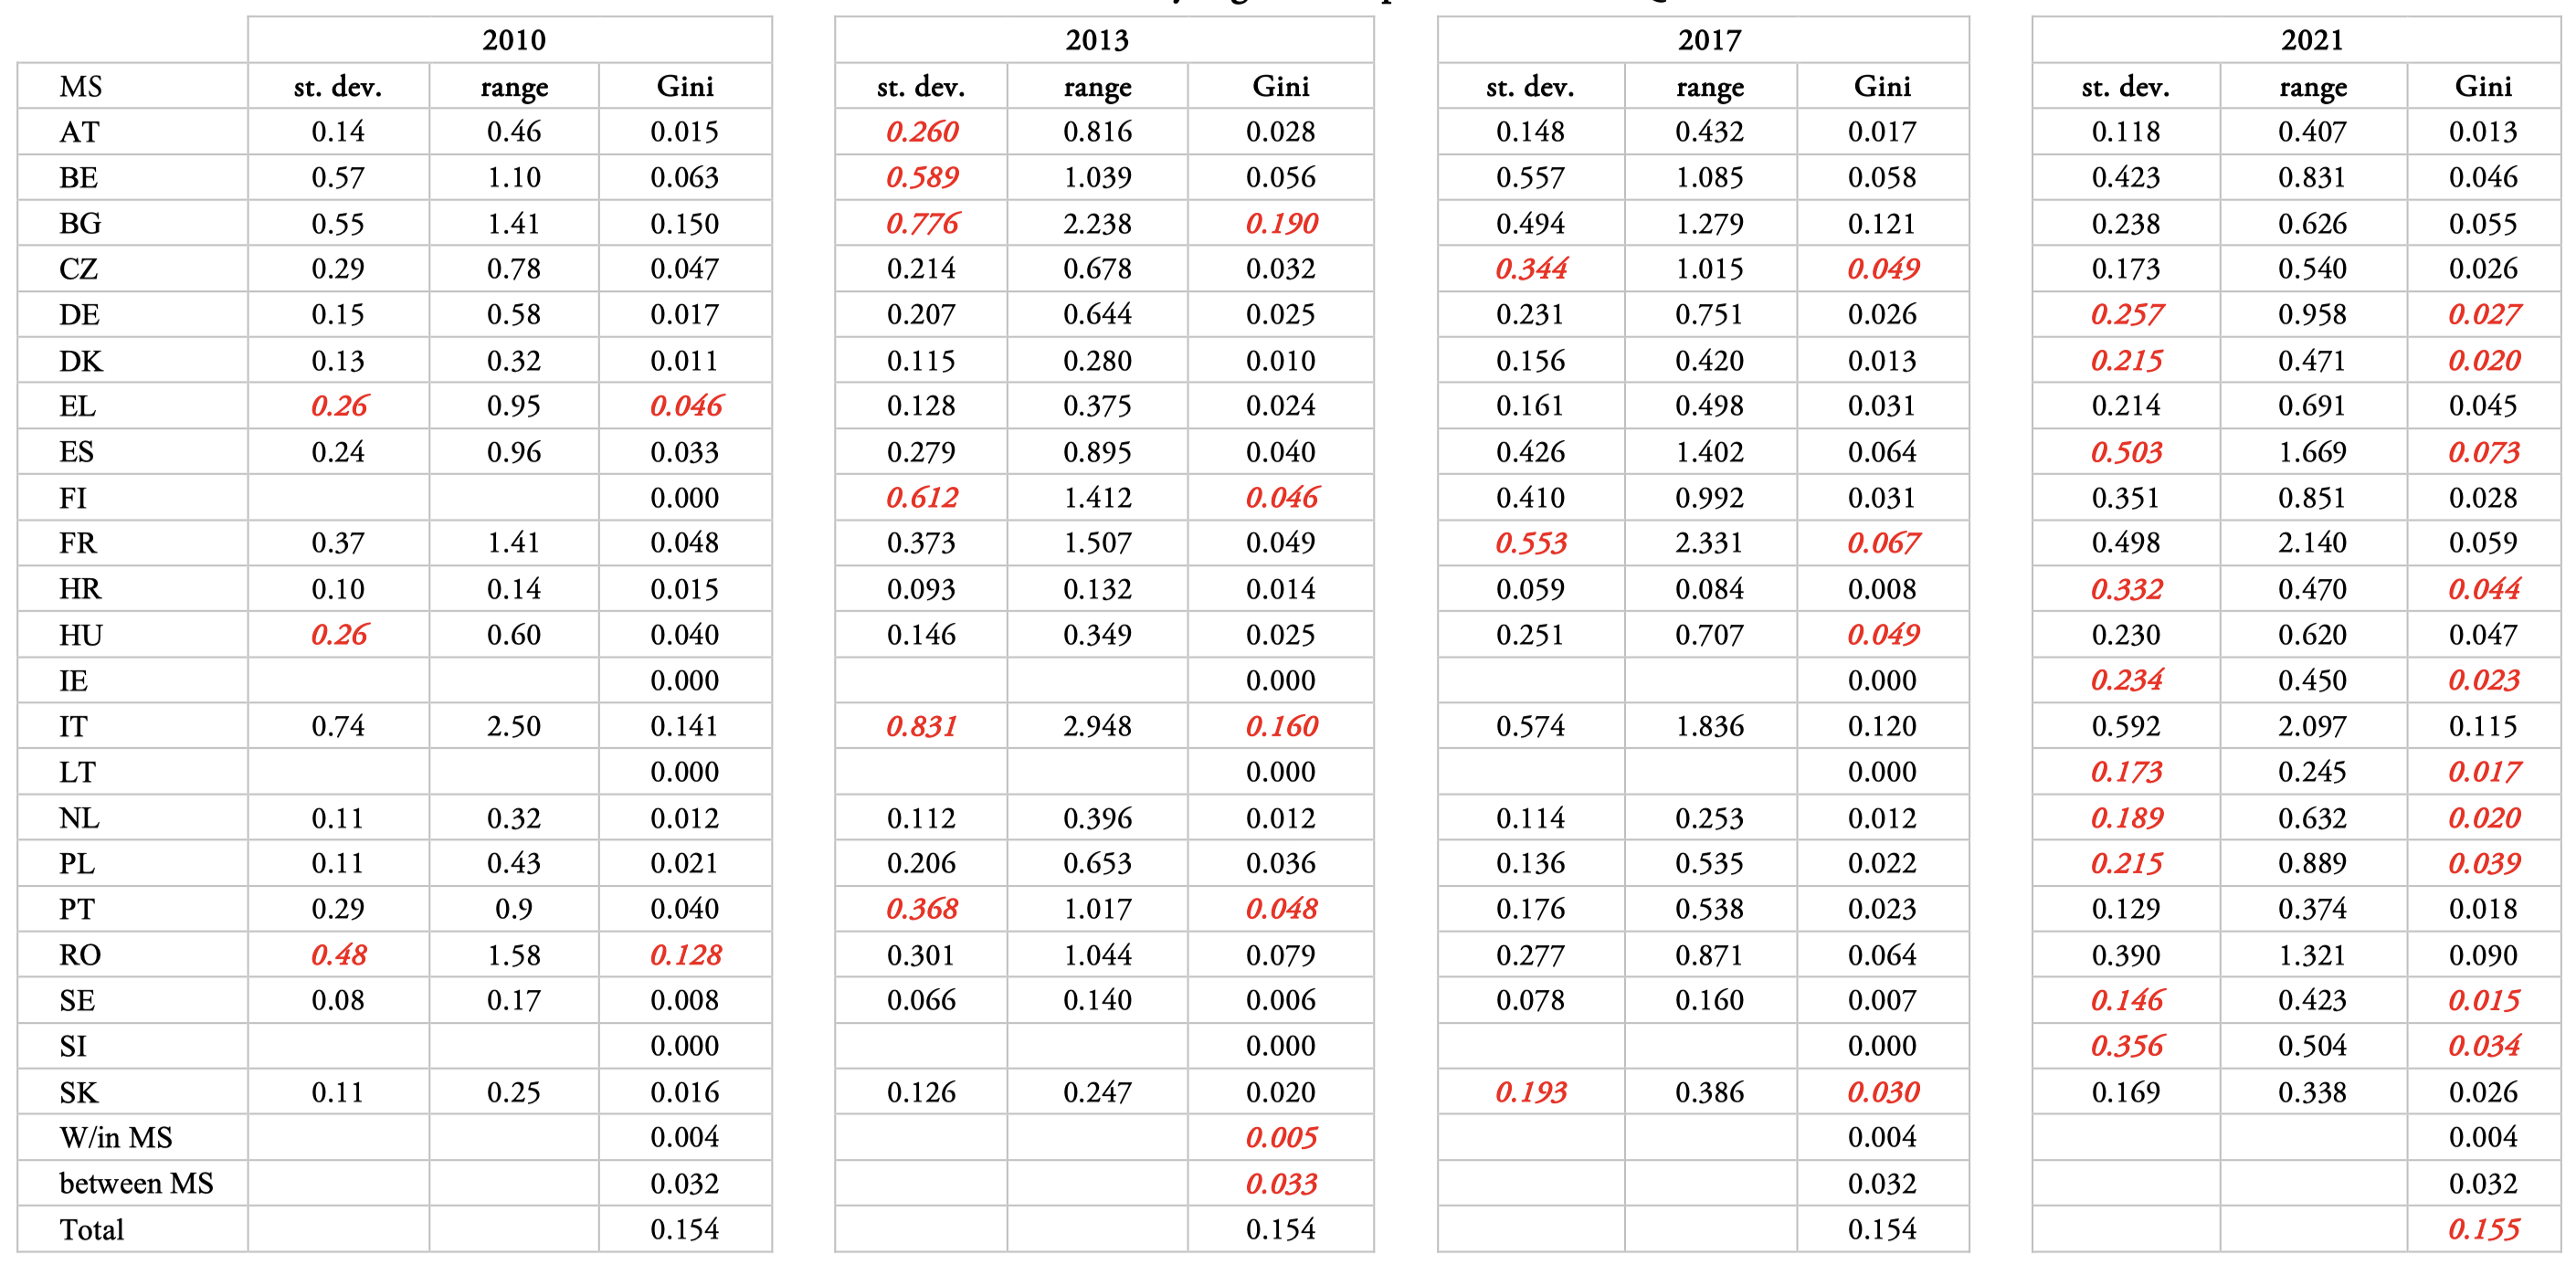
Note: ‘st. dev.’ is the unweighted standard deviation of regional EQI scores within the noted country for the given year. ‘Range’ is the absolute difference in max-min regional score within a country. ‘Gini’ is the Gini coefficient of the re-scored EQI index via ‘ineqdec0’ (Jenkins 2008), whereby we add the absolute value of the most negative observation to avoid negative integers dropping ‘0’ values. Finland, Croatia and Ireland not included in 2010. Ireland’s previous NUTS level regional dispersion from the 2013 and 2017 years discontinued due to NUTS 2 reform between 2017 and 2021. Cyprus, Estonia, Latvia, Luxembourg and Malta not included, due to no years with multiple NIUTS 2 regions. Each country’s highest year of dispersion rate according to st. dev. is highlighted in red.
Table 2 reveals the results. We observe first that in all cases, the EQI is in the direction expected with the outcome variable in question. Second, we see that in the random effects models, the EQI significantly explains variation in all four outcomes. A one standard deviation increase of QoG is associated with a lower unemployment rate by 1.27%, lower at risk for poverty by 3.4%, lower material deprivation by 5% and higher GDP per capita (logged) by 12%. We also observe that when the estimates isolate the average within-unit effects over time (models 5-8), that the effects are on average smaller, yet significant at the 95% level of confidence or higher (save model 5). Overall, although we do not draw directional, causal inferences from these observational results, we do interpret these findings as evidence that the EQI and several salient indicators of socio-economic development are strongly correlated over time.
Table 2.
Testing the effects of the EQI on socio-economic development
| Random intercept models | Fixed effects models | |||||||
| 1 | 2 | 3 | 4 | 5 | 6 | 7 | 8 | |
| Dep. Var. | Unemploy- ment | % poverty | % Material deprivation | GDP p.c.(log) | Unemploy-ment | % poverty | % Material deprivation | GDP p.c.(log) |
| EQI | -1.27*** | -3.35*** | -5.01*** | 0.12*** | -0.42 | -1.85** | -3.02*** | 0.05*** |
| (0.257) | (0.539) | (0.409) | (0.012) | (0.395) | (0.906) | (0.991) | (0.015) | |
| Constant. | 8.514*** | 26.885*** | 10.550*** | 9.92*** | 8.083*** | 21.376*** | 4.222 | 10.019*** |
| (0.38) | (0.83) | (0.66) | (0.02) | (0.86) | (3.51) | (3.84) | (0.04) | |
| σ (region) | 1.51*** | 2.18*** | 1.70*** | -1.23*** | ||||
| (0.05) | (0.05) | (0.06) | (0.05) | |||||
| σ (cons-tant) | 0.85*** | 1.35*** | 1.42*** | -2.46*** | ||||
| (0.02) | (0.04) | (0.04) | (0.03) | |||||
| Year FE’s | ✓ | ✓ | ✓ | ✓ | ✓ | ✓ | ✓ | ✓ |
| Regional FE’s | ✓ | ✓ | ✓ | ✓ | ||||
| Obs. | 809 | 466 | 466 | 698 | 809 | 466 | 466 | 698 |
| R-squared | 0.354 | 0.275 | 0.322 | 0.999 | ||||
Note: marginal effects indicate the change in the dependent variable as a function of a 1 standard deviation increase of the EQI. Robust standard errors, clustered by region in parentheses. Models 1-4 a hierarchical models with random regional intercepts, while models 5-8 are estimated via regional, fixed effects models. Control variables are population density (models 1-8) and capital region (models 1-4). Models include data from 2010, 2013, 2017 and 2021, with 2010 as the reference year. *** p<0.01, ** p<0.05, * p<0.1
Trends in Experience and Perceptions of Regional QoG pre/post Covid-19 onset
Although much research has looked at the relationship between generalized and political trust as causes and consequences of various aspects of the Covid-19 virus (see for example Bol et al 2021; Charron et al 2022; Newton 2020; Oksanen et al 2020) much less has been studied on the relationship between citizen perceptions and experiences with corruption. While this section does not claim to perform exhaustive analysis of the effect of the pandemic on QoG (or QoG on the handling of the pandemic), we present some big picture, ‘birds eye’ differences between previous (pre-Covid) and the 2021 EQI waves. In 2021, Europeans have seen their national, regional and local governments in action in the fight to contain the virus. They have also been highly restricted in their ability to socialize, work and utilize public services. We would thus expect that the experiences and perceptions would be affected the pandemic in some significant ways. Although we leave a more systematic analysis for future research, we explore several simple correlations to establish whether there are any noticeable patterns, highlighting those we find most relevant.
First, we would expect that given the lock-downs, school closures, and restricted access to non-essential services in many areas in the EU, that rates of experiences with petty corruption would go down. Figure 5 shows the relationship between regional rates of petty corruption experiences (proportion ‘yes’) in 2017 and 2021[16]. The figure demonstrates that in most cases (70% of the regions) the rates of personal experience with petty corruption in any of our inquired services was lower in 2021 than in 2017. The overall average dropped from 9.3% in 2017 to 6.1% in 2021[17]. In particular, remarkable decreases are observed in Italian regions, as well as in Czech Republic, Slovakia, Hungary and Bulgaria. However, in some cases, such as in several Romanian regions among others, we find that petty corruption has in fact increased. The most notable case in this instance is the Canary Islands (ES70) in Spain, which increased from 3.5% to 13.6% (p<0.001)[18]. The island region was hit especially hard economically by strict tourism restrictions[19], which likely created significant pressure on the health care system and shortages of goods and services, increasing incentives for informal exchanges (Rose 2015). While this simple analysis does not allow to assess any causal effect per se, the pattern observed suggests that during the pandemic there was a sizeable decline of experiences with petty corruption, as we would anticipate in a pandemic as such.
Second, in Table 3 we also check if the perceptions in quality, corruption and impartiality components have changed since 2017 by sector – education, health care and law enforcement. In this case, rather than the standardized score, we look at the raw regional averages by EQI pillar, as each survey uses the exact same question formulation and question measurement scale. The table reveals several interesting patterns in the data. First, there is positive and significant change from 2017 in terms of perceptions of all service quality – in particular in the health care sector, followed by education. This could be of course because these two sectors in particular were most affected by the pandemic and that people saw their local health care and education institutions in action and quickly responding to the concerns of the virus. Second, these quality perceptions are also accompanied by improved perceptions of (control of) corruption, which certain seems reasonable considering the clear drop in corruption experiences shown in Figure 5. Again, it is the health care sector that benefits most from the positive changes, with the mean regional increase of 0.342 since 2017. Third, we see however that the positive quality and corruption scores are not accompanied by perceptions of impartiality, which dropped from 2017 to 2021, most pronounced by law enforcement, which dropped by -0.212. That people perceive somewhat higher levels of favouritism in law enforcement could reflect a perception that law enforcement permitted some people to evade some of the lockdown measures.
Figure 5.
Regional Rates of Experiences with Petty Corruption: 2017 vs 2021
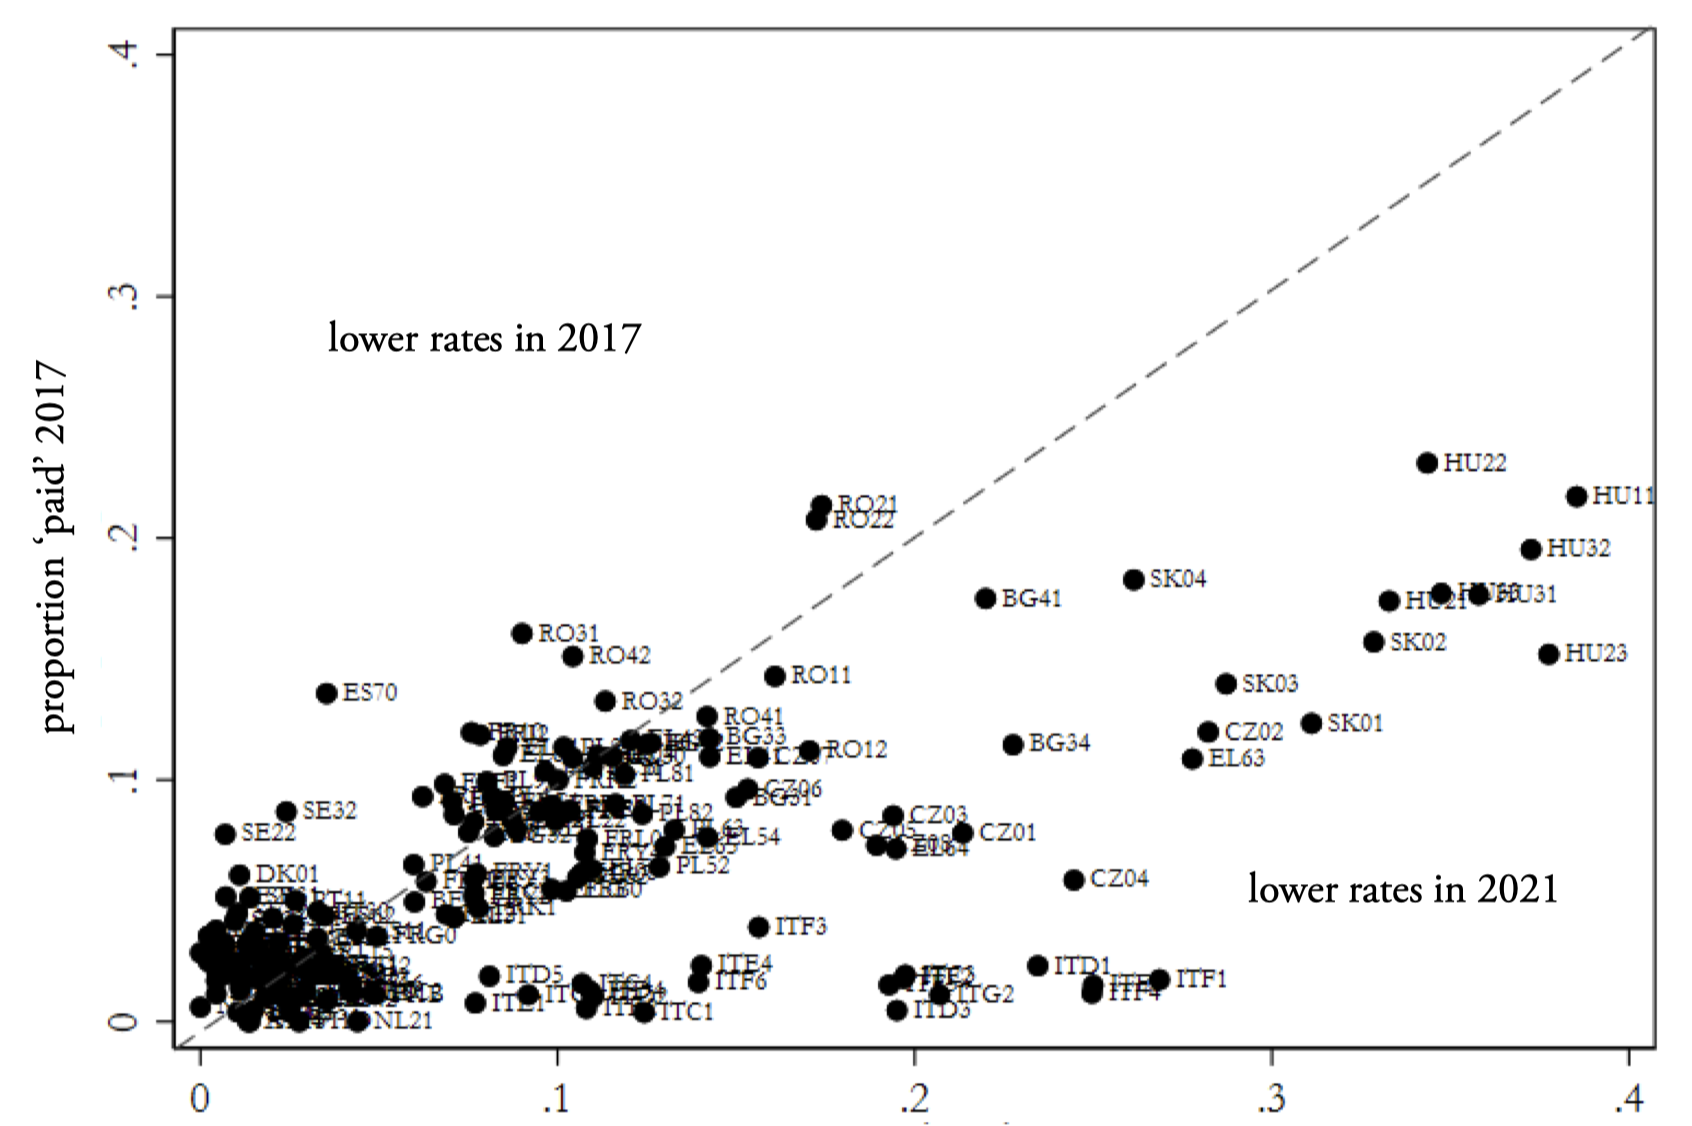
Note: regional estimates aggregated from microdata using post-stratification weights.
Table 3.
Averages of 3 EQI Pillars by Service (Raw Scores)
| Variable | 2017 | 2021 | Difference | p-value |
| QUALITY | ||||
| Education | 6.426 | 6.692 | .265 | 0.000 |
| Health Care | 6.211 | 6.553 | .342 | 0.000 |
| Law enforcement | 6.557 | 6.666 | .109 | 0.000 |
| IMPARTIALITY | ||||
| Education | 5.993 | 6.109 | .035 | 0.001 |
| Health Care | 5.477 | 5.581 | -.103 | 0.008 |
| Law enforcement | 6.313 | 6.101 | -.212 | 0.000 |
| CONTROL OF CORRUPTION | ||||
| Education | 7.317 | 7.108 | .208 | 0.000 |
| Health Care | 6.487 | 6.824 | .336 | 0.000 |
| Law enforcement | 6.742 | 6.859 | .116 | 0.004 |
Note: averages are across regions for all common EQI regions in both 2017 and 2021 (n=195). Higher scores equate to higher QoG on all indicators, scored 1-10. Significance tests are simple differences of means.
Conclusion and Discussion
Does the quality of government change over time? This study analyses the results of the most comprehensive survey to date to measure the perceptions of quality of government, the EQI 2021, and compared the results to previous rounds of this survey. The 2021 survey collects the opinions of over 129,000 respondents in a total of 208 NUTS 1 and NUTS 2 regions in all EU 27 member state countries. Since this survey builds on previous rounds of the survey (2010, 2013 and 2017) it also allows for systematic analysis of shifts over time and how both changes and inertia can be explained, as well as an analysis on a range of potential determinants, also including variables related to the recent Covid-19 pandemic. This allows for several new insights into the quality of public services in three of the public service sectors; health care, education and law enforcement
In this paper, we highlight some of the main results of the EQI 2021 survey and changes in the data vis-à-vis previous rounds, and suggest venues for future research for studies using this data. Despite widespread concerns over the ‘stickiness’ of corruption levels (see i.e Heywwod and Rose 2014; Person et al 2013; Bauhr 2017; Charron 2021), the results show that regional level quality of government does indeed change over time, both across regions in Europe and between regions within the same country. In all, citizens’ perceptions of the QoG as well as their experiences with public services has shown some clear improvements between the 2017 and 2021 round of the survey. Citizens rate the quality of public service delivery higher and report lower level of bribing and other forms of corruption. We also find that the geography of regional QoG is slowly shifting. While several Eastern European regions seem to be on a rise, several southern European regions see a marked decline. Interestingly we see a remarkable convergence between regions in some countries, while we see a divergence within others, indicating that the relative ranking among regions within countries are far from stable. However, despite the potential optimism suggested by the overall trend in this survey compared to previous rounds, it is also important to note the decline in the EQI in most regions in Poland and Hungary relative to the EU average. Infringements on media rights and the independence of the judiciary system may explain this drop, much in line with evidence on such infringements being detrimental to containing corruption in democracies (Bauhr and Grimes 2021).
This survey also provides an opportunity to analyze perceptions of the Covid 19 pandemic, since it is, to the best of our knowledge, the survey with the greatest regional coverage of citizens perceptions of the Covid 19 pandemic to date. It thereby allows for a systematic analysis of regional levels of quality of government and Covid 19 outcomes, such as excess mortality due to Covid-19, which studies show vary considerably within European countries (Rodríguez‐Pose and Burlina 2021). Our analysis indicates that citizens in regions with higher quality of government are less worried about the economic and health consequences of the pandemic, and are more likely to perceive that their authorities have handled the crises well. In particular, past levels of corruption perceptions are strongly related to economic worries due to Covid -19. The Covid 19 pandemic also seems to be related to perceptions of improved health care in Europe, as the salience and performance of domestic institutions could have increased (Hetherigton and Husser, 2012; Hetherington and Rudolph 2008). This could also potentially be explained by a “rally around the flag” effect (Mueller 1970; Bol et al. 2020), i.e. that citizens express a form of empathy towards their leaders in a time when they perceive themselves to be vulnerable and dependent upon leadership and public service delivery. At the same time, the documented decreases in bribery levels experienced in several public service sectors may partly be explained by more limited interactions with public service providers due to lockdowns and restrictions. Further investigations, such as future rounds of this survey, may answer the big underlying question: will these positive trends will last over time?
The important link between corruption levels and the extent to which citizens worry about the economic consequences of the pandemic provides evidence that the slow shift in the geography of QoG may also lead to a slow shift in the geography of citizens concerns about their future. It is therefore of imperative importance to continue to explore the causes and sometimes dire consequences of low quality of government. What explains the rise in quality of government in many eastern European regions? Why are many southern European regions lagging behind, some of them so highly socioeconomically developed as Catalonia? Why are some countries diverging (such as Spain) while others are converging? How and why do some regions succeed in maintaining relatively good quality of government in countries that are affected by democratic backsliding?
By providing this freely available indicator, we hope to encourage other scholars of economic geography, political science and Europeanists, inter alia, to explore these and other salient questions. This should include an in-depth analysis on how and why regions evade the stickiness of quality of government, and, in particular, when and how such shifts can lead to positive improvements in citizens-state interactions and the provision of public services, since, as our analysis indicates, the importance of geography does not imply determinism. Future research should also explore other interesting patterns that seem to emerge from this data, such as the stark and noticeable variation in the scores of EUs capital regions, with some capital regions being way below their country mean (i.e. Romania, Poland, Hungary, Bulgaria, and Slovakia), while others are significantly higher (i.e. Czech Republic, Lithuania and Slovenia). Many puzzles thus come our from this data which both confirm and challenge conventional views on why some governments can, or cannot, improve.
References
Adcock, Robert and David Collier (2001). “Measurement validity: A shared standard for qualitative and quantitative research”. In: American political science review, pp. 529–546.
Annoni, P., & Charron, N. (2019). Measurement assessment in cross-country comparative analysis: Rasch modelling on a measure of institutional quality. Social Indicators Research, 141(1), 31-60.
Bågenholm, A., Bauhr, M., Grimes, M., & Rothstein, B. (2021). The Oxford Handbook of Quality of Government. Oxford University Press.
Barca, F., McCann, P., & Rodríguez‐Pose, A. (2012). The case for regional development intervention: place‐based versus place‐neutral approaches. Journal of regional science, 52(1), 134-152.
Bauhr, M., & M. Grimes (2021). Democracy and Quality of Government. In Bågenholm, Andreas, Monika Bauhr, Marcia Grimes and Bo Rothstein. 2021. The Oxford Handbook of Quality of Government. Oxford University Press.
Bauhr, M. (2017). Need or greed? Conditions for collective action against corruption. In: Governance 30.4, pp. 561–581.
Bauhr, M., & Charron, N. (2019). The EU as a Savior and a Saint? Corruption and Public Support for Redistribution. Journal of European Public Policy 0 (0), 1–19. https://doi.org/10.1080/13501763.2019.1578816
Bauhr, M., & Charron, N. (2018). Why support International redistribution? Corruption and public support for aid in the eurozone. European Union Politics, 19(2), 233-254. https://doi.org/10.1177/1465116518757702
Bol, D., Giani, M., Blais, A., & Loewen, P. J. (2021). The effect of COVID-19 lockdowns on political support: Some good news for democracy? European Journal of Political Research, 60(2), 497–505.
Bono, F. (2021). El director de la Agencia Valenciana Antifraude: El gran triunfo de la corrupción es convencer de su normalidad a parte de la sociedad. 13-10-2021.
Brinklow, L., Ellsmoor, J., Randall, J., Rouby, M., Sajeva, G., Shetye, A., & Sindico, F. (2021). COVID 19 Island Insights Series Final Report. University of Strathclyde Center for Environmental Law and Governance.
Burlina, C., & Rodríguez-Pose, A. (2020). Institutions and the uneven geography of the first wave of the COVID-19 pandemic. LSE. Paper No. 16 Geography and Environment Discussion Paper Series.
Charron, N. (2021). Measuring the unmeasurable? Taking stock of QoG measures. A. Bågenholm, M. Bauhr, M. Grimes, B. Rothstein (Eds.), The Oxford Handbook of the Quality of Government, Oxford University Press, pp. 93-114
Charron, N., Dijkstra, L., & Lapuente, V. (2014). Regional governance matters: Quality of government within European Union member states. Regional studies 48(1), 68–90.
Charron, N., Dijkstra, L., & Lapuente, V. (2015). Mapping the regional divide in Europe: A measure for assessing quality of government in 206 European regions. Social indicators research 122(2), 315–346.
Charron, N., Lapuente, V., & Annoni, P. (2019). Measuring quality of government in EU regions across space and time. Papers in Regional Science 98(5), 1925–1953.
Charron, N., Lapuente, V., & Rothstein, B. (2013). Quality of Government and Corruption Form a European Perspective: A Comparative Study of Good Governance in EU Regions. Edward Elgar Publishing.
Charron, N., Lapuente, V., & Rodriguez-Pose, A. (2022). Uncooperative Society, Uncooperative Politics or Both? Trust, Polarisation, Populism and COVID-19 Deaths across European regions. European Journal of Political Research. https://doi.org/10.1111/1475-6765.12529
Charron, N., Lapuente, V., & Bauhr, M. (2021). Sub-national Quality of Government in EU Member States: Presenting the 2021 European Quality of Government Index and its relationship with Covid-19 indicators. QoG working paper series 2021,4.
Devine, D., Gaskell, J., Jennings, W., & Stoker, G. (2020). Trust and the Coronavirus Pandemic: What are the Consequences of and for Trust? An Early Review of the Literature. Political Studies Review. https://doi.org/10.1177/1478929920948684
Dijkstra, L., Poelman, H., & Rodríguez-Pose, A. (2020). The geography of EU discontent. Regional Studies, 54(6), 737-753.
Drápalová, E., & Mascio, F. D. (2020). Islands of Good Government: Explaining Successful Corruption Control in Two Spanish Cities. Politics and Governance, 8 (2), 128–139
European Union. (2019). Directive (EU) 2019/1937 of the European Parliament and of the Council of 23 October 2019 on the protection of persons who report breaches of Union law. Retrieved June 22, 2022. from https://eur-lex.europa.eu/legal-content/EN/TXT/PDF/?uri=CELEX:32019L1937
Factor, R., & Kang, M. (2015). Corruption and population health outcomes: an analysis of data from 133 countries using structural equation modeling. International Journal of Public Health 60, 633–641. https://doi.org/10.1007/s00038-015-0687-6
Farole, T., Rodríguez-Pose, A., & Storper, M. (2011). Cohesion Policy in the European Union: Growth, Geography, Institutions. Journal of Common Market Studies 49(5), 1089-1111.
Fazekas, M., & Kocsis, G. (2020). Uncovering high-level corruption: cross-national objective corruption risk indicators using public procurement data. British Journal of Political Science 50(1), 155–164.
Gasparet, M. (22 de mayo de 2018). Los 17 casos de corrupción que han hundido al PP en Valencia. El Español.
Glaeser, E. (2011). Triumph of the City. Pan Macmillan.
Heerwegh, D. (2009). Mode differences between face-to-face and web surveys: an experimental investigation of data quality and social desirability effects. International Journal of Public Opinion.
Hellmeier, S., Cole, R., Grahn, S., Kolvani, P., Lachapelle, J., Lührmann, A., & Lindberg, S. I. (2021). State of the world 2020: autocratization turns viral. Democratization, 28(6), 1053-1074.
Hetherington, M.J., & Husser, J.A. (2012). How Trust Matters: The Changing Political Relevance of Political Trust. American Journal of Political Science 56(2), 312–325.
Hetherington, M.J., & Rudolph, T.J. (2008). Priming, Performance, and the Dynamics of Political Trust. The Journal of Politics 70(2), 498–512.
Heywood, P. M., & Rose, J. (2014). Close but no Cigar: the measurement of corruption. Journal of Public Policy, 34(3), 507-529.
Holmberg, S., Rothstein, B., & Nasiritousi, N. (2009). Quality of Government: What You Get. Annual Review of Political Science 12, 135-161.
Holmberg, S., & Rothstein, B. (2011). Dying of corruption. Health Economics, Policy and Law, 6(4), 529-547. https://doi.org/10.1017/S174413311000023X
Iammarino, S., Rodriguez-Pose, A., & Storper, M. (2019). Regional inequality in Europe: evidence, theory and policy implications. Journal of economic geography, 19(2), 273-298.
Iammarino, S., Rodríguez-Pose, A., & Storper, M. (2019). Regional inequality in Europe: evidence, theory and policy implications. Journal of economic geography, 19(2), 273-298.
Jiménez-Asensio, R. (2021). Calidad de Gobierno de las Comunidades Autónomas. Retrieved June, 22, 2022 from https://rafaeljimenezasensio.com/2021/05/23/calidad-de-los-gobiernos-de-las-comunidades-autonomas/
Kaufmann, D., Kraay, A., & Mastruzzi, M. (2009). Governance matters VIII: aggregate and individual governance indicators, 1996-2008. World bank policy research working paper, 4978.
Kaufmann, D., Kraay, A., & Mastruzzi, M. (2011). The Worldwide Governance Indicators: Methodology and Analytical Issues1. Hague journal on the rule of law, 3(2), 220-246.
Kreuter, F., Presser, S., & Tourangeau, R. (2008). Social desirability bias in cati, ivr, and web surveysthe effects of mode and question sensitivity. Public opinion quarterly 72(5), 847–865.
Marco, L., & Martínez; L. (15 de abril de 2022). El País Valenciano se despide del lastre reputacional de la corrupción: escala a la sexta posición en calidad pública. Diario.es.
McCann, P. (2020). Perceptions of regional inequality and the geography of discontent: Insights from the UK. Regional Studies, 54(2), 256–267.
McCann, P., Ortega-Argilés, R., & Yuan, P. Y. (2021). The Covid-19 shock in European regions. Regional Studies, 1-19.
McDonnel, E. M. (2020). Patchwork Leviathan: Pockets of Bureaucratic Effectiveness in Developing States. Princeton University Press.
Newton, K. (2020). Government communications, political trust and compliant social behaviour: the politics of Covid‐19 in Britain. The Political Quarterly, 91(3), 502-513.
OECD (2016). Regions at a Glance 2016. OECD Publishing.
Oksanen, A., Kaakinen, M., Latikka, R., Savolainen, I., Savela, N., & Koivula, A. (2020). Regulation and Trust: 3-Month Follow-up Study on COVID-19 Mortality in 25 European Countries. JMIR Public Health and Surveillance, 6(2), e19218.
Persson, A., Rothstein, B., & Teorell, J. (2013). Why Anticorruption Reforms Fail—SystemicCorruption as a Collective Action Problem. Governance, 26(3), 449–471. https://doi.org/10.1111/j.1468-0491.2012.01604.x
Rodríguez-Pose, A. (2018). The revenge of the places that don't matter (and what to do about it). Cambridge Journal of Regions, Economy and Society, 11(1), 189–209.
Rodríguez‐Pose, A. (2020). Institutions and the fortunes of territories. Regional Science Policy & Practice, 12(3), 371-386.
Rodríguez‐Pose, A., & Burlina, C. (2021). Institutions and the uneven geography of the first wave of the COVID‐19 pandemic. Journal of Regional Science, 61(4), 728-752.
Rose, R. (2015). Reducing bribery for public services delivered to citizens. U4 Brief.
Pinzón-Flórez, C.E., Fernández-Niño, J.A., Ruiz-Rodríguez, M., Idrovo, Á.J., Arredondo López, A. A. (2015). Determinants of Performance of Health Systems Concerning Maternal and Child Health: A Global Approach. PLoS ONE 10(3), e0120747. https://doi.org/10.1371/journal.pone.0120747
Ritchie, H., Mathieu, E., Rodés-Guirao, L., Appel, C., Giattino, C., Ortiz-Ospina, E., Hasell, J., Macdonald, B., Beltekian, D., & Roser, M. (2020). Coronavirus Pandemic (COVID-19). Published online at OurWorldInData.org. Retrieved from https://ourworldindata.org/coronavirus
Información adicional
Clasificación JEL: H70; H75; R11; R5; I3