European Regional Policy
Does European Cohesion Policy affect Regional Business Dynamics?
Does European Cohesion Policy affect Regional Business Dynamics?
Investigaciones Regionales - Journal of Regional Research, núm. 57, pp. 5-31, 2023
Asociación Española de Ciencia Regional
Recepción: 30 Marzo 2023
Aprobación: 01 Junio 2023
Abstract: This paper assesses whether European Cohesion Policy funds from the 2007‑2013 programming period affected business dynamics in European regions. Using a regression discontinuity approach, the analysis shows that regions receiving more funds experienced higher firm births, without statistically significant firm deaths, resulting in positive net firm creation and growing firm-related employment. In addition, this study confirms previous findings in the literature according to which regions receiving more funds show higher increases in gross value added per worker. Finally, funds have a significantly higher effect on net business employment creation in regions with lower levels of perceived corruption, although this is not necessarily conductive to higher levels of labour productivity in those regions.
Keywords: Regional Policy, cohesion funds, business dynamics.
Resumen: Este documento evalúa si los fondos de la Política de Cohesión Europea del período de programación 2007-2013 afectaron la dinámica empresarial en las regiones europeas. Usando un enfoque de discontinuidad de regresión, el análisis muestra que las regiones que reciben más fondos experimentaron un mayor nacimiento de empresas, sin muertes de empresas estadísticamente significativas, lo que resultó en una creación neta de empresas positiva y un aumento del empleo relacionado con las empresas. Además, este estudio confirma hallazgos previos en la literatura según los cuales las regiones que reciben más fondos muestran mayores incrementos en el valor agregado bruto por trabajador. Finalmente, los fondos tienen un efecto significativamente mayor en la creación neta de empleo empresarial en regiones con niveles más bajos de corrupción percibida, aunque esto no conduce necesariamente a niveles más altos de productividad laboral en esas regiones.
Palabras clave: Política regional, fondos de cohesión, dinámica empresarial.
1. Introduction
The EU Regional Policy is a large fiscal transfer system representing a major pillar of the integration strategy of the European Union and its largest investment programme. Such a programme is mainly delivered through three types of funds: the European Regional Development Fund (ERDF), the European Social Fund (ESF) and the Cohesion Fund (CF). These three types of funds together are referred to as the European Cohesion Policy (CP). Broadly speaking, the objective of the EU Cohesion Policy is to reduce economic and structural disparities between regions and countries within the EU’s single market. More than one third (36%) of the EU budget in 2007‑2013 (€346.5 billion) was dedicated to these funds, targeted mainly – but not only – to the less economically developed European regions (European Union, 2013).
Because of the political relevance and economic magnitude of the EU Cohesion Policy, many studies have investigated the impact of these funds on recipient regions and the EU overall. Most of the literature has focused on two questions: (i) Have transfers induced economic improvements in recipient regions? (e.g., in employment, see Giua, 2017; or in accessibility and patents, see Ferrara et al., 2017), and (ii) Have transfers enabled less developed regions to catch-up with the most developed ones through higher growth rates (i.e. contributed to regional convergence)? One of the main EU’s funding allocation rules requires being under a given threshold in the level of a region’s GDP per capita relative to the GDP per capita of the EU.[1] Such a rule has been used to address the above questions from an empirical point of view, including in the study by Becker et al. (2010), one of the most known in the literature.
Earlier studies have demonstrated that the EU Cohesion Policy positively affects GDP per capita growth (e.g., Becker et al., 2010, 2012, 2013 and 2018; Ramajo et al., 2008, Mohl and Hagen, 2010; Pellegrini et al., 2013; Barone et al., 2016; Gagliardi and Percoco, 2016; Crescenzi and Giua, 2019). However, little is known about the exact mechanisms through which funds influence regional economic growth (Berkowitz et al., 2019). One possible mechanism underlying the economic effects of EU Cohesion Policy that has been practically neglected in the literature concerns business dynamics. We define business dynamics as the process of change in the population of active firms and their employment generated by new firm creation, deaths of existing ones and the resulting business churning in each region.
The main objective of this paper is to assess whether the EU’s Cohesion Policy affects business dynamics and whether quality of institutions mediates such relationship. Specifically, we examine the impact of funds on the births and deaths of firms and the jobs generated and destroyed through these events.
We identify empirically the causal effect of EU Cohesion Policy on regional business dynamics by employing a regression discontinuity design that compares NUTS-2 regions that are similar in economic, demographic, and geographical characteristics but differ substantially in the amount of funds for which they are eligible. We show that regions that spend more EU funds record positive firm birth rates and close to zero firm death rates, which translates into higher rates of net firm creation and increased employment. This creation of new firms and jobs can raise competition, stimulating innovation and a better reallocation of resources. Our analysis confirms also previous results from the literature that Cohesion funds positively affects regional labour productivity. Therefore, our results might suggest that the business dynamics and resulting change in the population of active firms is one of the mechanisms driving such effect on productivity. Finally, we find that for southern European regions, higher institutional quality – as measured in terms of lower corruption – is likely to enhance the effectiveness of funds on business employment. On average, in regions where corruption is lower, funds have a significantly higher effect on the rates of net business employment creation.
The remainder of the paper is organised as follows, section 2 briefly discusses the relevance of Regional Business Dynamics (RBD) for regional development and provides the background of the EU Cohesion Policy funds. Section 3 describes the data we use in our study and provides some key summary statistics, while section 4 explains our identification strategy and empirical model. The results and conclusions are discussed in the last two sections, while selected robustness checks are summarised in the annex.
2. Regional Business Dynamics and Cohesion Policy Funds
2.1. Regional Business Dynamics
The important role of business dynamics for economic growth and productivity through the process of creative destruction has been documented by both theoretical (Schumpeter, 1942; Aghion and Howitt, 1990) and empirical work (Foster et al., 2001; Asturias et al., 2019; Alon et al., 2018; OECD, 2017).
The entry of new firms into the market can trigger productivity through different channels. For example, new businesses increase competition and are likely to introduce new technologies, processes and organization forms into the economy. The entrance of new, competitive firms in a regional economy can boost productivity. This can happen both through replacing less‑productive incumbent firms (churning or creative destruction), or through pushing incumbent firms to adapt and become more efficient (Aghion et al., 2005; Nickell, 1996), in which case productivity can be enhanced without firm destruction. What is more, business creation without (or with less) firm destruction is likely to generate higher levels of employment if jobs are maintained in the incumbent firms.
In the EU, annual regional business creation constitutes around 10.5% of the total existing firms. Nevertheless, cross-regional disparities are stark. For instance, while in some European regions new businesses represent more than 20% of the existing businesses, firm creation accounts for less than 5% of the active firms in the least dynamic regions. What is more, regional business destruction is also high in the EU, with average levels that go up to 9.1% with respect to existing firms, leading to levels of net business creation that range from ‑4% to 8% across regions. New firms also contribute significantly to regional employment growth. On average, the jobs created by new firms every year represent 3.4% of the total existing jobs in active firms; in some regions, this can go up to 7.4% (Table 1).
Previous research has shown the importance of access to finance for business creation and entrepreneurship (Evans and Jovanovic, 1989; Kerr and Nanda, 2009). Since capital is crucial to start a new business, financial constraints tend to exclude potential entrepreneurs and limit the creation of new firms. What is more, access to funds is also essential for firms to innovate and grow. In this respect, the literature has documented a positive relationship between access to finance and firm performance, including for SMEs and start-ups (Rajan and Zingales, 1998; Cabral and Mata, 2003; Guiso et al. 2005).
2.2. Cohesion Policy Funds 2007-2013
With the overarching objective of ensuring economic, social and territorial cohesion across its regions, the EU created the Cohesion Policy, a financial instrument that supports a broad range of policy areas including SMEs, jobs and skills, and infrastructure. Cohesion Policy encompasses three types of funds, the European Regional Development Fund (ERDF), the European Social Fund (ESF) and the Cohesion Fund (CF). For the programme period 2007‑2013, Cohesion Policy funds represented close to €347 billion – of which 58% corresponded to ERDF, 22% to ESF and 20% to CF. Since all Cohesion Policy projects are co‑financed by national or regional stakeholders, the total expenditure in EU regions associated to this policy amounted to €700 billion in the whole period (European Union, 2013).
General objectives
For the programming period 2007-2013, Cohesion Policy financed EU regional policy within the three main objectives of 1) Convergence, 2) Regional competitiveness and employment and 3) European territorial cooperation (European Union, 2014).
1. Convergence: this objective (hereafter also referred to as objective 1) aims at triggering growth in the least developed EU countries and regions for them to catch up faster with the EU average. Around 81.5% of the total CP funds were allocated to this objective. Public expenditure co-financing this objective is limited to 75% of the ERDF and ESF, and to 85% of the CF.
2. Regional competitiveness and employment: this objective seeks to enhance regional competitiveness and attractiveness and to promote regional employment. To achieve this, objective 2 focuses on boosting innovation and entrepreneurship, as well as promoting environmental protection and the development of labour markets. It mainly pertains regions not classified as the least developed ones (from objective 1). The European Commission (EC) has allocated 16% of the total CP funds to this objective. The co-financing of this objective is limited to 50% of the public expenditure.
3. European territorial cooperation: objective 3 (also known as INTERREG programme) aims at strengthening cross‑border, transnational and inter-regional cooperation. It supports the collaboration of neighbouring regional administrations to find common solutions for development and promotes economic relations and networking between small and medium-sized enterprises (SMEs) across regions. Only 2.5% of the total CP funds are assigned for this objective. Co‑financing for territorial cooperation is allowed up to 75% of total public expenditure.
While objective 1 on convergence can benefit from the three types of Cohesion Policy funds (i.e. ERDF, ESF and CF); objective 2 on competitiveness and employment can use resources only from the ERDF and the ESF, and objective 3 on territorial cooperation is financed only through the ERDF (for more details see European Union, 2014).
Management, Allocation and Beneficiaries
The implementation of Cohesion Policy funds is based on a shared management system between the EU, national governments and regional administrations (European Commission, 2017). EU states have the responsibility of setting Management and Control Systems (MCS) for Operational Programs (OPs). These MCS must align with EU regulations and need to be validated by the European Commission (EC). OPs can be defined as the implementation channels of one of the three Cohesion Policy objectives through a single or multiple funds.
Each EU state has to delegate the administration of Operational Programs to specific Managing Authorities (MAs). MAs are typically hosted by government bodies, such as Ministries, and or by regional administrations – the latter generating Managing Authorities for Cohesion Policy at the regional level (OECD, 2020). Besides MAs, EU states have to designate a Certifying Authority (CAs) and an Audit Authority (AAs) – corresponding to a national, regional or local public authority or body. While CAs are in charge of certifying statements of expenditure and applications for payment before they are sent to the EC, the AAs are in charge of auditing the functioning of the management and control system (European Union, 2014).
Beyond the management and controls of the transfer system, the planning and delivery of all Cohesion Policy related projects is typically ensured by partnerships between the EU, national and regional administrations, and numerous local stakeholders, including NGOs, universities and the civil society (European Commission, 2017).
A wide range of legal entities can benefit from EU Cohesion Policy funding, including public and private sector organizations, universities, NGOs, and other types of civil society associations. In practice, however, most beneficiaries are businesses – 120 000 start‑ups and 400 000 SMEs in the period 2007-2013 (European Commission, 2016) – and government authorities (e.g., ministries, regional governments and municipal administrations).
Nevertheless, the allocation and expenditure of funds varies widely across regions. For example, in the period 2007-2013, some regions benefited and spent less than €1 million of CP, while the most supported regions received and spent over €1 billion (Table 1). This heterogeneity in the expenditure of funds is explained by the 2007-2013 allocation rules: regions with a GDP per capita (in euros PPP, average 2000-2002) lower than the 75% of the GDP per capita of the EU25 were entitled to more ERDF and ESF, while regions of countries with a GNI per capita (in euros PPP, average 2001-2003) lower than 90% of the EU25 received more CF. It is worth noting that while all regions can access ERDF and ESF, only the regions from the least developed countries can benefit from CF.
European Regional Development Fund
The ERDF contributes to the three main objectives of Cohesion Policy by providing:
· Investments in companies (mainly SMEs and start-ups) to create sustainable jobs;
· Investments in infrastructures, in particular related to innovation, R&D, telecommunications, transport, energy and the environment;
· Financial instruments to support regional and local development (including support and services for SMEs);
· Other technical assistance measures (European Union, 2013).
European Social Fund
The ESF, characterized by a strong focus on human capital, finances projects that contribute to the first two objectives of Cohesion Policy. More concretely, this fund supports:
· Adaptation of workers and enterprises, for example, through training and lifelong learning programs, as well as promoting innovative working schemes;
· Access to jobs for the unemployed, women, migrants and other groups;
· Integration of vulnerable or disadvantaged groups into the labour market by combating discrimination;
· The improvement of educational systems and teaching networks to enhance human capital (European Union, 2013).
Cohesion Fund
The CF only supports projects directed to the achievement of CP’s objective 1, with a strong focus on sustainable development. The infrastructure projects financed by CF relate to:
· Transport systems (including trans-European transport networks);
· The environment (including sustainable development) (European Union, 2014).
3. Data
The data for our main explained variables, which correspond to indicators of firm births and deaths (as a share of the number of active firms) as well as the resulting creation or loss of employment (as a share of the employment of active firms), were taken from Eurostat’s database on regional business demography (Eurostat, 2018). This database provides annual regional statistics for European regions (NUTS-2 and NUTS-3 level) for the period 2008 to 2014. On top of the space and time dimensions, the indicators are also disaggregated by economic sector (10 sectors following NACE Rev.2) and by type of firm (employer and non-employer firms). In the EU, regional business creation represented around 10.5% of the total active firms in the period 2008‑2014. However, business destruction was also high and amounted for 9.1% of the existing firms, leading to average levels of net business creation of 1.4% (Table 1).
To examine the effects of EU’s Cohesion Policy (i.e., ERDF, ESF and CF) for the budget cycle of 2007 to 2013, we use data provided by the EC (European Commission, 2018) on the total amount of funds (by type of fund) actually spent by a region (NUTS-2 level) in a given year. Overall, for the programming period 2007-2013, regions spent for Cohesion Policy €166.5 million per year, on average, of which 57% corresponded to ERDF (Table 1).
To explore the heterogeneous effects of funds due to differences in the quality of institutions, we use a regional (NUTS-2 level) survey-based indicator of quality of governance (QoG) from the Quality of Government Institute at the University of Gothenburg. This indicator covers the years 2010 and 2013 and focuses on the pillar of governance related to corruption. Higher values in the index of less corruption denote lower levels of perceived corruption among the population (Charron et al., 2015). The index is centred and expressed in standard deviations (z-score).
The other variables of interest such as indicators of regional labour productivity (by sector), measured as GVA per worker (in the corresponding sector), or the GDP per capita as a share of the EU25, come from the OECD Regional Database (OECD, 2018). Average labour productivity in the EU regions was close to the USD 63 000 (in 2010 PPP) in the period 2008‑2014. However, labour productivity is highly unequal across regions. For instance, while some regions have levels of per worker GVA below the USD 16 000 (in 2010 PPP), the most productive regions in the EU surpass the USD 100 000 (in 2010 PPP) (Table 1).
Table 1.
Summary statistics
| Regional average | Standard deviation | Minimum | Maximum | |
| Business Demography outcomes, 2008-2014 | ||||
| Active firms (in thousands) | 131.7 | 139.4 | 2.878 | 863.5 |
| Active firms per 10 000 people | 649.3 | 228.0 | 218.9 | 1,918 |
| Birth rate of firms (%) | 10.52 | 2.778 | 5.179 | 24.58 |
| Death rate of firms (%) | 9.166 | 3.365 | 4.661 | 28.88 |
| Net birth rate of firms (%) | 1.422 | 2.912 | -4.298 | 7.977 |
| Employees in active firms (in thousands) | 617.7 | 754.6 | 11.59 | 6,599 |
| Employees in active firms per 10 000 people | 3,002 | 1,309 | 1,125 | 10,011 |
| Employment increase due to firm births (%) | 3.402 | 1.228 | 0.830 | 7.427 |
| Employment decrease due to firm deaths (%) | 3.389 | 1.503 | 0.626 | 9.046 |
| Net employment increase due to firm births and deaths (%) | -0.0107 | 0.961 | -6.189 | 2.911 |
| Cohesion Policy Funds 2007-2013, expenditure in millions of euros | ||||
| Cohesion Policy Fund | 166.5 | 201.8 | 0.691 | 1,041 |
| European Regional Development Fund | 93.99 | 121.8 | 0.269 | 745.3 |
| European Social Fund | 35.86 | 39.95 | 0.422 | 341.7 |
| Cohesion Fund | 36.68 | 60.44 | 0 | 394.5 |
| Other variables | ||||
| Index of less corruption (centred and standardized, z-score) | 0.0 | 0.955 | -2.912 | 2.359 |
| Population (in millions) | 2.054 | 1.799 | 0.0280 | 11.84 |
| GDP per capita as a share of the EU | 82.55 | 36.76 | 18.29 | 171.6 |
| GVA per worker (USD PPP at prices of 2010) | 62,958 | 15,350 | 25,559 | 112,392 |
Note: Averages of 159 EU regions with available data over the period 2007-2014. Source: Author’s elaboration based on Eurostat (2018), European Commission (2018), Charron et al. (2015), and OECD (2018).
In total, our sample cover 159 non-repeated regions from 18 countries. As each region can be broken down by economic sector, employer or non‑employer status and year, this increases the samples for the analysis to around 20 000 observations.
4. Empirical strategy
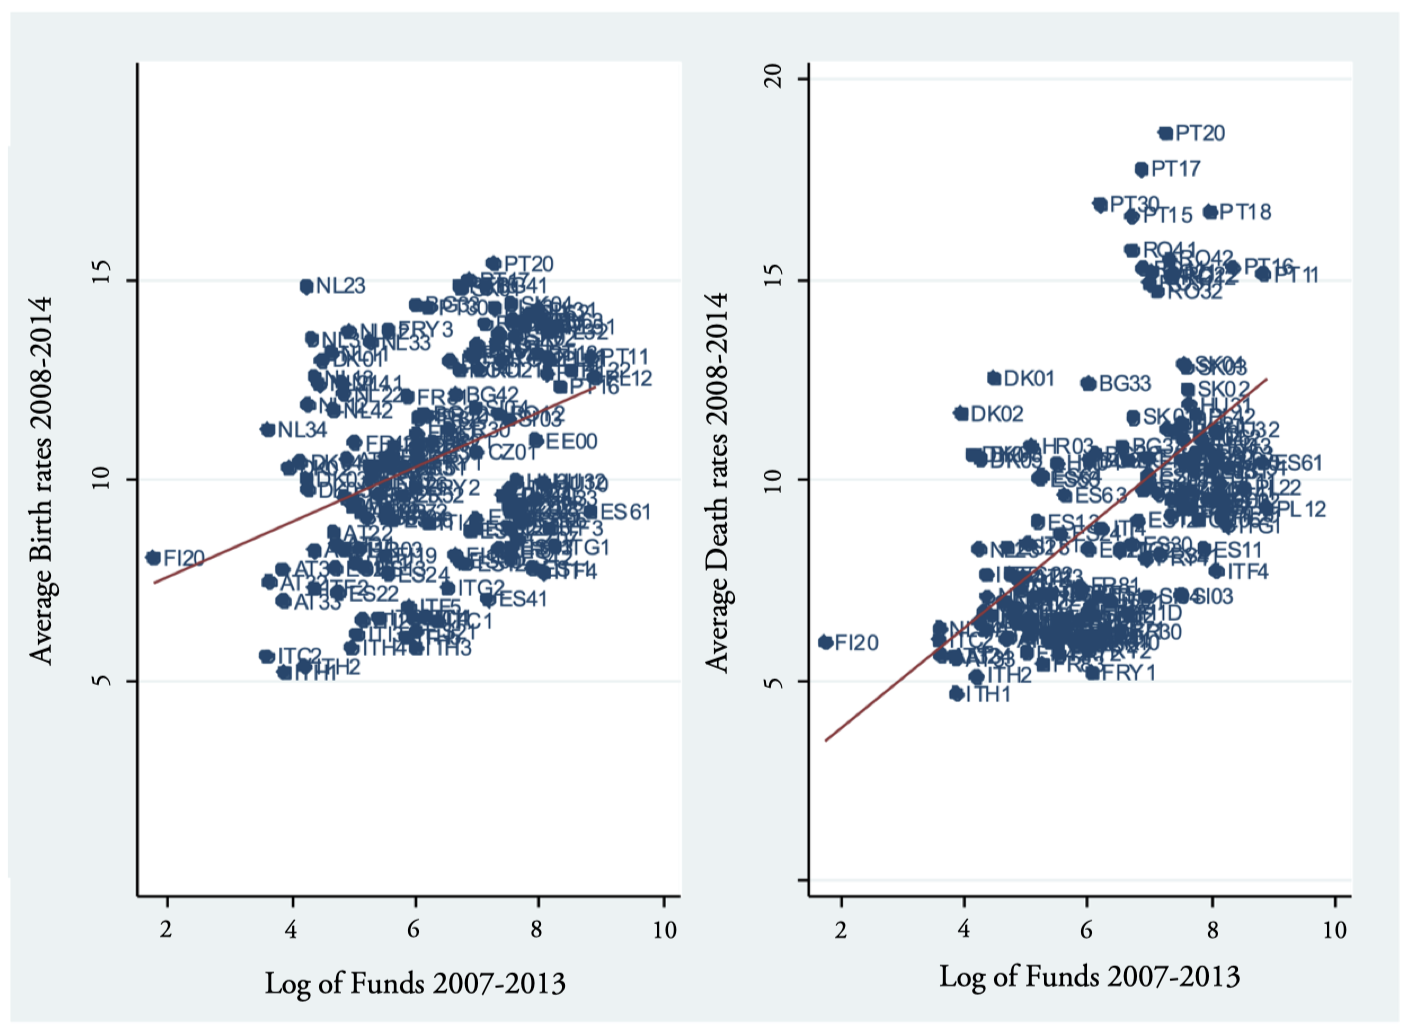
This section starts by checking whether, across European regions, there is a significant association between the (log of the) amount of funds a region spends and its firm dynamics. Figure 1shows clear positive correlations, which holds both with births and deaths rates of firms.
These correlations are only suggestive, as regions can differ along many other dimensions that can simultaneously affect the amount of funds they receive as well as the firm birth and death rates. Furthermore, Figure 1 does not reveal if there is any effect on net firm creation rates (firm birth minus firm death rates), which vary widely across European regions (see Figure 2). In the following, we present the empirical strategy used in this paper to estimate the causal impact of regional funds on business dynamics.
Figure 1.
European Funds vs. Births and Deaths of firms
Source: Author’s elaboration based on European Commission (2018), and Eurostat (2018).
To identify empirically the effect of EU Cohesion Policy funds on regional business dynamics we use a regression discontinuity design (RDD) in a 2‑stage least squares (2SLS) framework. The funding allocation rule for the less developed regions gives rise to an exogenous variation for funds allocated to regions. Regions with a GDP per capita (in euros PPP, average 2000‑2002) below 75% of the EU25 average qualify for more funds (this is also known as EU objective 1 funding). Public institutions, the private sector (in particular small and medium enterprises or SMEs), universities and NGOs located in the target regions can apply for funds through the corresponding regional authorities, which results in a considerable increase in the amount of funds that regional stakeholders can access and thus spend.
Figure 2.
Net birth rate of firms in NUTS-3 regions
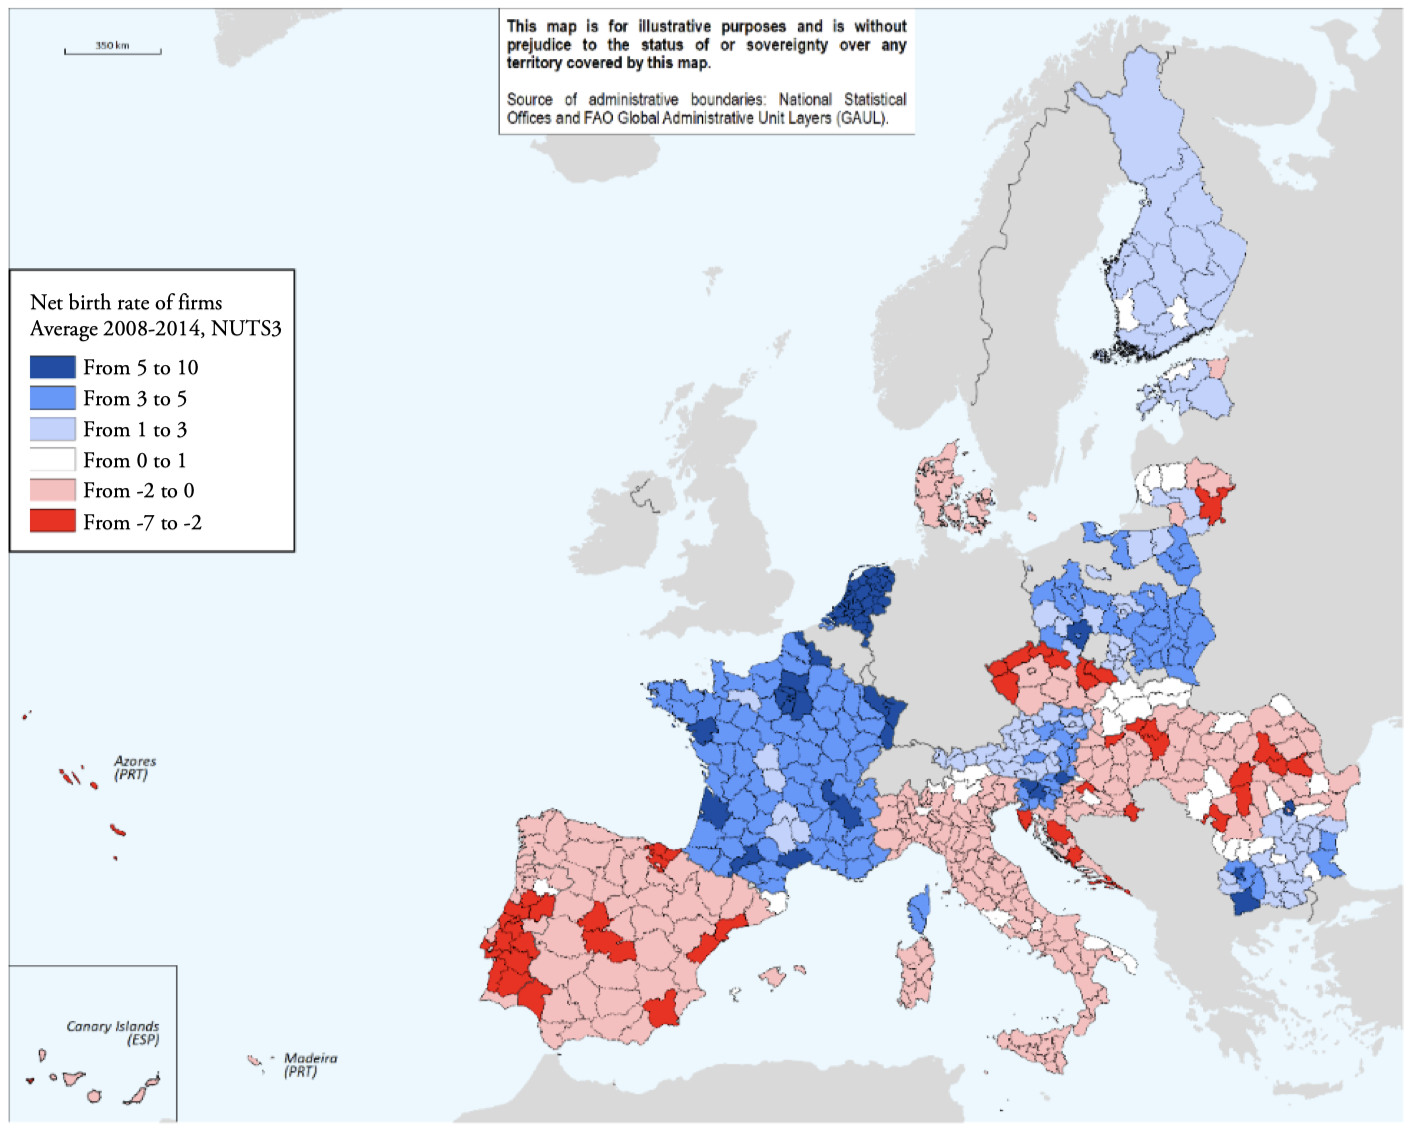
Source: Author’s elaboration based on Eurostat (2018).
Regional expenditure of EU funds is clearly discontinuous around the 75% of regional GDP per capita as a share of the EU25 (Figure 3). On average, regions below the 75% EU’s GDP per capita cut-off line (hereafter 75-threshold) spent around 5.5 times more funds than regions with GDP per capita levels above the 75‑threshold. More importantly, the discontinuity is starker and more exogenous the closer to the cut-off line, which allows estimating the effects of funds through a regression discontinuity design (RDD) approach. What is more, this discontinuity also holds for allocated funds, which decreases concerns about potential omitted variable issues related to the lack of local capacity to even spend their allocated funds. This is clearly shown in Annex A, more precisely Figure A.1 shows the stark discontinuity around the 75‑threshold for allocated funds, while Figure A.2 displays the strong correlation between allocated and spent funds.
One concern that emerges when using RDD is that the main explanatory variable (here EU funds) might not be the only discontinuous variable around the 75‑threshold that could be affecting regional business dynamics. This circumstance could bias the coefficient associated to EU funds. The Annex provides evidence that other selected variables (possible determinants of business dynamics), such as population, employment and institutions, are not discontinuous around the 75‑threshold (Figure B.1).
Having a GDP per capita larger than 75% of the EU (i.e., non-eligibility for EU objective 1 funding) does not imply that regions do not receive any EU regional transfer at all (as can be observed in Figure 3). Considering this imperfect compliance in the allocation of funds, we employ a “fuzzy” regression discontinuity design instead of a “sharp” RDD. While the sharp RDD exploits the discontinuity rule to identify the treatment and control groups in a deterministic manner, the fuzzy RDD employs the discontinuity rule to predict the probability of being treated, thus becoming an instrumental variable for treatment status (Angrist and Pischke, 2009).
RDD estimation requires to use only the regions close to the 75-threshold. In the case of our sample, regions considered as just above or just below the 75-threshold are those whose GDP per capita is included between 60% and 90% of the EU average (hereafter bandwidth 60-90). Such regions are highlighted in Figure 1.4.
Most of the regions that are 15 percentage points above or below the 75-threhold are concentrated in Southern Europe, with the exception of a few regions in Nordic countries (Denmark and Finland) and Central Europe (e.g. Czech Republic and Hungary) (Figure 4). To increase the comparability of the regions around the threshold (by reducing potential omitted variable bias due to unobservable geographical characteristics) and to improve the reliability of the estimates, we select the 60-90 bandwidth and spatially restrict our sample to regions of Southern European countries with available data, namely Portugal, Spain, and Italy (the latter restriction particularly ensures similar levels of quality of institutions around the threshold). The main findings hold even without imposing the latter restriction, these results are shown in the Annex. To test the robustness of the results and their external validity, we also estimate the main empirical regression specification using a number of alternative bandwidths that yield different samples of regions (Table C.1-Table C.3).
Figure 3.
Expenditure of Funds and GDP per capita
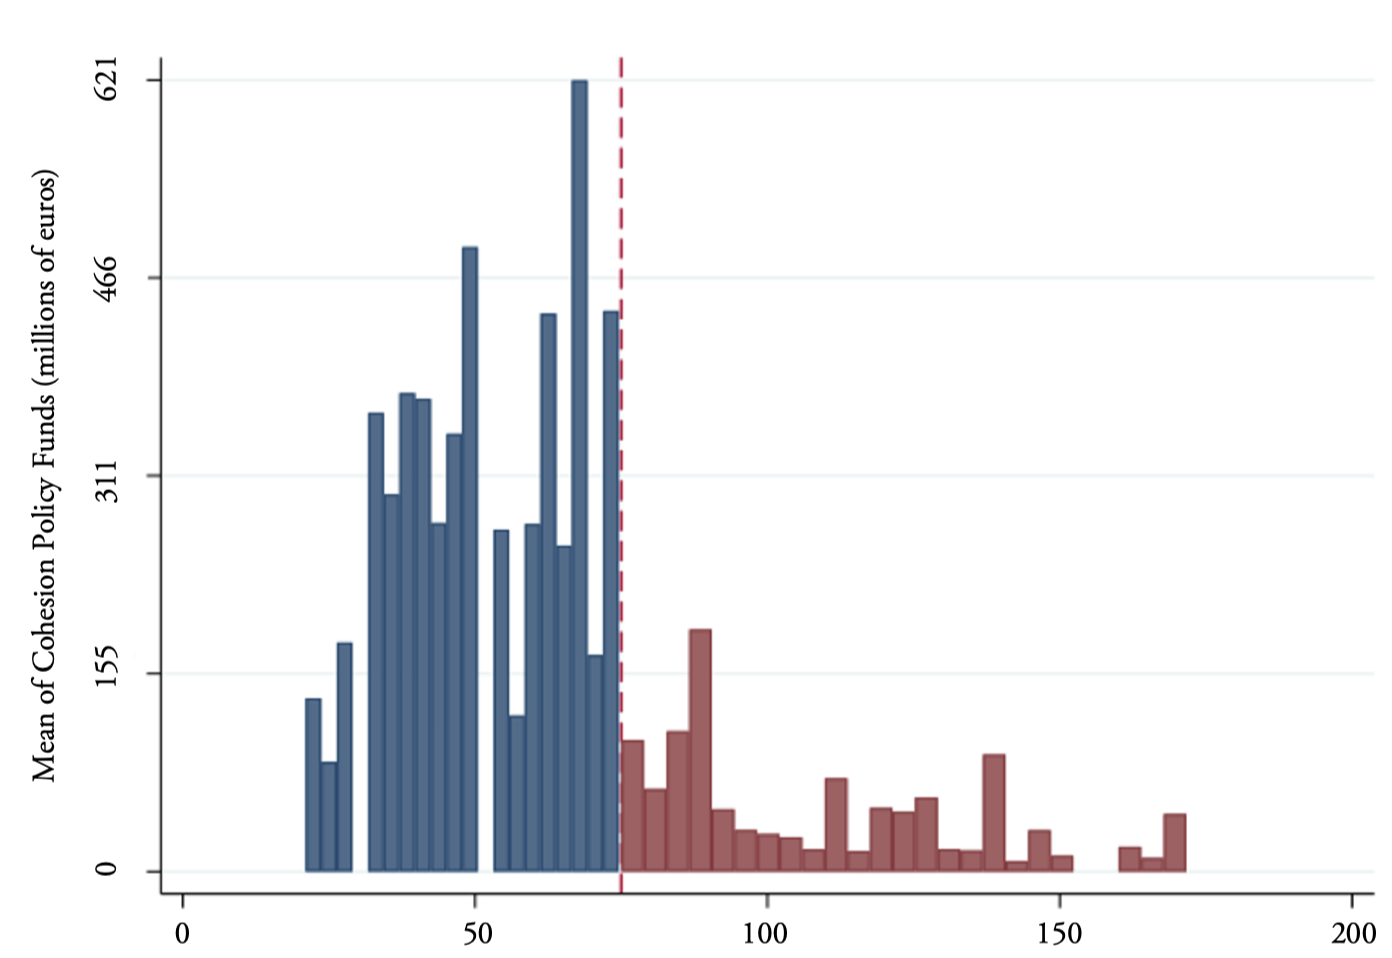
Note: “Funds” refer to the European Regional Development Funds (ERDF), European Social Funds (ESF) and Cohesion Funds (CF), this note applies to all graphs and tables. Source: Author’s elaboration based on OECD (2018) and European Commission (2018).
Most of the regions that are 15 percentage points above or below the 75-threhold are concentrated in Southern Europe, with the exception of a few regions in Nordic countries (Denmark and Finland) and Central Europe (e.g. Czech Republic and Hungary) (Figure 4). To increase the comparability of the regions around the threshold (by reducing potential omitted variable bias due to unobservable geographical characteristics) and to improve the reliability of the estimates, we select the 60-90 bandwidth and spatially restrict our sample to regions of Southern European countries with available data, namely Portugal, Spain, and Italy (the latter restriction particularly ensures similar levels of quality of institutions around the threshold). The main findings hold even without imposing the latter restriction, these results are shown in the Annex. To test the robustness of the results and their external validity, we also estimate the main empirical regression specification using a number of alternative bandwidths that yield different samples of regions (Table C.1-Table C.3).
Figure 4.
Regional GDP per capita as a share of the EU25
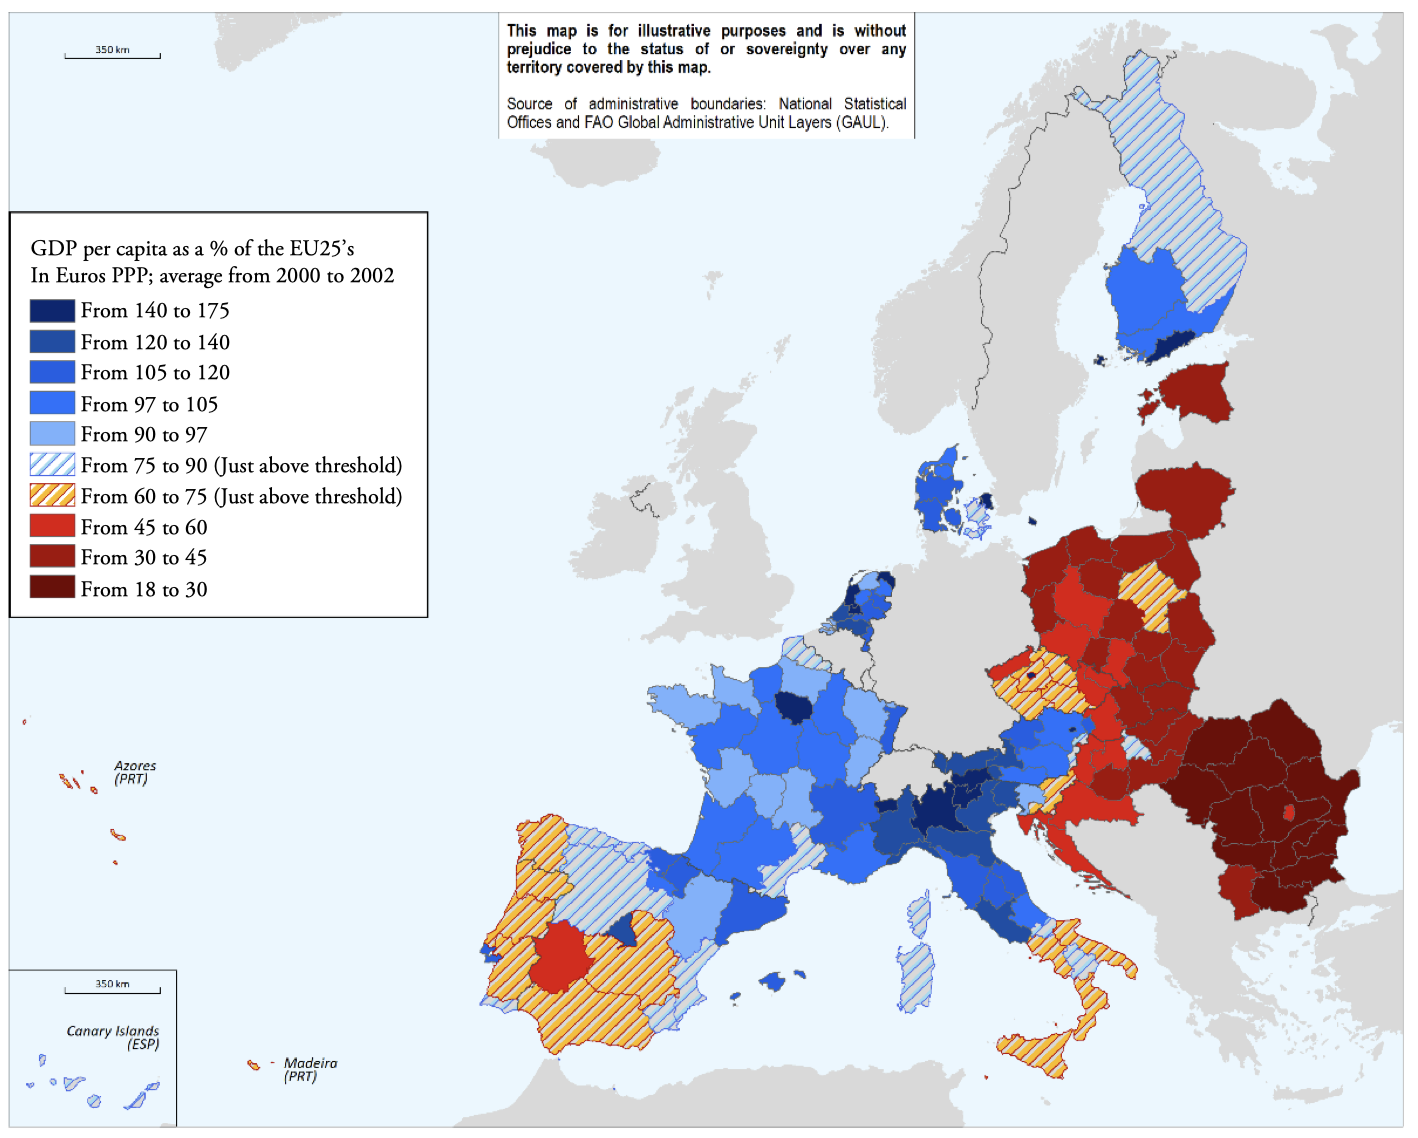
Source: Author’s elaboration based on OECD (2018).
4.1. OLS regressions around the discontinuity
We begin the analysis with a simple OLS model as in Equation 1, where stands for the business dynamic variable (e.g. birth rate of firms) in region , economic sector , employer status , and year .
(1)
is the amount of Cohesion Policy funds spent in the previous year (hereafter “Funds”, which include ERDF, ESF and CF) in millions of euros. While the amount of spent funds might have a contemporaneous effect on business dynamics, we argue that most of the effect should be reflected in next year’s business registers. is a set of controls that contains GDP per capita (as a share of the EU) and its square, and the log of population – as the development of the region in terms of GDP per capita and its population size may be associated to the local capacity to obtaining more funds and to a more dynamic business sector. Our specifications also include economic sector, employer class, country, and year fixed effects (denoted by , , and respectively), which reduces the variation in business dynamic outcomes driven by industrial activity, employment size, and other time-invariant country characteristics or year-specific shocks.
We start our analysis by presenting the coefficients of the standard OLS regressions using the whole sample of regions (Table 2). This first specification suggests that more funds are associated to more business creation (column 1) but also to more business destructions (column 2), which leads to a non-significantly different from zero net growth in the number of active businesses (column 3). The same pattern is observed for the employment associated to this business dynamic (columns 4 to 6). Nonetheless, the fact that this specification compares very heterogeneous regions across Europe raises concerns on the reliability of the coefficients associated to the funds, which most likely are biased due to unobserved omitted variables. One concern is that the characteristics that make a region more “entrepreneurial” (e.g., low risk aversion, preference for self-employment, access to financial instruments, etc.) are also the abilities that facilitate the capturing of Cohesion Policy funds, in which case our coefficients for birth and death rates will be upwardly biased.
Table 2.
OLS for all regions
| (1) | (2) | (3) | (4) | (5) | (6) | |
| Firms Birth rate | Firms Death rate | Firms Net birth rate | Employment Birth rate | Employment Death rate | Employment Net birth rate | |
| Funds | 0.184*** | 0.192*** | -0.00827 | 0.0428*** | 0.0615*** | -0.0186 |
| (0.0195) | (0.0381) | (0.0353) | (0.0124) | (0.0188) | (0.0152) | |
| GDP per capita as share of EU | -5.218*** | -4.508** | -0.711 | -6.897*** | -7.183*** | 0.286 |
| (0.940) | (1.807) | (1.861) | (0.400) | (0.678) | (0.650) | |
| (GDP per capita as share of EU)^2 | 0.0233*** | 0.0170** | 0.00633 | 0.0218*** | 0.0227*** | -0.000886 |
| (0.00450) | (0.00767) | (0.00805) | (0.00180) | (0.00290) | (0.00280) | |
| Log of Population | 16.41*** | 8.425* | 7.982 | -10.64*** | -7.516*** | -3.120 |
| (3.871) | (4.741) | (5.081) | (2.253) | (2.455) | (2.399) | |
| Employer firms | 69.63*** | 175.7*** | -106.1*** | 20.50*** | 61.58*** | -41.08*** |
| (7.688) | (16.93) | (16.76) | (3.967) | (7.624) | (7.297) | |
| Observations | 11,235 | 11,235 | 11,235 | 11,015 | 11,015 | 11,015 |
| R-squared | 0.384 | 0.179 | 0.117 | 0.515 | 0.251 | 0.085 |
| Country FE | Yes | Yes | Yes | Yes | Yes | Yes |
| Year FE | Yes | Yes | Yes | Yes | Yes | Yes |
| Sector FE | Yes | Yes | Yes | Yes | Yes | Yes |
| Adj. R-squared | 0.382 | 0.176 | 0.114 | 0.514 | 0.249 | 0.0819 |
Note: Robust standard errors in parentheses. *** p<0.01, ** p<0.05, * p<0.1.
To reduce potential omitted variable bias, we restrict the sample to regions whose GDP per capita lies around the 75-threshold of the EU25 average, thereby comparing regions close to each other in terms of potentially unobservable characteristics associated to their economic development. Additionally, we focus on regions located in Southern European countries (Portugal, Spain and Italy), which reduces the effects of unobservable geographically or culturally determined characteristics. The preferred bandwidth of regional GDP per capita (in euros PPP) ranges from 60% to 90% of the EU25 average, a window also used in Becker et al. (2010). This sample restriction represents close to 15% of all available non-repeated regions (7.5% below and 7.5% above the 75-threshold).
Regarding potential issues of reverse causality, the results of the restricted OLS specification within the 60-90 bandwidth (shown in Table 3) confirm the initial hypothesis that the previous unrestricted OLS estimates were upwardly biased for both birth rates and death rates of firms.[2] Richer regions, with typically higher productivity levels and business churn (Tsvetkova et al., 2020) might be more likely to request and acquire larger amounts of funds due to their endogenously greater entrepreneurial activity (Table 2). When reducing this type of endogeneity (by comparing regions around the 75-threshold), we find that more funds generate more businesses creation but are not significantly associated with more firm destruction (Table 3, columns 1 and 2), leading to a significantly net birth rate of firms (column 3). The same logic applies for the employment associated to the net creation of businesses employment (columns 4 to 6): more funds are associated to a positive net growth of jobs.
Table 3.
OLS for regions around the 75%-threshold
Bandwidth from 60% to 90%, regions of Portugal, Spain and Italy
| (1) | (2) | (3) | (4) | (5) | (6) | |
| Firms Birth rate | Firms Death rate | Firms Net birth rate | Employment Birth rate | Employment Death rate | Employment Net birth rate | |
| Funds | 0.0460* | -0.00296 | 0.0490** | 0.0408** | -0.0151 | 0.0559*** |
| (0.0240) | (0.0274) | (0.0227) | (0.0190) | (0.0252) | (0.0188) | |
| GDP per capita as share of EU | -69.95*** | -78.01*** | 8.055 | -10.59 | -46.25* | 35.66* |
| (22.28) | (24.74) | (21.27) | (16.46) | (23.69) | (18.88) | |
| (GDP per capita as share of EU)^2 | 0.426*** | 0.485*** | -0.0593 | 0.0534 | 0.271* | -0.218* |
| (0.140) | (0.155) | (0.134) | (0.104) | (0.147) | (0.117) | |
| Log of Population | -16.62** | -1.995 | -14.62** | -17.77*** | -6.754 | -11.02** |
| (7.598) | (7.355) | (7.176) | (5.127) | (5.495) | (5.150) | |
| Employer firms | 166.5*** | 99.74*** | 66.81*** | 49.77*** | 29.21*** | 20.56** |
| (12.13) | (12.75) | (11.36) | (8.975) | (10.49) | (8.244) | |
| Observations | 1,647 | 1,647 | 1,647 | 1,637 | 1,637 | 1,637 |
| R-squared | 0.520 | 0.453 | 0.476 | 0.537 | 0.500 | 0.381 |
| Country FE | Yes | Yes | Yes | Yes | Yes | Yes |
| Year FE | Yes | Yes | Yes | Yes | Yes | Yes |
| Sector FE | Yes | Yes | Yes | Yes | Yes | Yes |
| Adj. R-squared | 0.514 | 0.446 | 0.469 | 0.531 | 0.493 | 0.373 |
Notes: Robust standard errors in parentheses. *** p<0.01, ** p<0.05, * p<0.1. These results also hold without restricting the sample to regions in southern European countries, see Annex Table.
Although the empirical specification of Table 3 decreases part of the potential omitted variable bias issue, it does not clearly address potential reverse causality – e.g. regions with a more developed business environment, endogenously more entrepreneurial, may be better at applying and obtaining more funds. To address this, we apply a Regression Discontinuity Design (RDD) in a 2-stage least squares (2SLS) model, where the amount of funds is instrumented using the exogenous 75‑threshold rule as an instrumental variable (as in Becker et al., 2010).
4.2. Main specification (RDD 2SLS)
Our preferred model consists in a RDD in a 2SLS specification of the form:
In the first stage, we predict the amount of funds spent by a region in year , using , the dummy variable for the 75-threshold being 1 if the average GDP per capita of the region as a share of the EU average was below 75%. Additionally, we control for the same variables described in Equation 1. In the selected specification, the treatment dummy is not interacted with the “forcing” variable (GDP per capita as a share of the EU average) as GDP and its square are already entering the first stage as controls. GDP and its square are included in this stage as they improve the estimation of spent funds (instrumented variable). A potential explanation for the quadratic relationship between GDP and spent funds (observed in Figure 3) is that poorer regions tend to have less capacity to get and spend funds. This capacity increases with regional development, until the point where funds spent drop again due to EU rules.
In the second stage, we run the instrumented variable funds (lagged one year) from the first stage on Business Dynamics variables (for region , sector , employer class , and year ), while controlling for the set of variables (GDP per capita as a share of the EU and its square, and the log of population), and a set of country, sector, employer class and year fixed effects. As in the previous OLS model, we estimate this regression on the sample of Southern European regions within the bandwidth of 60 to 90% of GDP per capita as a share of the EU.
5. Results and discussion
5.1. The impact of Cohesion Policy funds on Business Dynamics
When applying the preferred specification (RDD 2SLS, see Equation 2), the results support the interpretation that the creative effect of funds generates more competition and reallocation of jobs in the economy, which leads recipient regions to achieve higher levels of labour productivity (Table 4).
What is more, the competition generated by the new firms entering the market is not associated to firm destruction, which results in higher levels of employment and labour utilization in the recipient regions. These results hold qualitatively for a variety of different bandwidths, although the magnitude or significance can slightly vary from one specification to another (see Table C.1-Table C.3).
The effects of funds on business birth and death rates of the RDD 2SLS (Table 4) are stable (i.e. same direction of signs and order or magnitude) compared to the restricted OLS specification (of Table 3) – although the coefficients of the latter model seem to be underestimating the real effect of European Cohesion Policy funds.
Looking at the magnitude of the estimated coefficients, our results show that a €100 million increase in annual funds (around 0.3% of the total Cohesion Policy budget for the period 2007-2013) is associated to the net creation of around 241 new firms and 159 new jobs per every 10 000 existing firms and jobs respectively – suggesting that the average size of newly created firms was smaller than that of existing firms (RDD 2SLS specification, see Table 4 columns 3 and 6). Finally, our results also indicate that funds have a significant and positive effect on labour productivity measured as GVA per worker (column 7) – this in line with similar findings in the literature using GDP per capita as a proxy (e.g. Becker et al., 2010; Pellegrini et al., 2013).
Table 4.
The impact of Cohesion Policy funds on Business dynamics (main specification)
RDD 2SLS, 2nd stage; bandwidth 60-90, regions of Portugal, Spain and Italy
| (1) | (2) | (3) | (4) | (5) | (6) | (7) | |
| Firms Birth rate | Firms Death rate | Firms Net birth rate | Employment Birth rate | Employment Death rate | Employment Net birth rate | GVA per worker | |
| Instrumented Funds | 0.193** | -0.0482 | 0.241*** | 0.107* | -0.0525 | 0.159*** | 31.36*** |
| (0.0801) | (0.0852) | (0.0787) | (0.0624) | (0.0714) | (0.0509) | (7.045) | |
| GDP per capita as share of EU | -66.80*** | -80.53*** | 13.73 | -11.97 | -46.59* | 34.62* | -1,788 |
| (23.19) | (26.12) | (22.02) | (17.70) | (23.85) | (17.91) | (1,937) | |
| (GDP per capita as share of EU)^2 | 0.418*** | 0.497*** | -0.0795 | 0.0670 | 0.270* | -0.203* | 14.60 |
| (0.144) | (0.162) | (0.137) | (0.110) | (0.147) | (0.111) | (12.56) | |
| Log of Population | -28.89*** | 2.279 | -31.17*** | -22.52*** | -3.727 | -18.79*** | -5,627*** |
| (10.44) | (10.92) | (10.23) | (7.898) | (8.934) | (7.093) | (924.0) | |
| Employer firms | 166.4*** | 99.78*** | 66.60*** | 50.01*** | 29.12*** | 20.88** | |
| (12.12) | (12.76) | (11.35) | (9.001) | (10.49) | (8.250) | ||
| Observations | 1,647 | 1,647 | 1,647 | 1,637 | 1,637 | 1,637 | 1,512 |
| R-squared | 0.520 | 0.453 | 0.478 | 0.536 | 0.500 | 0.379 | 0.964 |
| Country FE | Yes | Yes | Yes | Yes | Yes | Yes | Yes |
| Year FE | Yes | Yes | Yes | Yes | Yes | Yes | Yes |
| Sector FE | Yes | Yes | Yes | Yes | Yes | Yes | Yes |
| Adj. R-squared | 0.514 | 0.446 | 0.471 | 0.530 | 0.493 | 0.371 | 0.964 |
Note: Robust standard errors in parentheses. *** p<0.01, ** p<0.05, * p<0.1.
These findings can be interpreted in light of the creative-destruction argument that new and more innovative firms replace the old and less innovative ones (Schumpeter, 1946; Aghion and Howitt, 1990) generating higher levels of productivity. In our results, more competition associated with new firms entering the market might lead to more productivity also through the adaptation of incumbent firms – instead of through pure firm destruction. Additionally, in a context of business creation without significant firm and job destruction, employment is also increased.
5.2. Disentangling the role of different funds
The European Cohesion Policy is articulated through three main types of funds with potentially different impacts on business dynamics. It is worth noting that our main specification (Equation 1.1 and 1.2) allows for a causal identification through RDD 2SLS of the global impact of Cohesion Policy funds on net business creation and employment. The same approach cannot be applied by type of fund separately as the allocation rules and the discontinuity around the 75‑threshold for each type of fund are overlapping (see Figure D.1-Figure D.3). On the other hand, Table 5 explores the relative impact of the distribution of funds by type (i.e. ERDF, ESF and CF) on our business dynamic variables, by adding to the model the share of each fund as a percentage of the total amount of funds.
Overall, larger shares of European Regional Development Funds and European Social Funds (as % of the total funds, i.e. ERDF+ESF+CF), relative to Cohesion Funds shares, are associated with higher business creation, confirming the effectiveness of these funds to encourage entrepreneurship in recipient regions. Moreover, the impact of larger shares of ESF is higher and more statistically significant than that of ERDF on employment and labour productivity. These results are in line with the main objectives for which these funds were designed. ERDF and ESF are mainly dedicated to support SMEs and employment, respectively, whereas CF focuses typically on financing infrastructure projects.
Table 5.
Business dynamics and the distribution of Funds by type
RDD 2SLS, 2nd stage; bandwidth 60-90, regions of Portugal, Spain and Italy
| (1) | (2) | (3) | (4) | (5) | (6) | (7) | |
| Firms Birth rate | Firms Death rate | Firms Net birth rate | Employment Birth rate | Employment Death rate | Employment Net birth rate | GVA per worker | |
| Instrumented Funds | 0.191** | -0.0196 | 0.211** | 0.102 | -0.0716 | 0.173*** | 38.17*** |
| (0.0870) | (0.0917) | (0.0844) | (0.0681) | (0.0791) | (0.0562) | (7.940) | |
| Share of ERDF | 99.83 | -81.65 | 181.5*** | 64.41 | 31.01 | 33.40 | 5,224 |
| (67.78) | (72.70) | (63.69) | (51.42) | (62.77) | (47.51) | (8,131) | |
| Share of ESF | 181.4** | -18.98 | 200.3*** | 107.3* | -22.86 | 130.2*** | 15,788** |
| (81.70) | (83.12) | (71.13) | (63.23) | (68.27) | (48.85) | (7,481) | |
| Benchmark model’s controls | Yes | Yes | Yes | Yes | Yes | Yes | Yes |
| Observations | 1,647 | 1,647 | 1,647 | 1,637 | 1,637 | 1,637 | 1,512 |
| R-squared | 0.522 | 0.454 | 0.479 | 0.537 | 0.500 | 0.382 | 0.965 |
| Country FE | Yes | Yes | Yes | Yes | Yes | Yes | Yes |
| Year FE | Yes | Yes | Yes | Yes | Yes | Yes | Yes |
| Sector FE | Yes | Yes | Yes | Yes | Yes | Yes | Yes |
| Adj. R-squared | 0.515 | 0.446 | 0.472 | 0.530 | 0.493 | 0.373 | 0.964 |
Note: Robust standard errors in parentheses. *** p<0.01, ** p<0.05, * p<0.1. Benchmark controls refer to the GDP per capita as a share of the EU and its square, the log of population and the employer firm dummy variable. This note applies to the rest of the tables.
5.3. The role of Quality of Governance
It is widely accepted that institutions matter for economic development (see for example, North, 1991; Acemoglu and Robinson, 2010). For instance, the effectiveness of public investment largely depends on the institutional and governance capacity of regions to manage and allocate the funds they receive (Becker et al., 2013; Ederveen et al., 2006; OECD, 2013 and 2020). In Europe, the quality of institutions has been shown to vary substantially across regions (Charron et al., 2015), which can generate significant heterogeneous effects of funds across regions.
We extend our analysis to examine whether regional institutions affect the impact of funds on firm dynamics. To explore the role of governance in mediating the effects of the Cohesion Policy, we modify our baseline model (Equations 1.1 and 1.2) by adding the variable Less corruption, as well as its interaction with the variable Funds.
When funds are interacted with less corruption, the effect is positive on the net growth of business employment (Table 6, column 6), which adds up to the positive effect of funds alone. This result is mainly driven by a positive impact on the employment associated to the newly born firms (column 4). However, this increase in the number of jobs does not translate into increases in the levels of labour productivity (GVA per worker) for these regions (column 7). This is not surprising as only the number of workers is growing due to the interaction effect (column 6), while the gross value added remains stable due to a zero net creation of firms.
Table 6.
Business dynamics, Funds and Quality of Governance
RDD 2SLS, 2nd stage; bandwidth 60-90, regions of Portugal, Spain, and Italy
| (1) | (2) | (3) | (4) | (5) | (6) | (7) | |
| Firms Birth rate | Firms Death rate | Firms Net birth rate | Employment Birth rate | Employment Death rate | Employment Net birth rate | GVA per worker | |
| Instrumented Funds | 0.0522 | -0.145 | 0.197** | 0.0441 | -0.0929 | 0.137** | 25.00*** |
| (0.0888) | (0.101) | (0.0920) | (0.0731) | (0.0858) | (0.0597) | (7.568) | |
| Instrumented Funds X Less corruption | 0.00744 | -0.0808 | 0.0882 | 0.141*** | 0.0274 | 0.114** | -31.15*** |
| (0.0732) | (0.0757) | (0.0755) | (0.0535) | (0.0669) | (0.0572) | (10.29) | |
| Index of less corruption | -78.89*** | -17.87 | -61.02** | -98.80*** | -51.24** | -47.56** | 8,620*** |
| (28.28) | (28.31) | (28.57) | (20.96) | (24.43) | (20.49) | (3,241) | |
| Benchmark model’s controls | Yes | Yes | Yes | Yes | Yes | Yes | Yes |
| Observations | 1,531 | 1,531 | 1,531 | 1,521 | 1,521 | 1,521 | 1,386 |
| R-squared | 0.576 | 0.502 | 0.523 | 0.548 | 0.510 | 0.436 | 0.970 |
| Country FE | Yes | Yes | Yes | Yes | Yes | Yes | Yes |
| Year FE | Yes | Yes | Yes | Yes | Yes | Yes | Yes |
| Sector FE | Yes | Yes | Yes | Yes | Yes | Yes | Yes |
| Adj. R-squared | 0.570 | 0.494 | 0.516 | 0.541 | 0.502 | 0.428 | 0.970 |
Note: Robust standard errors in parentheses. *** p<0.01, ** p<0.05, * p<0.1.
Lower corruption is associated with lower birth rates of firms (Table 6, column 1). One possible interpretation for this result is that in regions with better institutions there are also more regulations (e.g. administrative procedures and requirements to open new businesses), as well as more protections for existing firms and workers, which slows down churning rates. While quality of institutions matters for the effectiveness of public investment through the channel of less corruption (Everhart and Sumlinski, 2001; Tanzi and Davoodi, 1998), strong levels of product market regulation tend to be associated with lower levels of net business creation (OECD, 2017).
6. Conclusions
By looking at regional business dynamics, our analysis uncovers one potential mechanism underlying the positive effects of European Cohesion Policy funds on regional economies. Our results support the hypothesis that regional transfers induce positive business dynamics’ outcomes. They foster the net rate of firm creation and the jobs associated to such creation. This combination of higher firm creation and faster reallocation of jobs appears to increase competition in regions, which ultimately raises regional labour productivity.
We also find that the positive impact of Cohesion Policy on net business creation is mainly driven by the European Social Fund (ESF) and the European Regional Development Fund (ERDF), relative to the Cohesion Fund (CF). On the other hand, most of the impact on employment creation is explained by the ESF alone. This goes in line with the objectives of each fund. While the ERDF tends to focus more broadly on SMEs and regional development projects, the ESF highly focuses on supporting employment and human capital for a stronger labour market.
Finally, this work also provides evidence that regional institutions matter for the effectiveness of public investment – their quality enhances the impact of funds on business employment. In regions with lower levels of corruption, the effect of funds is conductive to positive net business employment creation, but it has no significant effect on firm creation and churning. Consequently, this does not translate into higher productivity for these regions. This goes in line with our argument that the main business demography driver of productivity is firm creation and churning. In the absence of firm dynamics, productivity levels remain stable.
The impact of funds on firm creation and business employment is robust to different bandwidths and can be extrapolated to all European regions. On the other hand, the enhancing effect of quality of governance on funds is only applicable for Southern European regions, which around the 75-threhold share similar levels of institutional quality.
References
Acemoglu, D. and Robinson, J. (2010). The Role of Institutions in Growth and Development. Review of Economics and Institutions, 1(2). http://dx.doi.org/10.5202/rei.v1i2.14
Aghion, P., Bloom, N., Blundell, R., Griffith, R., and Howitt, P. (2005). Competition and innovation: An inverted-U relationship. The Quarterly Journal of Economics, 120(2), 701-728. https://doi.org/10.1093/qje/120.2.701
Aghion, P. and Howitt, P. (1990). A model of growth through creative destruction. National Bureau of Economic Research. http://dx.doi.org/10.3386/w3223
Alon, T., Berger, D., Dent, R., and B. Pugsley (2018). Older and slower: The startup deficit’s lasting effects on aggregate productivity growth. Journal of Monetary Economics, 93, 68-85. http://dx.doi.org/10.1016/J.JMONECO.2017.10.004
Andrews, I. and Oster, E. (2017). Weighting for External Validity. National Bureau of Economic Research. http://dx.doi.org/10.3386/w23826
Angrist, J. D. and Pischke, J. S. (2009). Mostly Harmless Econometrics: An Empiricist's Companion.https://www.mostlyharmlesseconometrics.com
Asturias, J., Hur, S., Kehoe, T. J., and Ruhl, K. J. (2019). Firm entry and exit and aggregate growth. SSRN Electronic Journal.http://dx.doi.org/10.2139/ssrn.3328873
Barone, G., David, F., and de Blasio, G. (2016). Boulevard of broken dreams. The end of EU funding (1997: Abruzzi, Italy). Regional Science and Urban Economics, 60, 31-38. http://dx.doi.org/10.1016/j.regsciurbeco.2016.06.001
Becker, S., Egger, P., and von Ehrlich, M. (2018). Effects of EU Regional Policy: 1989-2013.http://dx.doi.org/10.1016/j.regsciurbeco.2017.12.001
Becker, S., Egger, P., and von Ehrlich, M. (2013). Absorptive Capacity and the Growth and Investment Effects of Regional Transfers: A Regression Discontinuity Design with Heterogeneous Treatment Effects. American Economic Journal: Economic Policy, 5(4), 29-77. http://dx.doi.org/10.1257/pol.5.4.29
Becker, S., Egger, P., and von Ehrlich, M. (2012). Too much of a good thing? On the growth effects of the EU's regional policy. European Economic Review, 56(4), 648-668. http://dx.doi.org/10.1016/J.EUROECOREV.2012.03.001
Becker, S., Egger, P., and von Ehrlich, M. (2010). Going NUTS: The effect of EU Structural Funds on regional performance. Journal of Public Economics, 94(9-10), 578-590. http://dx.doi.org/10.1016/j.jpubeco.2010.06.006
Berkowitz, P., Monfort, P., and Pieńkowski, J. (2019). Unpacking the growth impacts of European Union Cohesion Policy: transmission channels from Cohesion Policy into economic growth. Regional Studies, 54(1), 60‑71. https://www.tandfonline.com/doi/full/10.1080/00343404.2019.1570491
Cabral, L. M. B. and Mata, J. (2003). On the Evolution of the Firm Size Distribution: Facts and Theory. American Economic Review, 93(4), 1075-1090. https://www.aeaweb.org/articles?id=10.1257/000282803769206205
Charron, N., Dijkstra, L., and Lapuente, V. (2015). Mapping the Regional Divide in Europe: A Measure for Assessing Quality of Government in 206 European Regions. Social Indicators Research, 122, 315–346. http://dx.doi.org/10.1007/s11205-014-0702-y
Crescenzi, R. and Giua, M. (2019). One or many Cohesion Policies of the European Union? On the differential economic impacts of Cohesion Policy across member states. Regional Studies, 54(1), 10-20. https://doi.org/10.1080/00343404.2019.1665174
Ederveen, S., de Groot, H., and Nahuis, R. (2006). Fertile Soil for Structural Funds? A Panel Data Analysis of the Conditional Effectiveness of European Cohesion Policy. Kyklos, International Review for Social Sciences, 59(1), 17-42. https://onlinelibrary.wiley.com/doi/epdf/10.1111/j.1467-6435.2006.00318.x
Evans, D. and Jovanovic, B. (1989). An Estimated Model of Entrepreneurial Choice under Liquidity Constraints. Journal of Political Economy, 97(4), 808-827. www.jstor.org/stable/1832192
Everhart, S. and Sumlinski, M. (2001). The Impact on Private Investment of Corruption and the Quality of Public Investment. International Finance Corporation Discussion Paper, No. 44. The World Bank.
Esposti, R. and Bussoletti, S. (2008). Impact of Objective 1 funds on regional growth convergence in the European Union: a panel-data approach. Regional Studies, 42(2), 159‑173. https://doi.org/10.1080/00343400601142753
European Structural and Investment Funds. (2018). European Commission. Retrieved December, 2018, from https://cohesiondata.ec.europa.eu
Questions and Answers: European Social Fund 2007-2013 evaluation. (2017). European Commission. https://ec.europa.eu/commission/presscorner/detail/en/MEMO_16_3985
Cohesion Policy - Delivering benefits for citizens - Main results 2007-2013. (2016). European Commission. http://europa.eu/!pj83Bu
General provisions ERDF - ESF - Cohesion Fund (2007-2013). (2014). European Union. https://eur-lex.europa.eu/legal-content/EN/TXT/?uri=LEGISSUM:g24231
Structural and Cohesion Funds 2007-2013. (2013). European Union. https://www.buildup.eu/en/explore/links/structural-and-cohesion-funds-2007-2013
Regional Business Demography (database). (2018). Eurostat. Retrieved December, 2018, from https://ec.europa.eu/eurostat/data/database
Ferrara, A. R., McCann, P., Pellegrini, G., Stelder, D., and Terribile, F. (2017). Assessing the impacts of Cohesion Policy on EU regions: A non-parametric analysis on interventions promoting research and innovation and transport accessibility. Papers in Regional Science, 96, 817–841. https://doi.org/10.1111/pirs.12234
Foster, L., Haltiwanger, J., and Krizan, C. (2001). Aggregate productivity growth: Lessons from microeconomic evidence. In Charles R. Hulten, Edwin R. Dean and Michael J. Harper, (eds.), New developments in productivity analysis (pp. 303-372). https://www.nber.org/chapters/c10129.pdf
Gagliardi, L. and Percoco, M. (2017). The impact of European Cohesion Policy in urban and rural regions. Regional Studies, 51(6), 857-868. http://dx.doi.org/10.1080/00343404.2016.1179384
Giua, M. (2017). Spatial discontinuity for the Impact assessment of the EU Regional Policy: The Case of Italian Objective 1 Regions. Journal of Regional Science, 57(1), 109-131 https://onlinelibrary.wiley.com/doi/abs/10.1111/jors.12300
Guiso L., Jappelli, T., Padula, M., and Pagano, M. (2005). Financial Market Integration and Economic Growth in the EU. Economic Policy, 19(40)(5), 523-577. http://www.csef.it/WP/wp118.pdf
Kerr, W. R. and Nanda, R. (2009). Financing Constraints and Entrepreneurship. NBER Working Paper No. 15498. https://www.nber.org/papers/w15498.pdf
Mohl, P. and Hagen, T. (2010). Do EU structural funds promote regional growth? New evidence from various panel data approaches. Regional Science and Urban Economics, 40(5), 353-365. https://doi.org/10.1016/j.regsciurbeco.2010.03.005
Nickell, S. (1996). Competition and corporate performance. Journal of Political Economy, 104(4), 724-746. http://dx.doi.org/10.1086/262040
North, D. (1991). Institutions. The Journal of Economic Perspectives, 5(1), 97-112, http://dx.doi.org/10.2307/1942704
OECD (2020). Strengthening Governance of EU Funds under Cohesion Policy: Administrative Capacity Building Roadmaps. OECD Multi-level Governance Studies. OECD Publishing. https://doi.org/10.1787/9b71c8d8-en
OECD (2018). OECD Regional Statistics (database). OECD. Retrieved December, 2018, from http://dx.doi.org/10.1787/region-data-en
OECD (2017). The Geography of Firm Dynamics: Measuring Business Demography for Regional Development. OECD Publishing. http://dx.doi.org/10.1787/9789264286764-en
OECD (2013). Investing Together: Working Effectively across Levels of Government, OECD Multi-level Governance Studies. OECD Publishing. http://dx.doi.org/10.1787/9789264197022-en
Pellegrini, G., Terribile, F., Tarola, O., Muccigrosso, T., and Busillo, F. (2013). Does EU Regional Policy enhance growth? Papers in Regional Science, 92(1), 217-233. https://rsaiconnect.onlinelibrary.wiley.com/doi/full/10.1111/j.1435-5957.2012.00459.x
Rajan, R. and Zingales, L. (1998). Financial Dependence and Growth. The American Economic Review, 88(3), 559-586. www.jstor.org/stable/116849
Ramajo, J., Márquez, M., Hewings, G., and Salinas, M. (2008). Spatial heterogeneity and interregional spillovers in the European Union: do cohesion policies encourage convergence across regions? European Economic Review, 52, 551–567. https://doi.org/10.1016/j.euroecorev.2007.05.006
Schumpeter, J. (1942). Capitalism, socialism and democracy. Routledge.
Tanzi, V. and Davoodi, H. (1998). Corruption, Public Investment and Growth. In H. Shibata and T. Ihori (eds.), TheWelfare State, Public Investment and Growth. Springer-Verlag.
Tsvetkova, A., Ahrend, R., Oliveira-Martins, J., Lembcke, A. C., Knutsson, P., Jong, D., and Terzidis, N. (2020). The spatial dimension of productivity: Connecting the dots across industries, firms and places. OECD Regional Development Working Papers, No. 2020/01. OECD Publishing. https://doi.org/10.1787/ba5edb47-en
Información adicional
JEL Classification: C31; R11; R15