Articles
The statistical grid as a unit of observation and analysis: Andalusia, Spanish region case study
The statistical grid as a unit of observation and analysis: Andalusia, Spanish region case study
Investigaciones Regionales - Journal of Regional Research, núm. 59, pp. 149-165, 2024
Asociación Española de Ciencia Regional

Esta obra está bajo una Licencia Creative Commons Atribución-NoComercial 4.0 Internacional.
Recepción: 19 Julio 2023
Aprobación: 07 Diciembre 2023
Abstract: Units of observation with reduced dimensions and regular geometry have been increasingly generated in a recent, albeit already steady, trend towards further territorial data disaggregation. In this line of research, the present study reports the results of using the spatial distribution of population data and built-up areas at a high level of territorial data disaggregation with reduced dimensions and with a homogeneous observation unit by applying a regular grid consisting of 250-m square cells. The main objective was to show the results and advantages of working at a high level of spatial data disaggregation. This approach provides a more comprehensive knowledge of the territory and allows for a more accurate analysis of spatial patterns in the different variables under study, thereby enhancing the quality of decision-making processes.
Keywords: Grid, population, cadastre, building, dwelling.
Resumen: Existe una tendencia reciente, aunque ya consolidada, encaminada a la búsqueda de una mayor desagregación territorial de la información. En este contexto, la generación de unidades de observación de dimensiones reducidas y geometría regular ha ido tomando fuerza. Así, en este artículo se muestran los resultados de la utilización de datos de distribución espacial de la población y del espacio construido en un nivel de desagregación territorial de dimensiones reducidas y con una unidad de observación homogénea con una malla regular compuesta por celdas cuadradas de 250m de lado. El objetivo principal es mostrar los resultados y las ventajas que reporta trabajar con una mayor desagregación espacial de la información. El resultado es un conocimiento más exhaustivo del territorio y la posibilidad de estudiar de una forma más precisa los patrones de comportamiento de las distintas variables analizadas.
Palabras clave: Malla estadística, población, catastro, edificio, vivienda.
Introduction
Spatial analysis, like cartography, is a discipline that relies on two essential facts to represent information: all elements have a non-arbitrary location in space and defining and characteristic thematic attributes. Thus, in general, the information represented on a map and the observation unit used as a reference to process and represent this information must be defined. Physical data are represented using environmental or natural divisions, such as bioclimatic units, geographic districts, or others, depending on the thematic information. Socioeconomic data is usually aggregated in different administrative units, depending on the scale of representation and on the available data and is thus far more common at the provincial or municipal level.
The selected spatial scale (or level of detail) and observation unit can modify the perception and analysis of spatial patterns of the represented variable by modifying the quantitative data and their effect on the data distribution, which varies with the scale of analysis. Scale and zone effects are known in spatial data analysis as the Modifiable Areal Unit Problem (MAUP), which expresses how the correlation between two phenomena distributed in space can dramatically change with the size and shape of the spatial units used to measure the phenomena (Goerlich and Cantarino, 2012). Therefore, a higher spatial disaggregation of these data enables a more reliable and accurate analysis of territorial patterns.
Dasymetric maps with homogeneous units of observation have long been prepared for a wide range of applications and can be defined as choropleth maps where the areas with statistical information are represented as homogeneous areas, assuming that the represented data are homogeneously distributed throughout the territory. Quantitative data are expressed using superficial symbols in the units where the variable takes a uniform value. Thus, dasymetric maps with homogeneous units, generally cells, have been generated to present and analyze not only environmental data but also population distributions in units other than merely administrative divisions. The dimensions of these homogeneous units have not always been the same and, in some cases, have had to be adapted to the resolution of the corresponding CORINE Land Cover (Gallego, 2010).
Thus, in a recent trend towards further territorial data disaggregation, this information is often represented at the census tract level. However, this approach has two fundamental drawbacks. On the one hand, census tract boundaries are frequently changed to adapt to the needs of managing electoral processes. On the other hand, the spatial heterogeneity of these divisions is inconvenient due to the wide differences in their surface dimensions, which are often too large (Mora and Marti, 2015). Moreover, broadly speaking, “the unit of analysis, ‘census tract,’ does not ensure any homogeneity in terms of socioeconomic or demographic characteristics of its individuals, nor any uniformity in relation to the urbanization or shape of the territory covered by this tract” (Enrique, 2013, p. 5).
Considering the above, conducting a comprehensive analysis of the spatial distribution of socioeconomic variables requires not only disaggregating the data to the municipal level but also overcoming the rigidity of administrative boundaries in general, which greatly hinder the ability to relate data from different sources.
The Sustainable Development Goals, structured under Agenda 2030, define a plan of action for people, planet and prosperity, in order to achieve a sustainable future for all. Goals aiming to improve daily life conditions such as health, education, employment while reducing poverty, inequality, climate change, environmental degradation, and reaching prosperity, peace or justice require an integrated and indivisible balance of the three dimensions of sustainable development: the economic, social and environmental. Thus, goals are interrelated and interlinked, working with spatially disaggregated information allows us to approach territorial disparities on health, employment, income, housing characteristics, size, construction quality, etc. in greater detail.
Background and rationale
To clearly understand the territorial unit problem, we must first analyze spatial data disaggregation. This technique delves into the factors that affect the different phenomena that may occur in a territory. This subject has long been studied, and its main difficulty involves spatial data referencing. Currently, a very large volume of information is available, but its geocoding remains a difficult task. This referencing is frequently performed by correlating data with administrative units. In general, this approach is followed when analyzing and reporting socioeconomic data. The most disaggregated administrative division has usually been the municipality. Information at a more disaggregated level of detail is difficult to find. Therefore, this process must be analyzed in depth, studying methods for a higher level of disaggregation of statistical information. In this context, Eurostat has been promoting the development of a grid to disaggregate European population data as much as possible. The second step consists of integrating, together with demographic data, all statistical data on socioeconomic and environmental variables in a common unit of observation and analysis (Goerlich and Cantarino, 2012).
The European Forum for Geography and Statistics (EFGS) has been developing, with the support of Eurostat, the ESSnet projects, Geostat 1A, 1B, 2, and 3. The first two projects were aimed at developing methodological guidelines for transferring the 2011 population and housing census results to a harmonized and common 1-km2 cartographic grid, following the criteria established in the Infrastructure for Spatial Information in the European Community Directive (INSPIRE) (EFGS, 2013; Enrique et al., 2013b). The second project, 1B, aimed at representing data from the respective 2011 census, and the main purpose of the projects Geostat 2 and 3 was to foster statistical and spatial data integration to enhance the quality of socioeconomic and environmental analyses (EFGS, 2012; 2013; 2017).
This initiative has a global scope, beyond the European Union; the United Nations is also involved, through its Committee of Experts on Global Geospatial Information Management (UN-GGIM), an intergovernmental body of the United Nations Statistics Division (UNSD). These key experts have been working to integrate statistical and geospatial data to analyze territorial phenomena that may be relevant to the population more accurately (Petri, 2014). Studies conducted primarily in different European countries have initially delved into developing methods for implementing population data referencing at a high level of disaggregation, such as that of a 1-km2 cell. For this purpose, various techniques have been used, depending on the organization of the basic data in each country and on the corresponding decision-making. Ongoing research is aimed at developing techniques for more reliably and accurately georeferencing the entire population.
The EFGS organizes annual conferences. In the initial editions, research efforts were focused on improving methods for georeferencing population data. Some studies have detailed these tasks based on a top-down approach (Duque, 2013; Goerlich, 2013; Bresters, 2014; Chiocchini et al., 2014; Freire and Halkia, 2014). These studies usually start from municipal data, or information associated with some infra-municipal administrative division in the case of census tracts and combine this information with some data on land use to estimate the real location of the population within the territory. In turn, some studies have specifically analyzed how to treat demographic data that are difficult to georeference due to difficulties in finding references for their location (Kraus and Moravec, 2013). Other studies have presented the possibility of using bottom-up approaches and source data at the highest level of disaggregation, such as that of the building entrance, assigning them to the corresponding cell through the respective data assignment processes (Duque, 2015; Corcoran, 2017) or through hybrid techniques, combining bottom-up and top-down approaches, most often to complete the allocation of the population data that have not been referenced in the first step (Bueno and D’Antona, 2013; Enrique and Ojeda, 2013, Nieves et al., 2021 and Darin et al., 2021).
Spatial referencing at high levels of population data disaggregation is currently well established, at least for 1-km2 cells. The current trend is to integrate this population information with various other data. This is the fundamental purpose of this approach, and progress has been made over time although some data are difficult to reference due to difficulties in either managing or accessing them, or even knowing their location. In this sense, the power of analyses that integrate statistical data will likely lead to the need for referencing all information in the near future. Accordingly, this article shows the usefulness of performing analyses with spatially referenced information at a detailed level and delves into techniques for gathering data organized in this way. The themes on which it works are very varied. Thus, and to date, some studies have correlated data in spatial aggregation and disaggregation approaches as a tool for assessing environmental impacts in processes that help to achieve the United Nations Sustainable Development Goals (SDG) (Scott, 2017), whereas other studies have analyzed the integration with urban (Trainor, 2017), employment (Poelman, 2017), infrastructure (Santos, 2013), or traffic and mobility (Piela, 2014) data. Other studies have also integrated demographic and statistical data on land-use planning (Vala et al., 2015). Some experiments stand out, such as those referencing information extracted from cell phone geolocation and information emitted by them, thereby monitoring spatial behavior patterns of populations and their daily mobility patterns (García et al., 2013; Kuzma and Nikić, 2015; Salas et al., 2015; Condeço et al., 2018). In other experiments, demographic data have been integrated with information on production activities, studies showing the potential of a Geographic Information System (GIS) for these activities (Bao and She, 2014).
Based on the above, this article describes a set of experiments performed in Andalusia (Spain) in which demographic and cadastral data retrieved from administrative records were analyzed, referencing a series of phenomena in the territory showing the corresponding spatial distribution patterns. These experiments illustrate the power of analyzing data disaggregated into small and homogeneous cells in both shape and size.
Methodology
The tasks described in these projects are executed based on demographic and cadastral information for the Andalusia region. There are several million records of graphic and alphanumeric information reporting on population and building characteristics. PostgreSQL stores in a simple way all the data that compose the database and allows to systematize the processes of consultation and management of the information through the structured query language (SQL - Structured Query Language). These routines are stored in the system, which allows their reuse. This facilitates the process of updating the information when required.
Spatial Distribution of the Andalusian population, 2013–2020
The objective of this task was to represent the Andalusian population in a territorial disaggregation level with reduced dimensions and with a homogeneous unit of observation. For this purpose, a regular grid formed by square cells with 250-m sides was used in which the Andalusian population data were retrieved from the Andalusian Population Longitudinal Database (Base de Datos Longitudinal de la Población de Andalucía – BDLPA) (Viciana-Fernández et al., 2010). A regular grid was generated following the indications derived from experiments conducted by the EFGS Geostat project (EFGS, 2012, 2013 and 2017).
Population geocoded data used in the experiment was geocoded to building entrances, since x–y coordinates for building entrances are available in a standard reference system for Andalusia. Geocoded datapoints were added to each spatially corresponding cell (Figure 1). This approach made it possible to preserve statistical confidentiality and facilitate the disclosure and cartographic representation of information, as well as the possibilities of spatial analysis.
The data on population were geocoded by assigning geographic coordinates from the Unified Digital Street Map of Andalusia (Callejero Digital de Andalucía Unificado – CDAU) or the Building Census to BDLPA addresses, through data linkage (Christen and Churches, 2005; Christen, 2012; IECA, 2018). The process followed to link both datasets was complex and consisted of different phases (IECA, 2022) for georeferencing all BDLPA addresses, assigning to each of them the coordinates of the building entrance of the dwelling registered in CDAU or the Building Census. An X and Y coordinate of the alphanumeric database of CDAU building entrances (house numbers) and street names were assigned to the postal addresses of the dataset to be geocoded, using the postal addresses of both as the junction point between both datasets. Once a layer of points representing the building entrances with the number of inhabitants and their sociodemographic characteristics was generated, these geocoded data were added to each cell with 250-m sides.
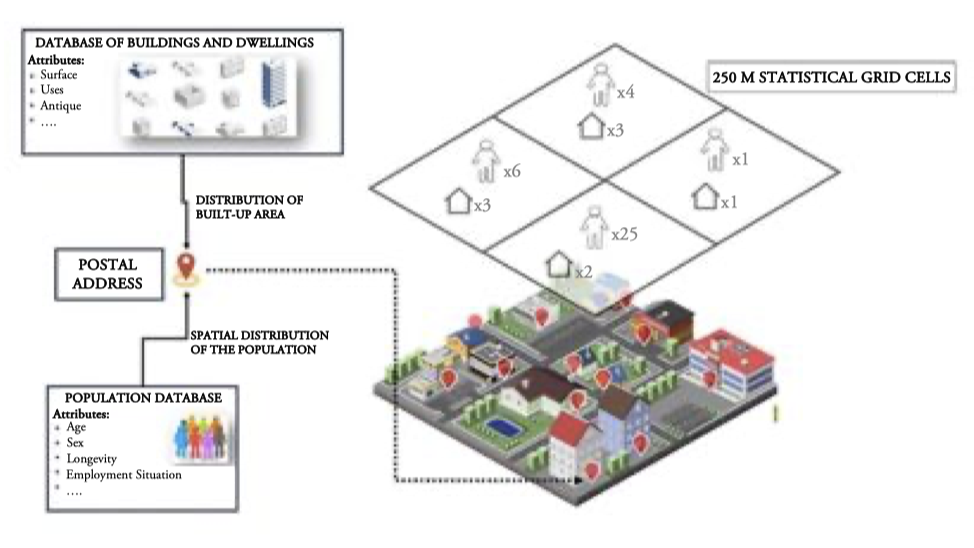
Figure 1
Methodology
The information represented in these maps refers to January 1 of the corresponding year and includes demographic (total population by sex, nationality, or age group) and labor (total employment by sex or employment status retrieved from Social Security records; and total number of job seekers, by sex or registered unemployment) data, as well as data on contributory pensions (retirees by sex; type; and by income from retirement, widowhood, disability, or other types of pensions).
Longitudinal Statistics of Survival and Longevity in Andalusia, 2002–2016
Another interesting experiment using a statistical grid in the Andalusian context was developed by longitudinally exploring BDLPA. Integrating statistical data on events with the different population census rounds and georeferencing the population data facilitated the development of longitudinal research in different areas with a wide range of personal, family, and environmental characteristics and with an infra-municipal territorial detail.
In this line of research, results on Standardized Mortality Ratio (SMR) data for 250m side cells have been published[1]. SRM indicator is not affected by the population structure, thus making it possible to compare mortality rates between populations with very different structures. SMR is calculated by estimating the number of cases (deaths) that would occur in a specific area, with a known structure, if it were subjected to the intensities determined by the standard rates. Thus, a different result can be obtained, which is termed “expected cases”. The ratio between the number of actually observed and expected deaths is the SMR indicator for a territory or area. Reducing the territorial scope of analysis from a census tract to a regular cell means that the observations in the unit of interest may not suffice to estimate the SMR indicator and its significance. For this reason, mortality indicators are also estimated in a small area, thereby assessing the Smoothed Standardized Mortality Ratio (SSMR).
SSMR was calculated using the risk exposure times in the 2002–2016 period at various levels of detail, thus showing the degree of mortality by cell and associating the data with population parameters (unemployment and educational level, among others) retrieved from the various administrative and census records.
Distribution of built-up area (250 m × 250 m cells), 2020
The objective of this activity was to provide information on the distribution of built-up areas in the territory and their characteristics. The distribution of buildings, dwellings, and non-residential premises in Andalusia were represented on a map, seeking a broad territorial disaggregation and spatial homogeneity of data retrieved from the Real Estate Cadastre (Catastro Inmobiliario – CI). In addition, their spatial relationship with all the information that can be integrated in the same statistical grid of demographic data was studied.
CI is a well-established, complete, and comprehensive administrative registry from which rich and illustrative information on the urban characteristics of the territory can be extracted from various points of view. Despite being prepared for fiscal, not statistical, purposes, this information is comprehensive and accurate in both its spatial and thematic components and is therefore a highly valuable source of statistical data with a very wide potential (Real Decreto Legislativo (RDL) [Royal Legislative Decree] 1/2004, March 5, Boletín Oficial del Estado (BOE) [government gazette] 58; Villarín, 2015; Pérez-Alcántara et al., 2016, 2017; Llausàs et al., 2018; Ojeda and Paneque, 2018).
During the project of characterization and distribution of data on the built-up area of Andalusia in regular cells, two key decisions were made. The first was related to the spatial unit of observation and its integration into the corresponding cell in each case. In Spain, cadastral data are basically organized using the cadastral parcel as a spatial reference. When working with both real (the parcel) and virtual (the cell) spatial features, a border space may belong to two cells. Thus, to facilitate the integration of cadastral information into cells, geometric point features were generated to gather all data on real estate located in that spatial entity. A layer of points has been generated, containing an access point for each real estate property included in the Cadastral file. The preferred identification method has been the identification of a point according to the real state entrance postal address. Although the cadastral centroid of the parcel can be used as a point feature, in this project, a layer of point features located in the space overlapping the location of the buildings was generated instead, thereby increasing the spatial accuracy in the location of the built elements (Figure 2). For this reason, a higher accuracy was also achieved in the statistical analysis of the thematic characteristics of the data and in their assignment to the cells of the statistical grid.
The second key decision was the definition of the elements to be identified from the cadastral data. These elements were buildings, dwellings, and non-residential premises, as well as their specific characteristics. In Spain, cadastral data are organized into the following three levels: parcel, real estate, and constructions. Cadastral data do not include buildings, dwellings, or non-residential premises, but the cadaster is nevertheless a source of data for identifying these features. Knowing the distribution and structure of the built-up area makes it possible to estimate the behavior of the population in terms of land use.
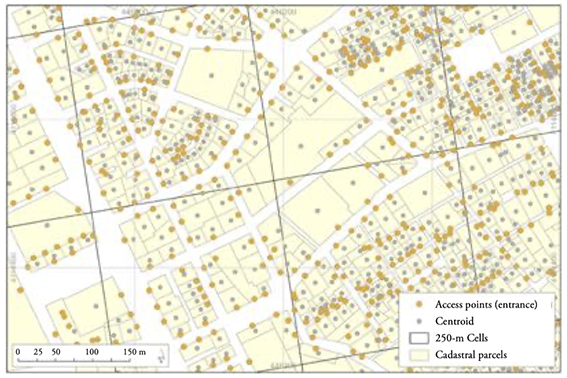
Figure 2
Location of the built elements in Granada
Results
The Institute of Statistics and Cartography of Andalusia (Instituto de Estadística y Cartografía de Andalucía – IECA) prepared its first population distribution map in 250-m cells in 2013. This map was a major qualitative advance. Since then, a map has been drawn with the most updated population distribution data every year by performing a georeferencing process combining a massive number of data using postal addresses as link information. In this process, the order of priority was set by stages. The first stage consisted of geocoding to an exact building entrance, continuing with the nearby building entrance and the center of the street (with location corrections). The main sources of data for locating the building entrance were firstly the CDAU and secondly the Population and Housing Census (Censo de Población y Viviendas). The eight editions that have been produced so far make it possible to assess the population evolution and the process of creating these layers. Thus, in 2013, a total of 8.3 million people were located to their building entrance, occupying 48,187 cells of a total of 1.42 million that covered 87,000 km2 of Andalusia. By 2020, 53,243 cells were occupied. This difference of more than 5,000 cells resulted not only from changes in the population distribution but also and primarily from the processes of cleaning up the location of the data. This process of identifying the spatial location of the population in the building entrance where they are living is becoming increasingly more accurate thanks to the gradual expansion of building entrance points from the different sources that are used for this purpose and to improvements in the processes of linking demographic data to those of building entrance sources. The number of inhabitants in Andalusia was very similar in the eight reference years (approximately 8.4 million people). The number of building entrance points with a resident population totaled 1.56 million in 2020 and 1.42 million in 2013. Even more significant are the figures for direct georeferencing of building entrance, which increased by almost one percentage point from 94.98 to 95.82% between 2014 and 2020. The allocation to the exact building entrance increased by 2.3 percentage points, whereas the allocation to the exact CDAU building entrance increased by just over 11 percentage points (72.7–83.8%).
| Year | Number of cells | Number of postal addresses | Number of building entrance | Geolocated population | % direct georeferencing | % indirect assignment | ||
| Total | Exact building entrance | Exact CDAU building entrance | ||||||
| 2013 | 48.187 | 1.554.321 | 1.421.015 | 100,0 | 93,30 | 6,70 | ||
| 2014 | 50.602 | 1.682.121 | 1.522.435 | 100,0 | 94,98 | 92,12 | 72,70 | 5,02 |
| 2015 | 50.314 | 1.685.554 | 1.523.095 | 100,0 | 94,86 | 91,89 | 72,61 | 5,14 |
| 2016 | 50.818 | 1.691.981 | 1.514.291 | 100,0 | 95,46 | 92,12 | 73,36 | 4,54 |
| 2017 | 50.758 | 1.679.346 | 1.525.520 | 100,0 | 95,40 | 92,20 | 74,85 | 4,60 |
| 2018 | 50.747 | 1.679.961 | 1.534.642 | 100,0 | 95,88 | 93,05 | 81,91 | 4,12 |
| 2019 | 52.599 | 1.686.224 | 1.549.755 | 100,0 | 96,08 | 93,74 | 83,26 | 3,92 |
| 2020 | 53.243 | 1.690.676 | 1.559.834 | 100,0 | 95,82 | 94,46 | 83,81 | 4,18 |
The percentage of occupied cells per resident population ranged from 3.50–3.76% of all cells in Andalusia depending on the year. The referencing of the population to the building entrances that matched their place of residence and subsequent aggregation into cells highlighted the different distributions of the population in the territory. Thus, approximately 40% of the inhabited cells were occupied by 10 or fewer inhabitants, although 0.5–1% of the population lived in this type of cell. This was in contrast to a more marked characteristic of Andalusia, the strong concentration of the population in urban centers with high demographic density, both in traditional Andalusian settlements and more recently, in densely populated urban centers. More than 60% of the population lived in cells ranging from 100 to 1,000 inhabitants, and almost 30% of the population lived in cells with a number of inhabitants ranging from 1,000–2,500. Because the cells were homogenous in terms of shape and size, the data could be directly compared spatially and temporally because they were not affected by the variability in the size of the units of observation.
The statistical grid was established as one of the European Union territorial typologies in the TERCET[2] regulation, together with the Nomenclature of Territorial Units for Statistics (NUTS) and Local Administrative Units (LAU). The population distribution by nationality, age group, and any information considered interesting, can also be determined, thus highlighting the potential of these analyses. IECA produces and reports most of these data[3]. Figure 3 shows the detail of the population of 60 years of age or older, living alone or in the company of people 60 years of age or older, as well as the percentage of people in that age group with respect to the total population. These data highlight the distribution pattern and the need for specific public policies to meet the needs of this population group. By now, the usefulness of using small and regular units is clear. The information presented in Figure 3 using 250-m cells as the unit of observation is presented in Figure 4 using the census tract. The homogeneity of each cell facilitates the spatial analysis, highlighting territorial patterns. As a heterogeneous spatial unit, the census tract complicates these analysis tasks.
The information that can be consulted and analyzed in these population distribution maps has been expanding across editions. Data on the number of pensions and on the amounts received for contributory pensions has been provided since 2015. Data on the population seeking employment, disaggregated by gender, has been reported since 2017, and information on the population permanence in the municipality of residence has been added since 2018.
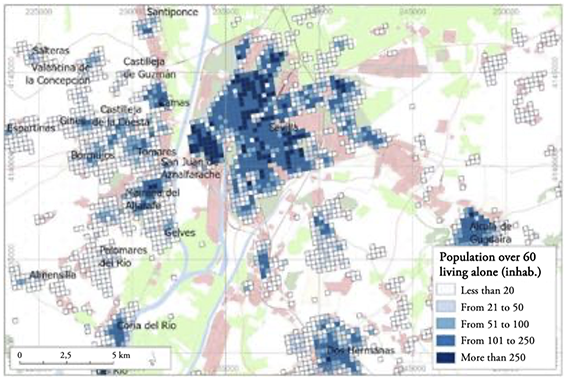
Figure 3
Population 60 years of age or older, living alone or in the company of people 60 years of age or older in 2020. Seville
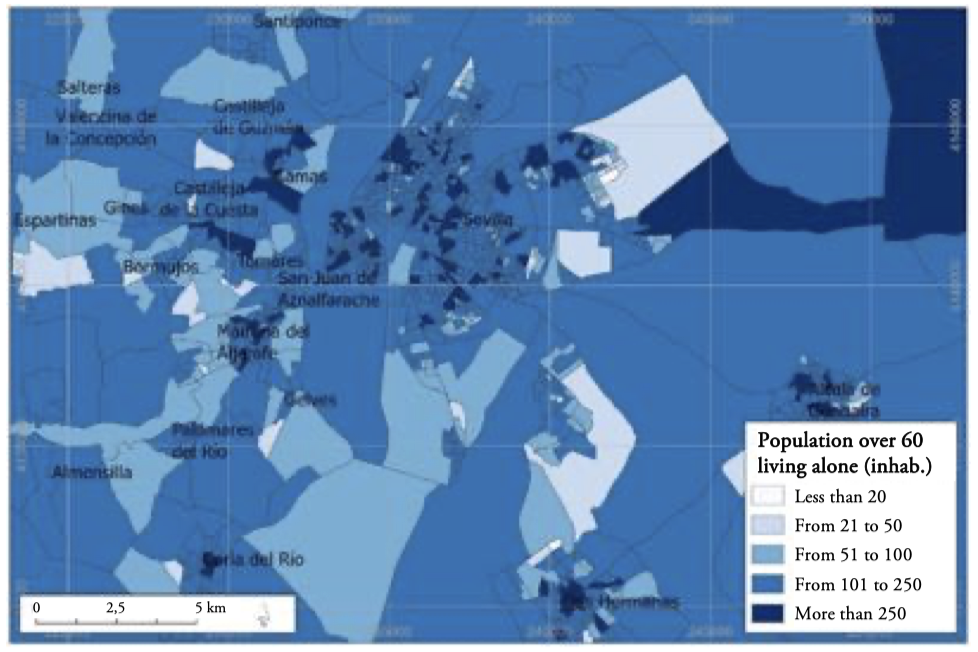
Figure 4.
Population 60 years of age or older, living alone or in the company of people 60 years of age or older in 2020 (census tracts). Seville
This analysis is also enriched by including data on longitudinal survival and longevity statistics. These data, combined with the previous information, reveal the existing relationships between them. In general, cells with a moderately low or low SSMR (Figure 5) are located in areas with a high socioeconomic level, whereas those with high or moderately high SSMR correspond to areas of a more disadvantaged socioeconomic level.
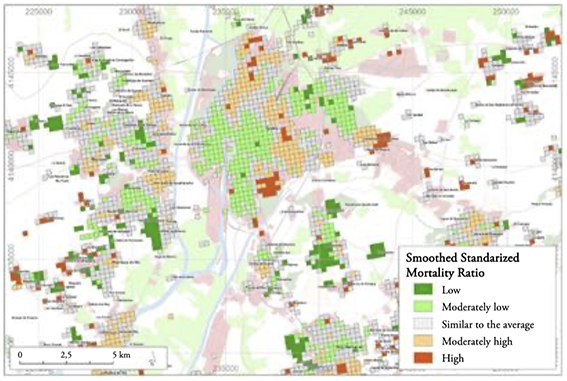
Figure 5.
Smoothed Standardized Mortality Ratio (SSMR) in Seville
This correlation was verified when comparing these SSMR data with the data on unemployment percentages or average pension income contained in each cell (Escudero et al., 2023). The results showed that cells with low or moderately low mortality matched those where retirement pensions ranged from €1,800–€2,000 on average, in contrast to those in areas with high or moderately high mortality, where the retirement pensions ranged from €750–€1,000 (Figure 6).
Data on built-up areas can also be included in the analysis, which makes it possible to know, for example, the typology or the average dimensions of dwellings of the population with above- or below-average mortality. The data showed that population with low mortality rates tended to live in dwellings found in cells of densely populated urban expansion zones of predominantly residential use, in isolated single-family dwellings, and in large parcels. Medium and large houses prevailed in the cells where swimming pools and private gardens were commonly found. Similarly, other cells with high mortality matched the locations where the housing quality was lower than in the previous cases. This does not indicate that the residence directly determines the mortality ratio but does indicate that some socioeconomic characteristics are more frequent in populations with moderately low mortality.
Within the cadastral information, all real estate was characterized for the valuation of each property. This assessment generated a zoning with strikingly marked patterns, which also matched the zones generated from SSMR data.
The data analyzed in this article and its form of aggregation in regular cells open up opportunities to analyze many other variables related to health, employment, and quality of life in general within the different clusters that can be established in the territory, as well as the spatial patterns that explain such clusters. In recent years, maps of the spatial distribution of deaths by cause at a municipal scale have been drawn, highlighting deaths caused by some types of cancer, while presenting data at the municipal level. At these scales, it is difficult to explain all the reasons for the observed territorial patterns, but in more disaggregated spatial units and with related thematic content, the causes of specific spatial patterns and their relationships with some socioeconomic parameters can be addressed.
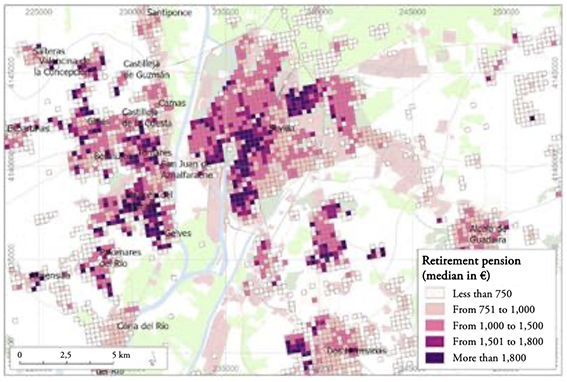
Figure 6.
Retirement pension income in Seville
Of the cells that cover the Andalusian territory, 216,154 included at least one building, accounting for 15.3% of the total number of cells, in contrast to 3.7% cells by population. This difference identifies the territorial segmentation of building uses and shows that the population primarily lives in defined areas of the territory. Under these conditions, the distribution of the population by place of residence must be considered, for example, by comparing the map at night and day, or seasonally, to locate the population in other places for different reasons (work, studying, and vacation, among others).
Within the cells with at least one building, the density ranged widely, and a high number of cells had a low density of buildings. In addition, 181,018 cells had fewer than 10 buildings, accounting for 83.7% of the total number of cells with buildings. Others had a high number of buildings (70 cells had more than 400 buildings) and largely corresponded to areas with a high density of multi-family dwellings or, to a lesser extent, single-family dwellings in condominiums, in settlements with a traditional structure, or densely populated urban centers. In these cases, the high density reflected the number of buildings, but not the built-up area, since the latter was found in cells with other types of buildings with industrial, port, or military uses. The information that could be extracted refers to specific characteristics of the buildings, not only related to their use but also to their main characteristics.
In the construction category, the prevailing presence of buildings in each cell was classified into high, medium, or low, based on criteria established by the Directorate-General for the Cadastre (Dirección General del Catastro – DGC) and reflected the territorial pattern of this variable. This category refers to the materials, techniques, and finishes that determine the value of the construction within the cadastral valuation.
The age of the buildings is a variable that makes it possible to analyze the territory and monitor how the built-up area grows, the evolution of cities, and land-use patterns. The year of construction also reflects other less visible aspects, such as those derived from adaptations to current regulations. The adaptation of buildings to guidelines on energy efficiency offers an indirect approach to their quality linked to their construction characteristics and to their spatial distribution. Energy efficiency is an equally relevant aspect in achieving the Sustainable Development Goals, where Goal 7 indicates double the global rate of improvement in energy efficiency by 2030.
Another variable that characterized the built-up area was the height of the buildings (Figure 7), expressed as square meters of built-up area on a given plot of land. Striking patterns were observed with low-rise buildings, in terms of the number of floors in residential buildings in areas of traditional settlements; single-family dwellings; or buildings with specific uses, such as industrial, sports, cultural, entertainment, or religious venues, whereas buildings with a high number of floors were found in expanding areas with residential buildings, such as multi-family dwellings, offices, or leisure and hospitality buildings.
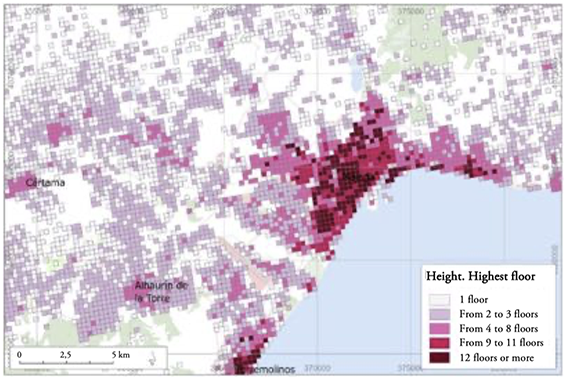
Figure 7
Height of buildings in Malaga
Of the more than 216,000 cells with at least one building, 141,694 had at least one dwelling, accounting for 10.0% of all cells that cover the Andalusian territory. The housing density per cell also varied widely. A high number of cells had a low housing density; more specifically, 109,423 cells had fewer than 10 dwellings (77.2% of the total number of cells with dwellings), in contrast to densely built cells (1,669 cells with more than 500 dwellings). Moreover, just over 60,000 cells had only one dwelling, a fact that is indicative of the existence of some dispersion of dwellings in a few areas of the Andalusian territory, in contrast to a strong concentration in some urban areas. The latter is a typical settlement in Andalusia.
In the analysis based on information of the built-up area and specifically of the residential area, referencing the information of regular cells with small dimensions was also highly useful. Thus, more than half of the homes in Andalusia had a built-up area ≤100 m², which ranged as a function of the typology of the dwellings and the areas where these dwellings were located. Figure 8 shows a highly frequent pattern, such as that of the urban center of an Andalusian city, in this case Córdoba, where the housing distribution varied with its own characteristics. A significant number of multi-family dwellings were concentrated in the central urban area, in contrast to suburban areas, with a greater presence of single-family dwellings and significantly larger dwellings than those observed in the central area of Córdoba.
Relationships between the different phenomena under study can be identified by integrating information from different sources into homogeneous and small units of observation. The long weeks of lockdown decreed in Andalusia and Spain in the spring of 2020 due to the coronavirus disease 2019 (COVID-19)-pandemic highlighted the importance of having information on the characteristics of residences to assess the circumstances and conditions under which the population lived during this period. The availability of these data on dwellings and population in an identical zonal system facilitates the study of the profile and characteristics of dwellings built in inhabited areas.
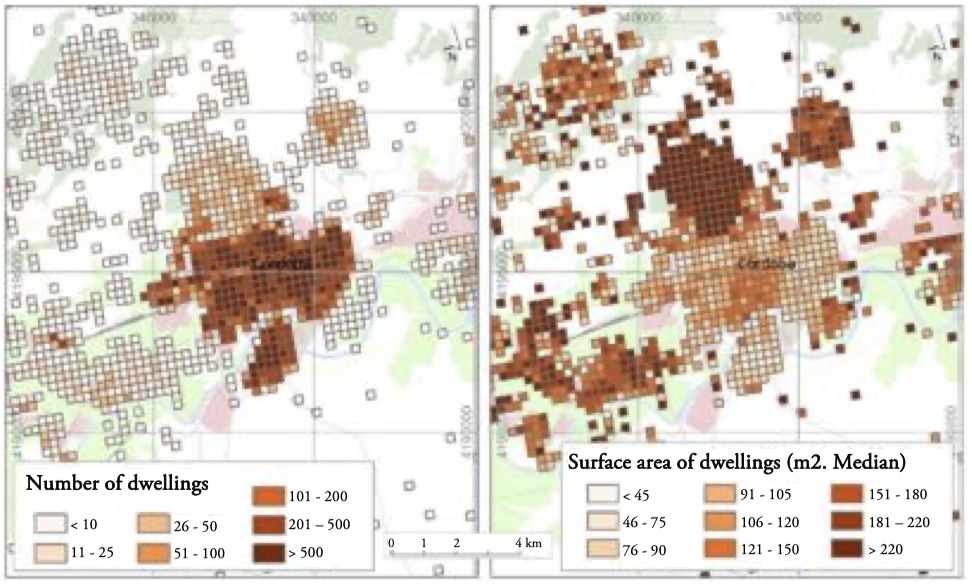
Figure 8.
Total number and size of dwellings in Cordoba
Conclusions
Processing large volumes of spatial data and linking records are essential steps in these projects. Accordingly, technological developments in recent decades have increased these capabilities.
Although both the sources of information and the georeferencing processes have been perfected in successive editions, the percentage of non-georeferenced addresses has remained relatively stable at approximately 4.5% since 2016. Analyzing the casuistry of these non-georeferenced addresses, inquiring whether they are concentrated in specific areas of the territory, whether some addresses are repeated or, conversely, renewed in each edition and correspond to new addresses, and assessing the effect of the indirect location of these addresses are lines of improvement that require a specific analysis.
Regarding the location of the cadastral information, the most relevant decision is to generate the specific cadastral feature in the accurate place where the real estate is located within the cadastral parcel, thus reducing the spatial distortions that occur when locating the cadastral information in the centroid of the parcels. Among these decisions, the location of the entity was also shown to be key, coinciding with the place of access to the buildings from the public space. The location criteria are unified and accurately defined so that they can be refined in future processes.
A regular grid, in shape and size, was used in the studies analyzed in this article, and proved to be highly useful for the tasks of analysis and synthesis of information and decisively helped to trace the patterns of spatial behavior of the variables. Such a grid is particularly useful, among other things, in planning public services. This grid makes it possible to individualize the territory, to integrate information in a simple way, to dimensionalize the information integrated in each unit, and facilitate comparison between units and between areas since this comparability is not distorted by the dimensions or by the shape of the unit of analysis. As such, this grid is an advance in solving problems raised by MAUP.
These aspects were clearly observed in the examples analyzed in section 3, which included some samples of data from significant examples within the territory with diverse variables. The homogeneity of all cells facilitated their comparison, in contrast to the use of administrative units, thus making it is easier to determine, after performing the pertinent analysis, the type of cell in which each of them was located, based on the population density and its socioeconomic characteristics, as well as that of the urban variables. The operations of analysis were not altered by the heterogeneity of the territorial units.
Regarding the size of the unit, the same approach as that used for the map of Europe with 1-km cells was followed, albeit reducing the size of the cell to 250-m. These cell dimensions were highly suitable for achieving the objectives set out in these studies because, on the one hand, a very broad level of disaggregation was reached and, on the other hand, features with a considerably valuable level of spatial homogeneity were generated.
However, in order to develop it, it is necessary to have georeferenced information at a high level of disaggregation. There are still significant difficulties in carrying out this type of analysis, since there is still little disaggregated information that can be used. Thus, projects such as these are intended to demonstrate the potential of analyses of this type and, together with the results of other works that have advanced along the same lines, to promote that in the future it will be considered increasingly necessary to have highly disaggregated and correctly georeferenced information. This information should be increasingly accessible for the analysis of the territory from different thematic perspectives, which will improve the analyses developed with information in administrative units.
References
Bao, S., and She, B. (2014). Spatial Data Integration with China and US Geo-Explorers. EFGS Krakow Conference 2014. 22-24 October, Krakow, Poland.
Bresters, P. (2014). Harmonizing population grid data into the INSPIRE data model. EFGS Krakow Conference 2014. 22-24 October, Krakow, Poland.
Bueno, M. C., Martin, D., and D’Antona, A. (2013). Brazilian Statistical Grid - a hybrid approach. EFGS Sofia Conference 2013, 23-25 October, Sofia, Bulgaria. https://www.efgs.info/wp-content/uploads/conferences/efgs/2013/Conference_EFGS2013_2410_4_BuenoPaper.pdf
Chiocchini, R., Mugnoli, S., Esposto, A., Lipizzi, F., Lombardo, G., and Minguzzi, R. (2014). Land Cover and Census integration geographic datasets to realize a statistic synthetic map. EFGS Krakow Conference 2014. 22-24 October, Krakow, Poland.
Condeço-Melhorado, A., Reggiani, A., and Gutiérrez, J. (2018). New Data and Methods in Accessibility Analysis. Networks and Spatial Economics, 18, 237–240. https://doi.org/10.1007/s11067-018-9404-3
Corcoran, D. (2017). The role of national address database in adding value to Irish statistics. EFGS Dublin Conference, 2017, 2-3 November, Dublin, Ireland.
Christen, P., and Churches, T. (2005). Febrl - Freely extensible biomedical record linkage. Australian National University. http://users.cecs.anu.edu.au/~Peter.Christen/Febrl/febrl-0.3/febrldoc-0.3/manual.html
Christen, P. (2012). Data Matching. Concepts and Techniques for Record Linkage, Entity Resolution, and Duplicate Detection. Springer Berlin. https://doi.org/10.1007/978-3-642-31164-2
Darin, E., Boo, G., & Tatem, A. (2021). A bottom-up population modelling approach to complement the population and housing census. The 2021 International Population Conference (IPC2021). Hyderabad, India, 5-10 December 2021.
Duque, I. (2013). Using Census 2011 geodata of Spain. EFGS Sofia Conference, 2013, 23-25 October, Sofia, Bulgaria.
Duque, I. (2015). Surrounding paths for improving spatial point addresses in Spanish statistical production. EFGS Vienna Conference 2015. 10-12 November, Vienna, Austria.
Enrique, I. (2013). La movilidad cotidiana en las regiones urbanas de Andalucía. La movilidad según tipos de planeamientos. Instituto de Estadística y Cartografía de Andalucía. Sevilla. https://www.juntadeandalucia.es/institutodeestadisticaycartografia/dega/sites/default/files/docs/movilidad-en-las-regiones-urbanas-poblamiento.pdf
Enrique, I., Molina, J. E., Ojeda, S., Escudero, M. y Pérez, G. (2013). Distribución espacial de la población en Andalucía. Año 2013. Cuadernos Geográficos, 52(2), 153-157. https://doi.org/10.30827/cuadgeo.v52i2.1518
Enrique, I., and Ojeda, S. (2013). A population grid for Andalusia (Spain). EFGS Sofia Conference, 2013, 23-25 October, Sofia, Bulgaria.
Escudero-Tena, M., Ojeda-Casares, S., Moya, L. A., & Enrique-Regueira, I. (2023). La malla estadística como unidad de análisis espacial. Razón de mortalidad, población y vivienda. Revista EURE - Revista De Estudios Urbano Regionales, 50(150). https://doi.org/10.7764/EURE.50.150.11
European Forum for GeoStatistics, EFGS (2012). ESSnet project GEOSTAT 1A-Representing Census data in a European population grid-Final Report. Eurostat-Luxembourg. https://www.efgs.info/wp-content/uploads/geostat/1a/GEOSTAT1A-final-report.pdf
European Forum for GeoStatistics, EFGS (2013). ESSnet project GEOSTAT 1B-Representing Census data in a European population grid-Final Report. Eurostat-Luxembourg. https://www.efgs.info/wp-content/uploads/geostat/1b/GEOSTAT1B-final-technical-report.pdf
European Forum for Geography and Statistics, EFGS (2017). A Point-based Foundation for Statistics. Final report from the GEOSTAT 2 project. Eurostat-Luxembourg. https://www.efgs.info/wp-content/uploads/2017/03/GEOSTAT2ReportMain.pdf
Freire, S., and Halkia, M. (2014). GHSL application in Europe: Towards new population grids. EFGS Krakow Conference 2014. 22-24 October, Krakow, Poland.
Gallego, F. J. (2010). A population density grid of the European Union. Population and Evironment, 31(6), 460–473. https://publications.jrc.ec.europa.eu/repository/handle/JRC47485
García, J. C., Gutiérrez, J., and Cardozo, O.D. (2013). Walking accessibility to public transport: an analysis based on microdata and GIS. Environment and Planning B: Planning and Design, 40, 1087-1102. https://doi.org/10.1068/b39008
Goerlich Gisbert, F. J., and Cantarino Martí, I. (2012). Una grid de densidad de población para España. Fundación BBVA.
Goerlich, F. (2013). Urban/Rural Areas: Population density (from a 1 km2 grid), land cover and remoteness as basic elements for an urban/rural typology at LAU2 level. EFGS Sofia Conference, 2013, 23-25 October, Sofia, Bulgaria.
IECA (2018). Memoria Técnica de la Actividad “Métodos Automáticos de Enlace de Registros”. Instituto de Estadística y Cartografía de Andalucía. https://www.juntadeandalucia.es/institutodeestadisticaycartografia/dega/sites/default/files/docs/149-alink-MT130011.pdf
IECA (2022). Geocodificación de las direcciones postales de la BDLPA para la generación de la Distribución Espacial de la Población en Andalucía. Instituto de Estadística y Cartografía de Andalucía. https://www.juntadeandalucia.es/institutodeestadisticaycartografia/dega/sites/default/files/docs/073-distribucion-espacial-poblacion-Informe_geopob_30112023.pdf
Kraus, J., and Moravec, S. (2013). Disaggregation Methods for Georeferencing Inhabitants with Unknown Place of Residence: The Case Study of Population Census 2011 in the Czech Republic. EFGS Sofia Conference, 2013, 23-25 October, Sofia, Bulgaria.
Kuzma, I., and Nikić, B. (2015). Mobile positioning and Statistical derivatives - The way forward? EFGS Vienna Conference 2015. 10-12 November, Vienna, Austria.
Llausàs, A. et al. (2018). Applicability of cadastral data to support the estimation of water use in private swimming pools. Environment and Planning B: Urban Analytics and City Science, 46(6), 1165-1181. https://doi.org/10.1177/2399808318756370
Mora, R. T., and Marti, P. (2015). Desagregación poblacional a partir de datos catastrales. En J. la Riva, P. Ibarra, R. Montorio & M. Rodrigues (Eds.) (2015). Análisis espacial y representación geográfica: innovación y aplicación (pp. 305-314). Universidad de Zaragoza-AGE.
Nieves, J., Bondarenko, M., Kerr, D., Ves, V., Yetman, G., Sinha, P., Clarke, D. J., Sorichetta, A., Stevens, F.R., Gaughan, A. E., & Tatem, A.J. (2021). Measuring the contribution of built-settlement data to global population mapping. Social Sciences & Humanities Open, 3(1). https://doi.org/10.1016/j.ssaho.2020.100102
Ojeda, S., and Paneque, P. (2018). Análisis del consumo doméstico de agua por habitante a escala de detalle en el sistema de abastecimiento de Aljarafesa. En Tecnologías de la Información Geográfica: perspectivas multidisciplinares en la sociedad del conocimiento. Actas del XVIII Congreso Nacional de Tecnologías de Información Geográfica. (pp. 636-647). Asociación de Geógrafos Españoles (AGE) y Universidad de Valencia.
Petri, E. (2014). Integration of statistical and geospatial information – An overview of European and global initiatives. EFGS Krakow Conference 2014. 22-24 October, Krakow, Poland.
Pérez-Alcántara, J. P., Díaz-Cuevas, M. P., Álvarez-Francoso, J. I., & Ojeda-Zújar, J. (2016). Métodos de adscripción tratamiento espacial para la generación y visualización de indicadores de vivienda (GRID) a través de catastro. En Aplicaciones de las Tecnologías de la Información Geográfica (TIG) para el desarrollo económico sostenible (pp. 224-234). XVII Congreso Nacional de Tecnologías de Información Geográfica, Málaga, 29, 30 de junio y 1 de julio 2016.
Pérez-Alcántara, J. P., Ojeda-Zújar, J., Díaz-Cuevas, M. P., & Álvarez-Francoso, J. I. (2017). Integración de Datos Poblacionales y Catastrales en estructura GRID: primeros resultados para el espacio residencial en el litoral andaluz, (pp. 1619-1628). Actas del XXV Congreso de la Asociación de Geógrafos Españoles. Madrid, 25-27 de octubre de 2017.
Piela, P. (2014). Commuting time for every employed: combining traffic sensors and many other data sources for population statistics. EFGS Krakow Conference 2014. 22-24 October, Krakow, Poland.
Poelman, H. (2017). Mapping high-resolution population and employment data in urban areas, using Copernicus Urban Atlas as a framework: Some tests taking into account the third dimension. EFGS Dublin Conference, 2017, 2-3 November, Dublin, Ireland.
Real Decreto Legislativo 1/2004, de 5 de marzo, por el que se aprueba el texto refundido de la Ley del Catastro Inmobiliario. Boletín Oficial del Estado número 58.
Salas-Olmedo, M. H., García Palomares, J. C., Gutiérrez, J., & Moya-Gómez, B. (2015). Dynamic accessibility analysis using big data. ERSA 55th Congress World Renaissance: Changing roles for people and places. Lisbon, 25-28 August 2015.
Santos, A. (2013). Using the European Grid “ETRS/LAEA_PT_1K” as the foundation for the new Portuguese Sampling Infrastructure. EFGS Sofia Conference, 2013, 23-25 October, Sofia, Bulgaria.
Scott, G. (2017). Disaggregation by Geographic Location: The geo-statistical dimensions of the SDGs. EFGS Dublin Conference, 2017, 2-3 November, Dublin, Ireland.
Trainor, T. (2017). The Benefits of Coordinating Statistical and Geospatial Data for Smart Cities within the Framework of the 2030 Sustainable Development Agenda. EFGS Dublin Conference, 2017, 2-3 November, Dublin, Ireland.
Vala, F., Mário Caetano, M., and Nunes, C. (2015). Bridging geographical and statistical information: a focus on inter-organizational cooperation in Portugal between INE and DGT. EFGS Vienna Conference 2015. 10-12 November, Vienna, Austria.
Viciana-Fernández, F. J., Montañés-Cobo, V., Cánovas-Balboa, M. R., and Poza-Cruz, E. (2010). Base de Datos Longitudinal de Población de Andalucía (BDLPA): Modelo de datos y sistema de gestión. XVII Jornadas Estadísticas de las Comunidades Autónomas. Cáceres, 20-23 de octubre de 2010. https://docplayer.es/6043204-Base-de-datos-longitudinal-de-poblacion-de-andalucia-bdlpa-modelo-de-datos-y-sistema-de-gestion.html
Villarín-Clavería M. C. (2015). Factores Explicativos de la Demanda Doméstica de Agua. Estudio a Microescala del Municipio de Sevilla. Tesis Doctoral, Universidad de Sevilla.
Información adicional
JEL Classification: I31; I14; R23