Articles
The waiting times distribution of public hospitals using a GAMLSS approach: the case of Andalusia (Spain)
The waiting times distribution of public hospitals using a GAMLSS approach: the case of Andalusia (Spain)
Investigaciones Regionales - Journal of Regional Research, núm. 59, pp. 167-191, 2024
Asociación Española de Ciencia Regional

Esta obra está bajo una Licencia Creative Commons Atribución-NoComercial 4.0 Internacional.
Recepción: 15 Diciembre 2022
Aprobación: 10 Octubre 2023
Resumen: Los tiempos de espera de los pacientes se deben al desequilibrio entre la oferta disponible y la demanda existente en el sector sanitario. Superar los tiempos máximos de espera puede empeorar las enfermedades y suponer costes adicionales para los sistemas de salud públicos. Este artículo estudia la distribución de probabilidad teórica que mejor se ajusta a los tiempos medios de espera para cirugías no urgentes y primeras consultas ambulatorias en los hospitales públicos españoles de la región de Andalucía. Para ello aplicamos Modelos Aditivos Generalizados de Ubicación, Escala y Forma, que cubren una amplia gama de distribuciones de probabilidad. Proponemos los modelos finales seleccionados como una herramienta a ser considerada por las autoridades sanitarias para una mejor gestión de los tiempos/listas de espera.
Palabras clave: Selección de modelo, GAIC, GAMLSS, listas de espera, tiempos de espera.
Abstract: Patients’ waiting times are caused by the imbalance between the available supply and the existing demand in the health sector. Exceeding maximum waiting times may worsen diseases and entail additional costs to public health systems. This paper studies the theoretical probability distribution that best fits the average waiting times for non-urgent surgeries and first outpatient consultations for Spanish public hospitals in the region of Andalusia. For doing this we apply Generalized Additive Models for Location, Scale and Shape, which cover a wide range of probability distributions. We propose the final selected models as a tool to be considered by health authorities for a better management of waiting times/lists.
Keywords: Model selection, GAIC, GAMLSS, waiting lists, waiting times.
Introduction
The problem of waiting lists is a worldwide issue in public health systems. Countries must deal with the main two challenges that waiting list encompasses: the total number of people on the waiting list and the time of healthcare delay. Efficient management of these lists by national health systems will make their users more satisfied, while achieving less damage to their health, since sometimes long waiting times can aggravate illnesses and even lead to death.
As evidence of the relevance of this topic, the OECD has also put the focus on waiting times, publishing reports, see for example OECD (2020), and establishing a database, Waiting Times for Health Services (https://data.oecd.org/health.htm). The information published on waiting times corresponds to selected elective (non-emergency) surgeries, such as knee and hip replacement, among others. The database includes waiting times from specialist assessment to treatment and waiting times of patients on the list. Nevertheless, it is important to note that the data is not homogeneous given that the methodology of computation differs in most countries.
There exists a considerable body of literature on waiting times. Here we summarize the contributions analyzing waiting times according to different national health systems. The present work focuses on the Spanish National Health System (SNHS) which has been considered in recent years by Abásolo et al. (2014a, 2014b), Díaz and Iglesias-Gómez (2013), Granado and Vega (2014), and López-Valcarcel and Barber (2017), between others. Abásolo et al. (2014a), using aggregate data of all the 17 Spanish regions and Ceuta and Melilla, study patients’ socioeconomic status and identify the existence of a high degree of asymmetry in the distribution of waiting times, and Abásolo et al. (2014b) estimate that the non-urgent surgery total waiting time distribution is markedly positive asymmetric when analyzing three surgical procedures in the Spanish regions of Galicia and Murcia. Díaz and Iglesias-Gómez (2013) and Granado and Vega (2014) study the productivity and efficiency of the SNHS by regions through DEA (Data Envelopment Analysis) models. Both studies consider data covering all Spanish regions. The first includes in the model the satisfaction perceived in hospitals and specialized care. The second proposes using the DEA efficiency analysis as a hospital benchmarking tool. The results show important differences between regional health systems. López-Valcarcel and Barber (2017) reviews economic and medical research publications to analyze the effects of the actions taken in the national public health system after the economic and financial crisis of 2008. Inequalities in waiting lists due to socioeconomic status have been discussed by Abásolo et al. (2014a) in the case of Spain, Monstad et al. (2014) in Norway, and Simonsen et al. (2020) in Denmark, among others. The latest contributions analyzing the SNHS apply econometric models and show that there is growing evidence that among patients with similar levels of need, waiting times often differ according to socioeconomic status, see Garcia-Corchero and Jiménez (2022), and Bosque-Mercader et al. (2023). Related to the Portuguese National Health System, Madeira et al. (2021) analyzes the relationship between operational and healthcare professional costs and waiting lists, and Cima and Almeida (2022) estimates survival models introducing cancellation rates as censored data. Finally, in the case of the English National Health Service, Dawson et al. (2004) studies whether patient choice is an effective mechanism to reduce waiting times, Dimakou et al. (2015) finds important differences on the ‘scale’ and on the ‘shape’ of admission rates, and Nikolova et al. (2016) analyzes the impact of waiting times on the effectiveness of treatment from different surgeries.
Given the role that hospitals play in the phenomenon of waiting lists and, specifically, in waiting times, we will focus on modelling waiting times at the hospital level for the Spanish public health system, specifically for its most populated region: Andalusia. The analysis of the behavior of the response variable is crucial to carry out an econometric study, since, for example, linear models require the normality assumption. Therefore, the main goals are: first, to establish a correct functional form of the waiting time variable; and second to have a forecasting tool based on the waiting times probabilities that can be estimated with the final selected distribution. The analysis will be done at two levels: for non-urgent surgery waiting times and for outpatient consultations waiting times (first visit), for the latest available data, June 2022. We will analize the entire set of Andalusian public hospitals, and four concerted hospitals which have established some type of agreement with the Andalusian Health System (AHS, from now on). Concerted hospitals are approved and integrated into the care network of the AHS. Throughout the text, we refer to all hospitals under study as public hospitals.
The methodology and the study carried out here is exportable to other Spanish regions as well as to other countries. Priority is given to the task of finding an optimal theoretical model that fits the empirical distribution of the data. We use the GAMLSS methodology (Generalized additive models for location, scale and shape) proposed by Rigby and Stasinopoulos (2001, 2005), and goodness-of-fit instruments, both graphical, Cullen and Frey (1999) graph, and through information criteria such as GAIC (Generalized Akaike information criterion), Akaike (1983). The GAMLSS is an approach that substantially improves generalized linear models and generalized additive models and is applicable both to a single variable and to an econometric model. In the latter case, a prior study of the dependent variable to be analyzed is required, an issue that goes unnoticed in most econometric studies. In our case, for each variable of average waiting time, surgery and outpatient consultations, we estimate the probability that an Andalusian hospital exceeds a certain average waiting time. Based on this information, we estimate the number of hospitals and the number of patients on the waiting list who exceed these times. Given the characteristics of our variables, asymmetric and leptokurtic, the GAMLSS methodology is highly recommended.
Finding a suitable model that fits waiting times will help health institutions in the design of strategies, implementing better management resources and making them more efficient.
The paper is structured as follows: Section 2 describes the dataset and the methodology to fit the optimal theoretical density function to the observed data. Section 3 introduces the Spanish national health system features, as a whole and by regions. Section 4 presents a descriptive analysis of waiting times and waiting lists in Andalusian public hospitals, and the empirical analysis of waiting times is performed in Section 5. Finally, Section 6 presents some conclusions and insights for health authorities and policy makers.
Methodology
Previous to establish a correct functional form of the waiting time variable for the entire set of Andalusian public hospitals, using the Cullen and Frey graph and the GAMLSS methodology, we provide descriptive analyses of this variable at the regional level in Spain and for Andalusian hospitals.
Data
We begin the study on waiting times at the regional level with Andalusia, which publishes aggregate information in greater detail than in the national case. Specifically, data on average waiting times for the entire region is available for each province and by hospitals, for non-urgent surgeries[1] and for outpatient consultations, from June 2019 to June 2022[2]. Finding this information by public hospitals has not been possible for other regions, so the study in subsequent sections has been restricted to Andalusia, which is the second largest region in Spain and the one with the largest population.
According to the AHS, a surgery waiting list is defined as patients registered in the Surgical Demand Registry, pending a non-urgent intervention. In this list we can find the following types of patients:
· Patients on the surgical waiting list with a guarantee: Patients with a guaranteed response time of 90, 120 or 180 days and whose registration maintains the term guarantee of response[3]. Also included in this list are patients pending after the deadline (with guaranteed rights who have exceeded the corresponding maximum response period) and those temporarily non-programmable (TNP) for clinical reasons or at the request of the patient.
· Patients on the surgical waiting list without guarantee: Patients not included in the guaranteed sections or who have lost the response time guarantee. This list also includes patients with a waiting period of more than 365 days and TNP.
Average waiting time for non-urgent surgeries is understood to be the average time, expressed in days, that patients pending an intervention have been waiting, from the date of entry in the Surgical Demand Registry until the final date of the study period (cut-off date, June 30, or December 31). These average delay data differ slightly from those published by the SNHS since they compute the waiting times corresponding to pending patients on structural waiting, that is, without including those TNP. The data published by the AHS does include the latter, who usually constitute a very low percentage of the total number of pending patients, 2.9% in June 2022.
In the same sense, there is a waiting list for outpatient consultations, referring to first consultations with specialists, guaranteeing a maximum response time of 60 days. The response guarantee system ensures citizens maximum waiting times, since if the response deadlines established in the regulations are not met, they have the right to go to a private center and the AHS will charge of the expenses incurred. In this area and according to the AHS, we highlight the following concepts:
· Waiting list for external consultations: Patients registered in the Register of External Consultations, pending to be seen by a medical specialist in hospital care.
· First consultations: Requests for outpatient hospital consultations made by a primary care doctor (first consultations from primary care) or by another hospital care doctor (interconsultations).
Average waiting time for a first specialized care consultation is understood to be the average, in days, of the time that patients pending a first consultation have been waiting, since the date of entry in the Register of External Consultations until the end date of the study period (cut-off date)[4].
We consider in this study the AHS data for each hospital on the average surgery waiting time (Surgery, from now on) and on the average outpatient consultation waiting time (Outpatient consultations, from now on), for data up to June 2022. The former includes both the average waiting times corresponding to patients pending scheduled surgical procedures, structural waiting, as well as the temporarily unscheduled. The latter includes both waiting times for consultations from primary care as well as hospital interconsultations[5].
Cullen and Frey graph
Cullen and Frey (1999) develop a graph where the asymmetry and kurtosis coefficients are combined for a group of probability functions. The probability functions are the most used for models with one or two parameters. For continuous random variable, such are our variables, it includes the normal, uniform, exponential and logistic models, in which a single point shows the situation of each model based on the combination of asymmetry or kurtosis coefficients. The Gamma and Log-normal models are represented by dashed lines, and the Weibull model will be close to both models. According to Delignette-Muller and Dutang (2015), to provide greater robustness, skewness and kurtosis are evaluated on bootstrap samples.
According to Cullen and Frey (1999) we also consider the following classical goodness-of-fit plots:
· A density plot representing the density function of the fitted distributions along with the histogram of the empirical distribution.
· A CDF (Cumulative Distribution Function) plot of both the empirical distribution and the fitted distributions.
· A Q-Q plot representing the empirical quantiles (y-axis) against the theoretical quantiles (x-axis).
· A P-P plot representing the empirical distribution function evaluated at each data point (y-axis) against the fitted distribution functions (x-axis).
Next subsection presents the GAMLSS methodology which is not reduced to the field of biparametric distributions traditionally used in the literature, but rather that these models will compete with models with three and four parameters.
The GAMLSS framework
Generalized additive models for location, scale, and shape (GAMLSS) were introduced by Rigby and Stasinopoulos (2001, 2005) as a way of overcoming some of the limitations associated with the popular generalized linear models, GLM, and generalized additive models, GAM, see Nelder and Wedderburn (1972) and Hastie and Tibshirani (1990), respectively.
GAMLSS models are semi-parametric regression models. First, they are parametric, in the sense that they require a parametric distribution assumption for the response variable. Second, they are semi-parametric, in the sense that the modeling of the parameters of the distribution may involve using non-parametric functions. GAMLSS can model many distributions, Normal, asymmetric, and with heteroscedasticity, between others. For this, the response variable, Importar_Imgen5265c64616, can be adjusted through a parametric distribution of up to four parameters𝑓(𝑦 ! |𝜇 ! , 𝜎 ! , ν !, τ !) , where µ, σ, ν and τ, represent the location, scale, skewness, and kurtosis shape parameters, respectively. For the estimation of the parameters, Rigby and Stasinopoulos (2005) introduced two basic algorithms: CG (Cole and Green) and RS (Rigby and Stasinopoulos) which maximize the logarithm of the likelihood function.The GAMLSS methodology is suitable for fitting the distribution of a single variable when no explanatory variables are included in the model. Likewise, GAMLSS is highly recommended in the case of fitting distributions with a certain degree of asymmetry. Surgery and Outpatien consultations variables are positively skewed and leptokurtic. Therefore, we fit a wide variety of models on the positive range of the variables and the optimal model will be selected based on goodness-of-fit criteria.The selection of the appropriate distribution is done in two stages, the fitting stage, and the diagnostic stage:
• The fitting stage involves the comparison of different fitted models using a generalised Akaike information criterion (GAIC). The GAIC is defined as GAIC ( 𝑘 ) = −2l + k × 𝑑f where l is the log-likelihood function, 𝑑f are the effective degrees of freedom, and k is a constant. We refer to −2l as the global deviance. e selected model is the one with the smallest GAIC ( 𝑘 ) value. e Akaike information criterion (AIC), Akaike (1974), and the Bayesian information criterion (BIC), Schwarz (1978), are special cases of the GAIC(k) corresponding to k = 2 and k = 𝑙𝑜 𝑔( 𝑛 ) , respectively. The two criteria, AIC and BIC, are asymptotic approximations to the average predictive error. In practice, it is found that the AIC is less restrictive than the BIC on model selection, see Voudouris et al. (2012). Similarly, when k = 3.84 the GAIC(k) corresponds to a Chi-squared test with one degree of freedom for a single parameter. In general, the greater the number of parameters in the model, the more easily it fits the data and the lower its log-likelihood, but in turn, the greater its risk of overfitting. This drawback is avoided using the GAIC(k) which incorporates a penalty k for each degree of freedom.
• The diagnostic stage involves the use of worm plots. Worm plots were introduced by Buuren and Fredriks (2001) and are detrended normal Q-Q plots of the quantile residuals (i.e., zscores). The worm plot allows the detection of inadequacies in the model, globally or within a specific range (intervals) of an explanatory variable. Buuren and Fredriks (2001) proposed fitting cubic models to each of the detrended Q-Q plots, with the resulting constant, linear, quadratic and cubic coefficients, 𝑏 C " , 𝑏 C # , 𝑏 C $ , 𝑏 C % , indicating differences between the empiricalInvestigaciones Regionales – Journal of Regional Research, 59 (2024/2), 167-191ISSN: 1695-7253 e-ISSN: 2340-2717 172 Caro, A., De Haro-García, J.and model residual mean, variance, skewness and kurtosis, respectively, within the range in the Q-Q plot. The absolute values of 𝑏 C " , 𝑏 C # , 𝑏 C $ , 𝑏 C % are categorized as misfits when they excess the threshold values, 0.10, 0.10, 0.05, 0.03, respectively.
Spanish National Health System
The Spanish public health system is characterized by being financed by taxes, universal and guarantees free health services at the time of use. The right to health protection and health care for all its citizens is included in the Spanish Constitution of 1978 in its article 43. Regarding health care, two levels must be distinguished: primary care which access is spontaneous, and the assistance takes place in health centers and local clinic, and specialized care which access is by indication of primary care doctors and the assistance takes place in specialty centers and hospitals.
There is a political decentralization of the health system in 17 “Autonomous Communities” (administrative partition of the territory, hereinafter regions), so that health care constitutes a non-contributory benefit financed by taxes and being included in each region general budget. The existence of 17 health services, each with its own features, is the essence of health decentralization, a government strategy that aims to bring the decision-making center closer to citizens for a better response to their needs. These regions are coordinated through the Interterritorial Council of the SNHS. The report of the Spanish Ministerio de Sanidad, Política Social e Igualdad (2008) defines the SNHS as "the coordinated group of health services of the State Administration and of the regions, that integrates all the functions and health benefits that, according to the law, are the responsibility of the public authorities”.
The Spanish Ministerio de Sanidad publishes information on waiting times for specialized care (but not for primary care) every 6 months, providing both national data and data for the 17 regions. Even though the Real Decree 605/2003 establishes measures for the homogeneous treatment of information on waiting lists in the SNHS, the regions provide heterogeneous information with different disaggregation detail on their web pages, making it difficult to compare data between different regions. For each region there are three waiting lists: surgery (for non-urgent surgeries), outpatient consultations (first consultations with specialists), and diagnostic tests, which serve as the basis for computing different waiting times and another series of indicators.
In Spain there are several regulations and action plans regarding waiting lists. Royal Decree 16/2003, on the cohesion and quality of the SNHS, regulates health services and their essential aspects, such as those referring to guarantees of accessibility, mobility, access time, information, security, and quality. This Law authorizes regions to define the maximum access times to their portfolio of service. After this rule, the regions grant patients the right to subcontract private health services when the waiting lists exceed maximum waiting times and when the service included is within the category of "guaranteed". In this sense, Royal Decree 1039/2011 establishes the criteria to guarantee a maximum time of access to the SNHS health benefits of 180 days for certain non-urgent surgeries, as well as authorizes the regions to shorten these times.
Currently, many regions have reduced these waiting times in certain surgeries, for example, with those related to oncological surgeries, as well as in first outpatient consultations. Furthermore, the problem of waiting lists/times translates into a significant economic and social cost. For example, when the maximum guaranteed deadlines are not met, the health system of each region will bear the expenses caused by the patient's right to receive care or surgery in a private center. In addition, health resources must be balanced from both the supply side and the health demand side to not fall into situations of inefficiency, for example, hiring personnel for periods of high demand results in an inefficient cost in periods of low demand.
Health systems by regions
Spain has always boasted of having a very good health system and great professionals in its ranks. In fact, according to the SNHS, 7 out of 10 people consider that the Spanish health system works well. Analyzing data from the OECD Health Statistics[6] we can see in Figure 1 the mean waiting times of patients on the lists in 2021, the most recent data. The bar plot includes all the country information available for Chile, Costa Rica, Hungary, Ireland, New Zealand, Portugal, Spain and Sweden about the following selected elective surgeries: cataract, percutaneous transluminal coronary angioplasty (PTCA), coronary bypass, prostatectomy, hysterectomy, hip replacement and knee replacement. We can see that Spain presents the smallest waiting times compared with the rest of countries being analized. Countries with the largest waiting times are Costa Rica and Chile, the latter having the largest waiting times for knee replacement. Knee replacement and hip replacement are the surgeries with largest waiting times across countries, whereas cataract and PTCA the ones with shortest waiting times. The smallest wainting times in Spain correspond to coronary bypass and cataract, and the largest to knee replacement and prostatectomy.
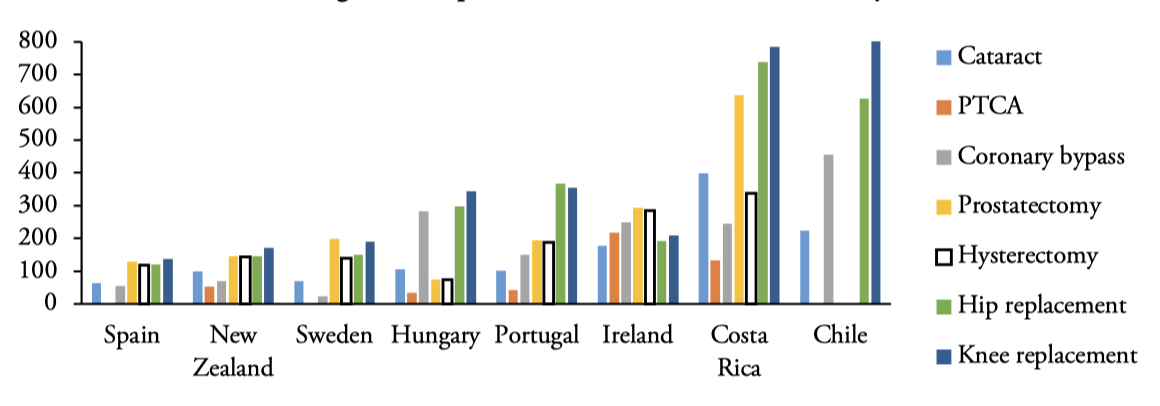
Figure 1.
Waiting times of patients on the lists 2021: Mean (days)
Source: Authors’ elaboration. PTCA means percutaneous transluminal coronary angioplasty.
Figure 2 shows how the average surgical waiting times (mean delay in days of patients pending non-urgent surgery intervention) in Andalusia (Surgery), from June 2019 to December 2021, are much higher than the national average (Surgery_ESP). Regarding outpatient consultations, the average waiting times (average delay in days of patients pending a first visit to the specialist) in Andalusia (Outpatient) are also higher than the national data (Outpatient_ESP) in the analyzed period, but with delays substantially lower than Surgery. If we compare the behavior of both variables in the pre- and post-pandemic situation in Andalusia, we observed that surgery waiting times from June 2020 begin a downward trend, reaching levels lower than 2019, an aspect that is not ratified at the national level, with data higher than the pre-pandemic in both variables.
However, it should be noted that in the COVID-19 period[7], year 2020, the patient guarantee system was revoked (maximum response times by the health system), both in outpatient consultations and in surgeries at the AHS and at the national level. Although both delay times return to lower data than the pre-pandemic at the end of June 2021, in outpatient consultations there is a certain tendency to progressively increase waiting times, specifically, in June 2022 the average waiting time is 107, two days on average higher than the data for December 2021.

Figure 2.
Average waiting time evolution for Andalusia and Spain
Source: Authors’ elaboration. Notes: Outpatient and Surgery refers to Andalusia data, Outpatient_ESP and Surgery_ESP refers to Spanish data.
Figure 3 presents a comparison at the regional level which provides us with the following information. According to the SNHS as of December 31, 2021, the latest data available at the national level[8], the average waiting time in Spain for patients pending non-urgent surgery is 123 days, the regions with the worst situation are Aragon (183) and Catalonia (156). Andalusia appears in an intermediate zone with 128 days of waiting on average. On the other hand, the best-placed regions, below the average data for Spain, are the Basque Country (71) and the Community of Madrid (73)[9]. Patients awaiting surgery in Andalusia are 122,959 (second worst value after Catalonia) of the 706,740 existing in Spain on that date. In the rate per 1,000 inhabitants, this represents 15 waiting patients per 1,000 inhabitants, a data slightly lower than the national average (15.39). In this sense, Cantabria is the one with the highest rate, 23.73, closely followed by Extremadura (23.70).
Regarding the average outpatient consultations waiting time for Spain the data is 89 days[10]. The best-placed regions are the Basque Country (34), the Balearic Islands (51), and Galicia and the Community of Madrid, both with (56)[11]. The worst placed with data above the national average are Aragon (160), Canarias (118), Navarra (109) and Andalusia (105). The national data for patients on the waiting list for outpatient consultations per 1,000 inhabitants is 77.23, with Andalusia having the worst data in all of Spain, 106.49 patients on the waiting list per 1,000 inhabitants, followed by Navarra with a rate of 92.11. The national data for pending patients on the waiting list for outpatient consultations is 2,809,150, of which 873,047 are Andalusians, the highest data by region, a data that increases in June 2022 to 906,618.
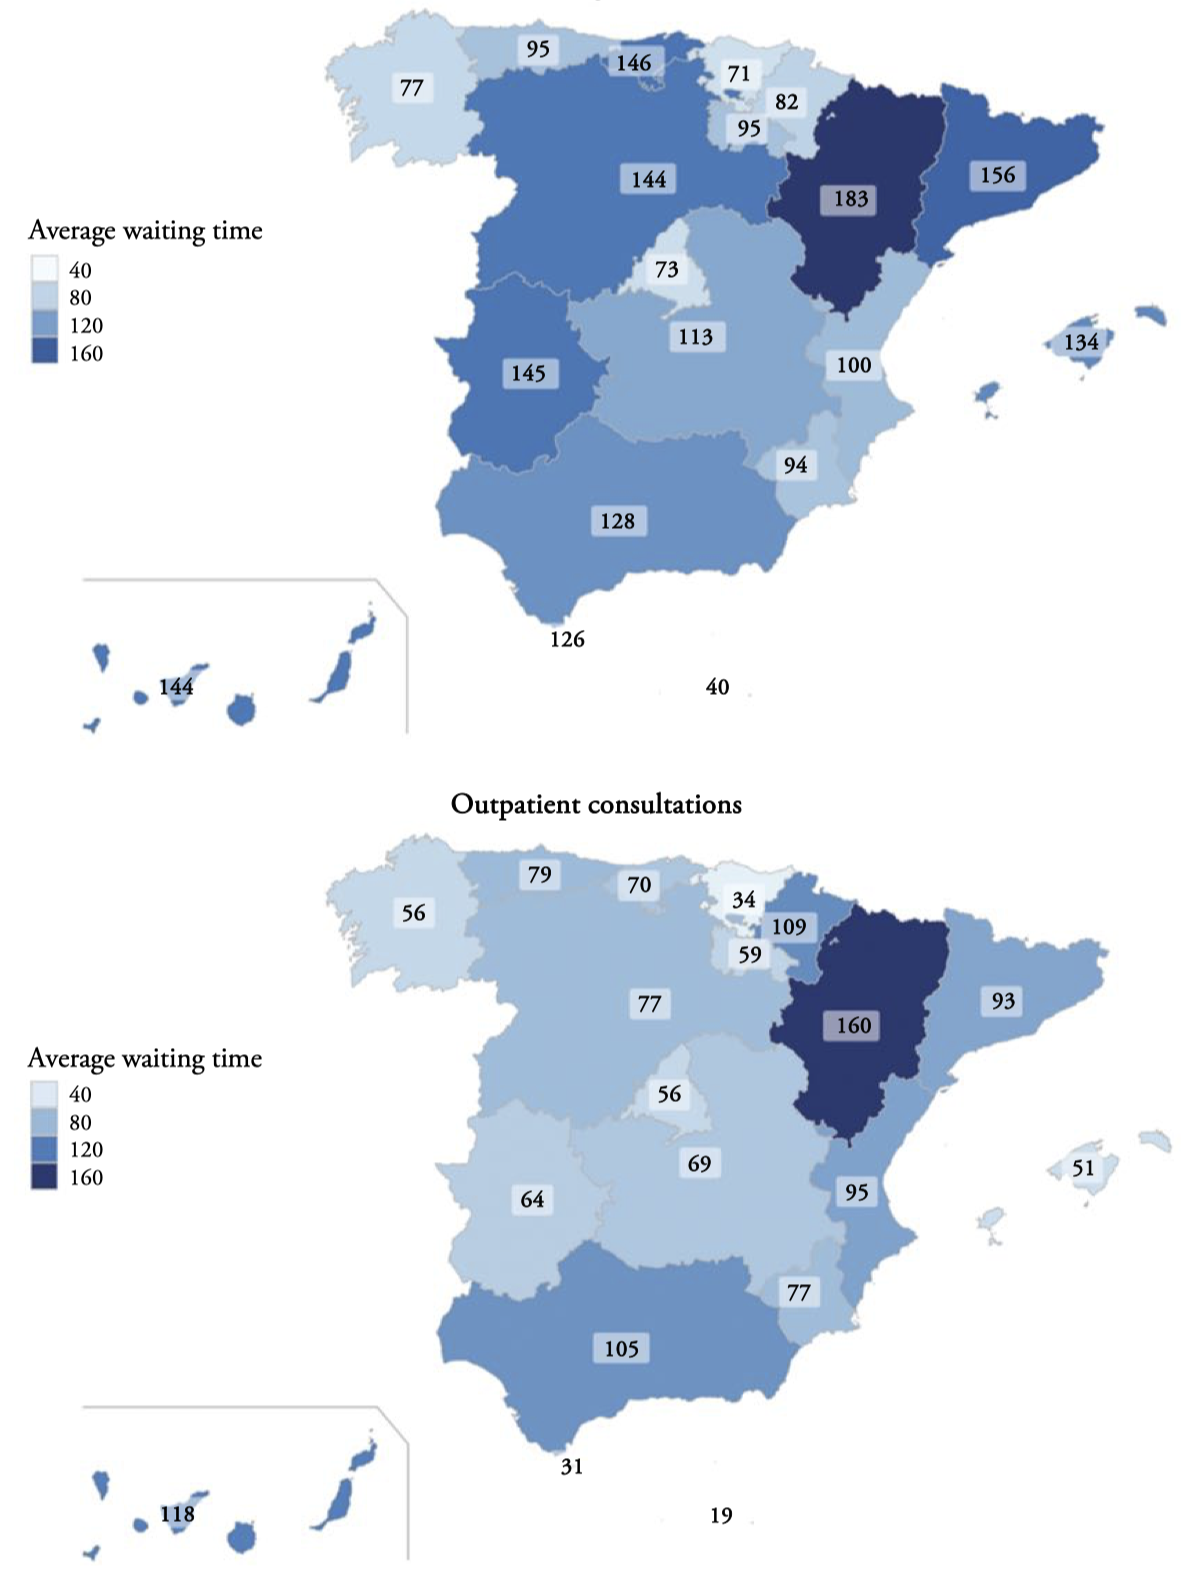
Figure 3.
Regional average waiting times (days) in Spain, December 31, 2021. Surgery
Source: Authors’ elaboration.
The relative situation of Andalusia with respect to the rest of the regions is not one of the worst, both waiting times in June 2022 being maintained at levels below the pre-pandemic. However, in terms of density for outpatient consultations, it reaches the worst data as of December 31, 2021. The situation of waiting lists is worrying in this community, with values much higher than the national ones.
Finally, it should be noted that Andalusia, for the latest available data, June 2022, has 150,034 pending patients awaiting surgery compared to 906,618 awaiting first outpatient consultations. In contrast, the overall data for the mean surgical delay (118 days) is slightly higher than the mean delay for outpatient consultations (107 days). Analysisng data by regions, we must point out that having the largest number of pending patients on a waiting list does not necessarily entail longer waiting times.
We just consider data from 2019-2022 in Section 3 in order to represent the average waiting time evolution for Andalusia and Spain. The analysis by hospital carried out from Section 4 onwards is made using the last available crosssectional data in June 2022.
Andalusian hospitals
Given the role that hospitals play in the phenomenon of waiting lists and, specifically, in waiting times, we will focus on modelling this last variable at the hospital level for the entire set of Andalusian public hospitals, and four concerted hospitals[12] which waiting times are considered by the AHS. Andalusian public hospitals are divided into four categories: regional hospitals, available to the entire region and having all kinds of medical specialties. Specialities hospitals, which are provincial and cover many specialties. The so called comarcal hospitals, available for the population that lives less than 1 hour away and having basic specialties. The high-resolution hospitals, which serve the population that lives less than 30 minutes away and have basic specialties. Throughout the text, we refer to all hospitals under study as public hospitals.
The hospital catalog prepared by the Spanish Ministerio de Sanidad (2022), as of December 31, 2021, shows that there are 832 hospitals in Spain, most of them located in Catalonia (204), Andalusia (131) and the Community of Madrid (90). In Andalusia, 73 hospitals are public and 58 are private. The SNHS accounts for each of the registered hospitals although some of them, at an organizational level, may form part of a complex. Thus, for example, the Regional University Hospital of Málaga is a complex that includes three hospitals: Civil Hospital, Materno-Infantil Hospital and General Hospital of Málaga. This fact happens in the 8 Andalusian provinces. This greater breakdown contrasts with the data published by the AHS which provides only the aggregate data of the complex, so the sample of hospitals of the AHS analyzed here is decreased to 52. As the publications are available every six months (data as of June 30 and December 31), for each of the variables analyzed, the average surgery waiting times and the average outpatient consultations waiting times, we consider the most recent data, June 2022.
Although the regions must have an information system on the waiting lists for outpatient consultations, diagnostic/therapeutic tests, and surgical interventions, the AHS only publishes data for surgical and outpatient lists.
Descriptive statistics of average waiting times can be seen in Table 1, for data up to June 2022. The range of Outpatient consultations, in days, is greater than the Surgery one, with means greater than the medians for each of the variables. This feature can be seen in the boxplots in Figure 4, meaning that the two data series are comprised of abundant of short waiting times and relatively fewer long-waiting times. All this denotes the marked positive asymmetry of both distributions. It should be noted that the sample of hospitals for Outpatient consultations have increased by one unit by including the Benalmadena High-resolution Hospital, Málaga (𝑛 = 52 ℎ𝑜𝑠 𝑝 𝑖𝑡𝑎𝑙𝑠) . For both variables we found atypical data, in the case of Surgery: Regional de Málaga U.H. with 193 days; Torrecárdenas U.H., a specialty hospital in Almería, with 191 days; Virgen de las Nieves U.H., regional hospital in Granada with 187 days, and Jaén U.H., specialty hospital with 176 days of waiting13
| Dataset | Min | Max | 1stQu | Median | Mean | 3rdQu | n |
| Surgery | 59 | 77 | 87.33 | 101 | 51 | ||
| Outpatient | 47.75 | 75 | 87.63 | 116 | 52 |
On the other hand, the atypical ones in Outpatient consultations correspond to: Linea de la Concepción Hospital, comarcal hospital in Cádiz (229 days), Alto Guadalquivir Hospital, comarcal hospital in Jaén (228 days) and High-Resolution Hospital of Guadix in Granada (221 days)[14].
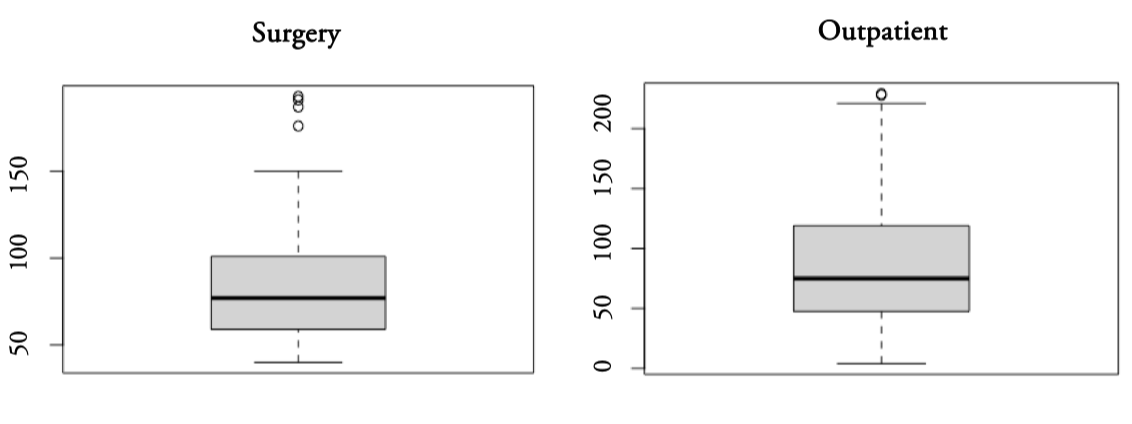
Figure 4.
Boxplots of Surgery and Outpatient consultations average waiting times (in days) for Andalusian hospitals
Source: Authors’ elaboration.
Table 2 presents the hospitals with a waiting list of more than 6,000 patients awaiting a non-urgent surgical intervention, Surgery, and the hospitals with a waiting list of more than 30,000 pending patients for Outpatient consultations, Outpatient. Hospitals with white spaces do not exceed those limits. Analysing Surgery data, it is important to note that the hospitals with the longest waiting lists do not correspond to those with the longest average delays and, contrary to what one might think, regional hospitals are not always the ones with the longest waiting times. The longest Outpatient consultations waiting lists are in Málaga, specifically in the U.H. Regional de Málaga and the U.H. Virgen de la Victoria, which do not correspond to the hospitals with the longest average delay in Andalusia (the atypical ones). All this leads us to conclude that the longest average delays are not accompanied by the longest waiting lists, and that the highest values of waiting times predominate in specialties hospitals.
| Surgery | Outpatient | |||||
| Hospitals | Type | Province | AWT (days) | TWL(patients) | AWT (days) | TWL(patients) |
| Torrecárdenas U.H. | Specialties | Almería | 191 | 6,807 | 82 | 30,872 |
| Reina Sofía U.H. | Regional | Córdoba | 112 | 10,760 | ||
| Virgen de las Nieves U.H. | Regional | Granada | 187 | 10,591 | ||
| Juan Ramón Jiménez U.H. | Specialties | Huelva | 128 | 6,613 | 140 | 37,867 |
| Jaén U.H. | Specialties | Jaén | 176 | 7,978 | 183 | 48,959 |
| Regional de Málaga U.H. | Regional | Málaga | 193 | 9,206 | 89 | 67,916 |
| Virgen de la Victoria U.H. | Specialties | Málaga | 68 | 6,448 | 130 | 78,037 |
| Virgen del Rocio U.H. | Regional | Sevilla | 111 | 13,323 | 57 | 49,799 |
| Virgen de Valme U.H. | Specialties | Sevilla | 88 | 6,379 | 107 | 31,103 |
| Virgen Macarena U.H. | Regional | Sevilla | 98 | 9,576 | 78 | 45,368 |
| Jérez de la Frontera U.H. | Specialties | Cádiz | 105 | 31,105 | ||
| San Cecilio U.H. | Specialties | Granada | 126 | 36,950 | ||
| Costa del Sol Hospital | Specialties | Málaga | 96 | 37,810 | ||
Waiting times probability distribution analysis
We first analyze in Figure 5 the Cullen and Frey graphs for Surgery and Outpatient consultations distributions, being the yellow points the bootstrap samples. The distributions are positively skewed (values greater than 0), Surgery presents a positive skewness (1.35) slightly higher than Outpatient consultations (1.17). Both distributions are leptokurtic with kurtosis coefficients greater than 3, Surgery (4.51) and Outpatient consultations (4.21), that is, more pointed than normal. Therefore, the Cullen and Frey graphs recommend fitting typical distributions for markedly positive asymmetric data, such as Gamma, Log-normal and Weibull.
Surgery waiting times
We analyzed the average surgery waiting time optimal distribution of Andalusian public hospitals as of June 30, 2022, through the GAMLSS methodology. For Surgery, variable with positive range, from zero to infinity, and continuous, the data have been fitted to the 23 distributions provided by the R package GAMLSS, see Stasinopoulos and Rigby (2008). The fitted distributions can contain from one to four parameters and the appropriate model for the data is selected through the three information criteria inherent to the GAIC(k): AIC, Chi-squared and BIC, see Table A1 in Appendix A.
These criteria are increasingly recurrent in the literature when selecting models[15], since they allow considering a large set of distributions with different numbers of parameters to fit the same data, always keeping in mind that it is possible that the true model is not found in the set of those considered. However, by selecting the largest possible number of candidate models, and based on the nature of the study variable, this drawback can be overcome, on the basis that a model cannot perfectly describe real data.
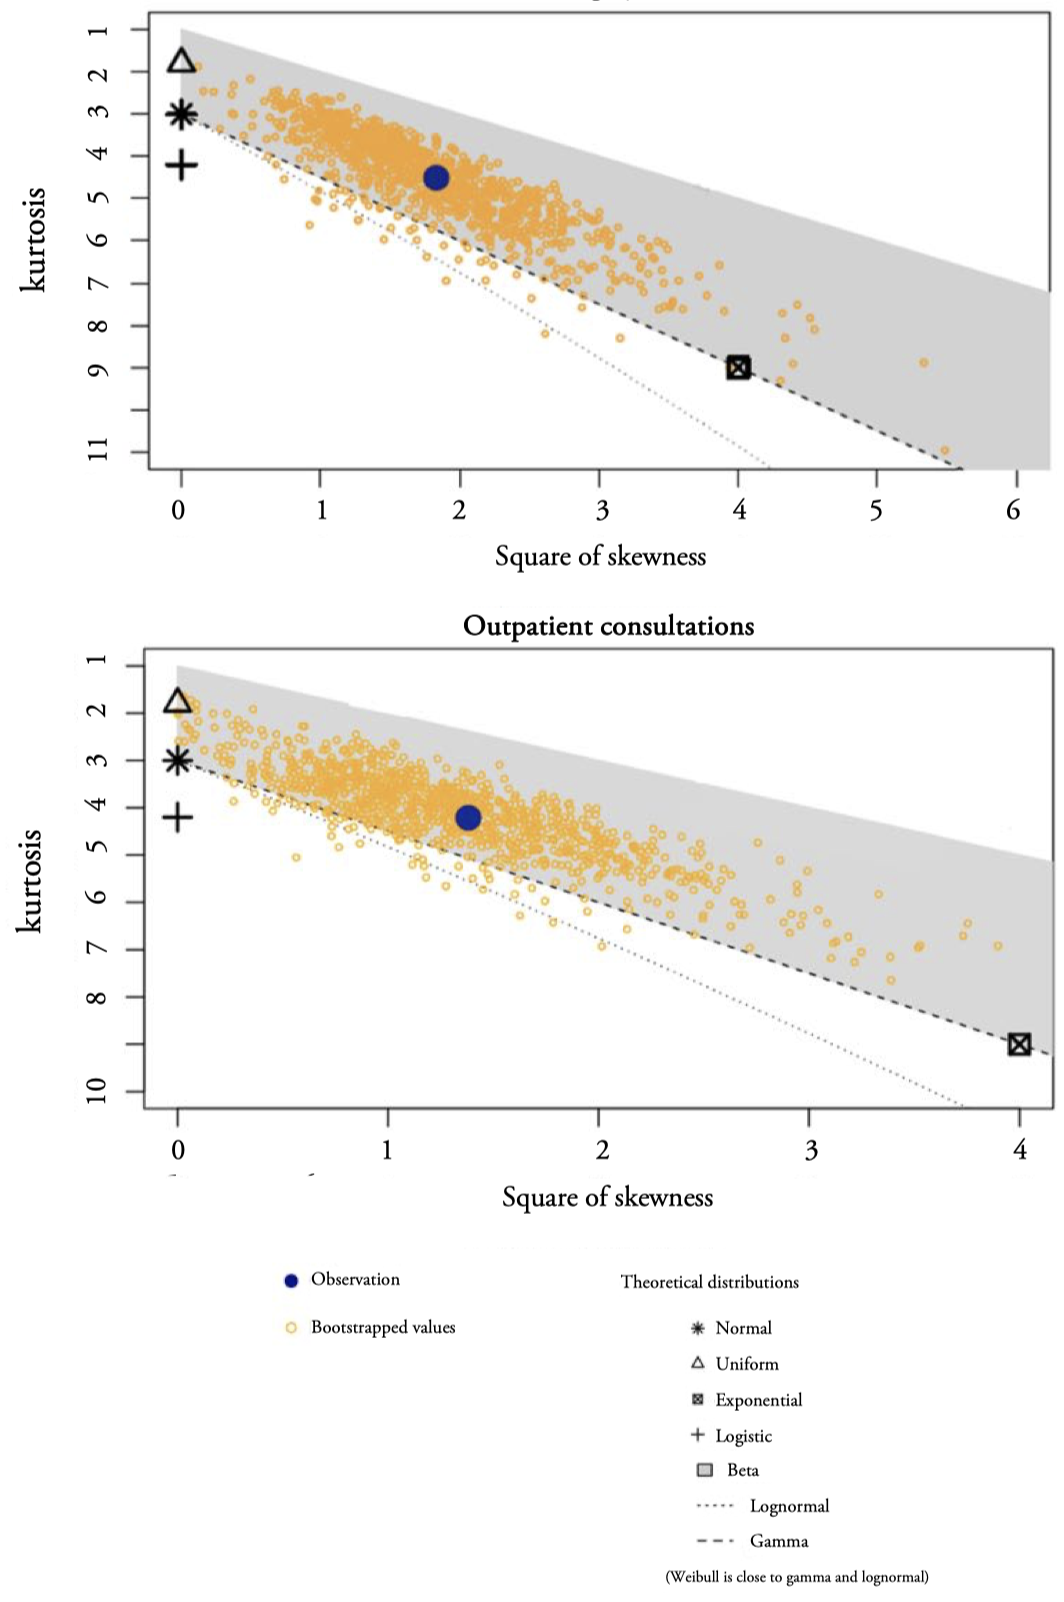
Figure 5.
Cullen and Frey graphs for Surgery and Outpatient consultations distributions
Source: Authors’ elaboration.
The inverse gamma (IGAMMA) is selected as the most appropriate distribution achieving the lowest value in each of the three criteria. We must point out that the models pre-selected by Cullen and Frey graph (LOGNO, GA and WEI) are not in the top positions.Figure 6 shows four goodness-of-fit plots of the first five distributions according to AIC: IGAMMA (Inverse Gamma, two parameters), IG (Inverse Gaussian, two parameters), GG (Generalized Gamma, three parameters), BCCG (Box-Cox Cole and Green, three parameters) and LOGNO (Log-normal, two parameters).In general, the models have an important relative quality to fit Surgery data, but in the CDF graph it is observed that the IGAMMA (with location paremeter, the mode, 𝜇 = 65.42 days, and scale parameter, 𝜎 = 0.38 days) fits better the central part, as well as the tails of the distribution. We must point out that in the distribution of Surgery atypical data have not been excluded.
The reason is that we are interested in testing models in atypical datasets with marked asymmetries and with parameters that include the express modeling of asymmetry and kurtosis such as BCCG and BCPE (Box-Cox Power Exponential), with three and four parameters, respectively.
The second stage of the GAMLSS methodology offers a second filter based on the study of residuals to verify if the selected model turns out to be optimal. In Table 3 we note that the (normalized quantile) residuals of IGAMMA and IG probability models behave well, e.g., their means are nearly zero, variances nearly one, coefficients of skewness near zero and coefficients of kurtosis near 3. Hence the residuals are approximately normally distributed as they should be for an adequate model.
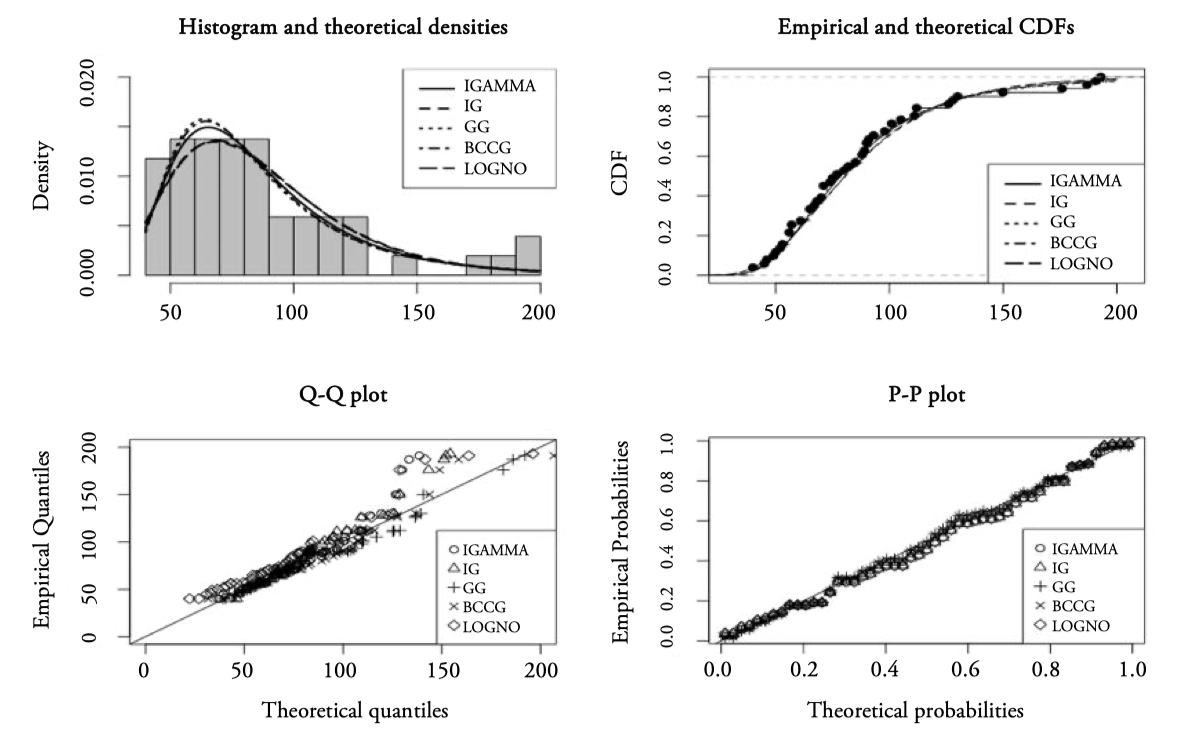
Figure 6.
Goodness-of-fit plots for Surgery data
| Inverse Gamma | Inverse Gaussian | |
| Mean | -0.0005 | -0.0079 |
| Variance | 1.0201 | 1.0162 |
| Coef. of skewness | 0.1462 | 0.4210 |
| Coef. of kurtosis | 2.4032 | 2.6174 |
Figure 7 presents the worm plots for Surgery of the IGAMMA and IG distribution models. Since all the observations fall in the acceptance region inside the two elliptic curves the models appear to fit well. Moreover, the lack of quadratic and cubic shape of the residuals indicates that the empirical skewness and kurtosis are appropiately captured by the two models.
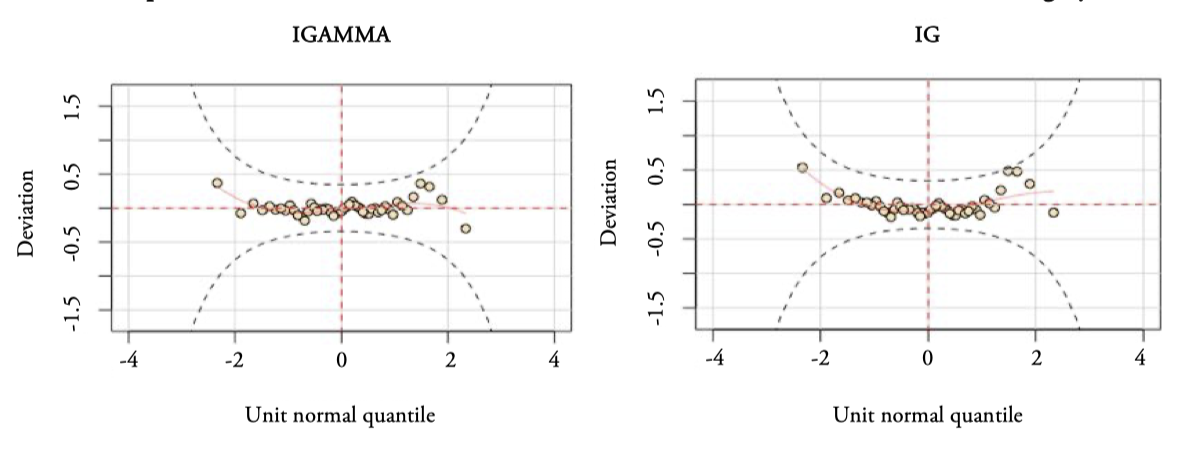
Figure 7.
Worm plots of the Inverse Gamma and Inverse Gaussian distribution models for Surgery
Source: Authors’ elaboration.
We highlight the slightly better behavior of the IGAMMA distribution, the residuals are more settled (less curved) on the red dashed line, ideally, the resulting values should be zero. For all these reasons, the inverse gamma distribution is the optimal of the 23 analyzed, to fit the data on average Surgery waiting times for the Andalusian Health System hospitals, according to the GAMLSS methodology, GAIC criteria.
Outpatient consultations waiting times
As in the previous case, we find the distribution that best fits the average outpatient consultations waiting times of the Andalusian public hospitals (Outpatient consultations). For Outpatient consultations, variable with positive and continuous range, the data, including outliers, have been adjusted to the 23 distributions. In this case the Gamma distribution (GA) occupies the first position according the three criteria, AIC, Chi-squared and BIC, see Table A2 in Appendix A. The three information criteria give different orderings of the models that best fit the data. Following the AIC criterion, Figure 8 presents the four goodness-of-fit plots of the first three distributions according to AIC: the GA (Gamma, two parameters), BCCG (Box-Cox Cole and Green, three parameters) and WEI (Weibull, two parameters) distributions.
e best fitting distribution turns out to be a biparametric model, such as the Gamma model (with location paremeter, the mean, 𝜇 = 87.63 days, and scale parameter, 𝜎 = 0.58 days).
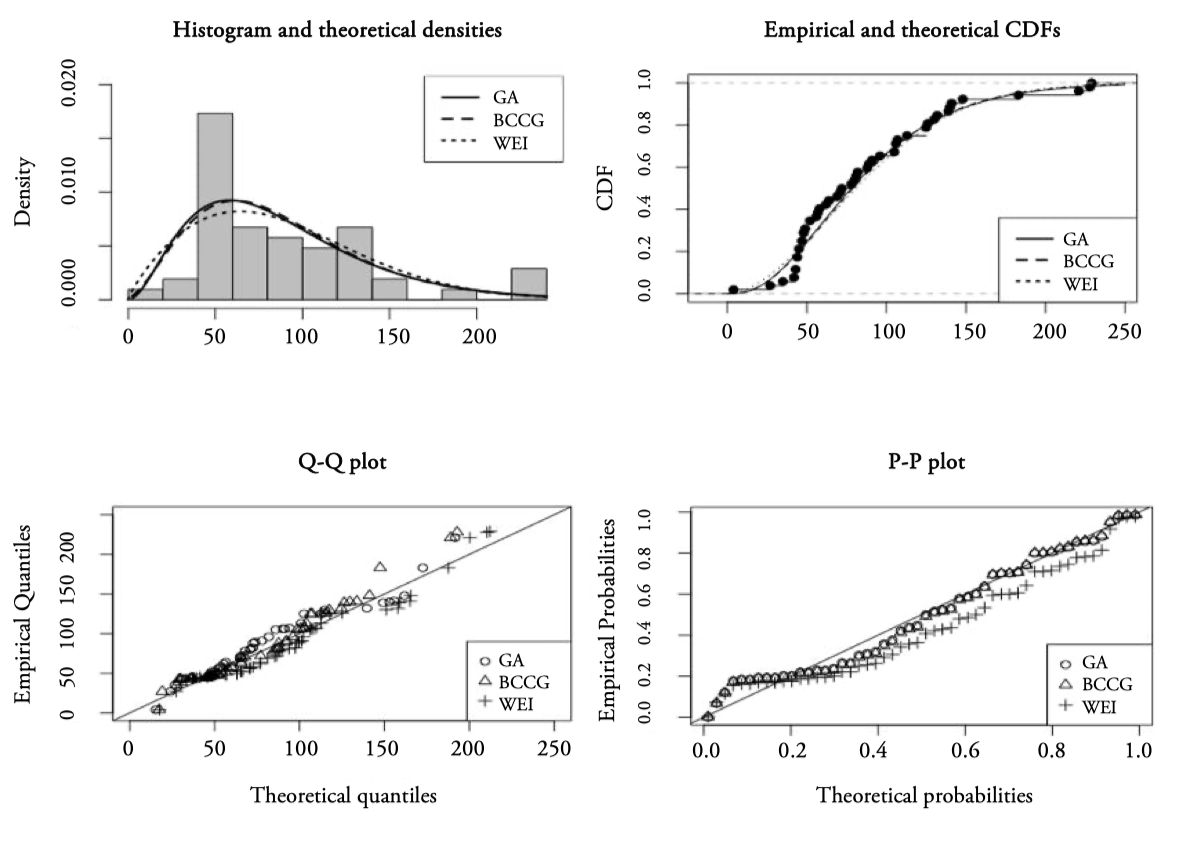
Figure 8.
Basic goodness-of-fit plots for Outpatient consultation data
Source: Authors’ elaboration. Notes: GA (Gamma), BCCG (Box-Cox Normal) and WEI (Weibull).
The analysis of the residuals confirms previous results, see Table 4, where the summary of the quantile residuals points to a Normal standardized distribution, and Figure 9 displaying the correspoinding worm plot.
| Gamma | |
| Mean | 0.0023 |
| Variance | 1.0211 |
| Coef. of skewness | -0.1633 |
| Coef. of kurtosis | 3.9803 |
If the model is correct, we would expect approximately 95% of the points to be between the two elliptic curves and 5% outside. In our case, the percentage of outside observation is below 5%, since there is only one case (1.93%). The small negative slope at the beginning of Figure 9 indicates some difficulty for modeling the kurtosis, see Stasinopoulos et al. (2017).
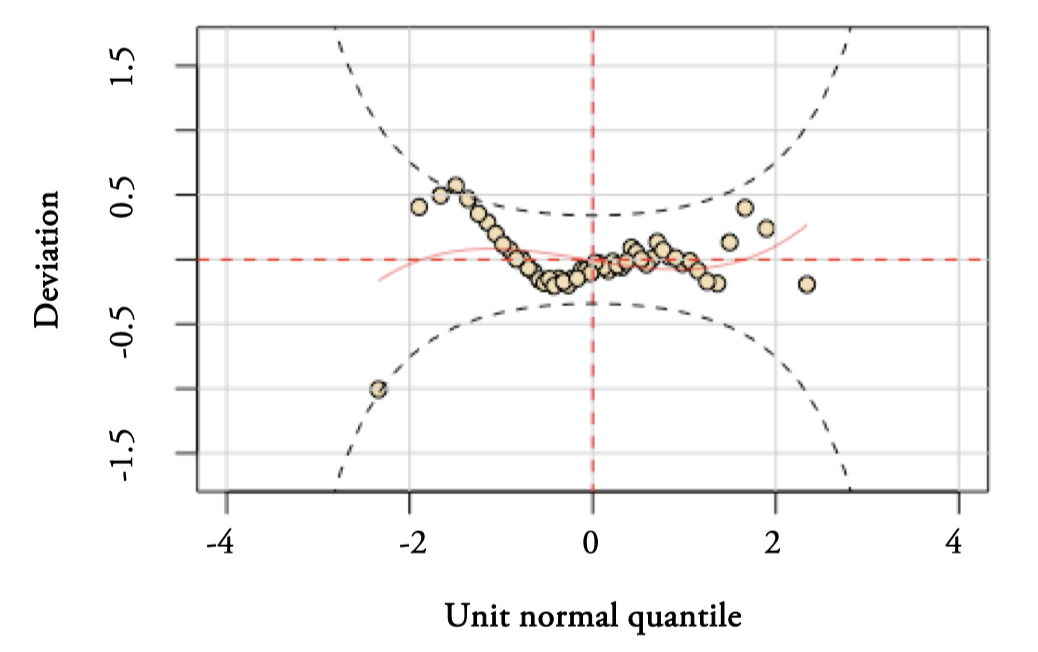
Figure 9.
Worm plots of the Gamma distribution model for Outpatient consultations
Source: Authors’ elaboration.
The behavior of Surgery and Outpatient consultations waiting times are similar to other waiting times variables. For example, lengths of stay for a patient in the hospital were fitted by Marazzi et al. (1998) to three probability distributions, Weibull, Gamma and Log-normal, identifying the Log-normal distribution as the one that best fitted most of the samples.
Empirical application
The adjustment of an optimal probability model to the observed data constitutes an instrument to estimate theoretical probabilities that will allow us to analyze the data in different scenarios. Table 5 shows the estimated probabilities that an Andalusian public hospital exceeds a given average waiting time, both for Surgery (90, 120, 180 and 365 days), and for Outpatient consultations (60 days).
In the AHS there is an extensive list of surgical interventions with a maximum guaranteed response time of 90, 120 and 180 days, as well as for the first external consultations of 60 days. Failure to comply with these response guarantee periods may constitute an additional cost for the AHS since the affected patient may be treated in the private health system and the corresponding expenditure would be covered by the AHS.
We can see in Table 5 that the probability of an Andalusian public hospital exceeding an average waiting time of 365 days is almost null (0.0007). Therefore, as the waiting time threshold decreases, the probability increases, for example, the probability that a hospital exceeds 90 days on average is 36.44%. The probabilities corresponding to Surgery together with their corresponding 95% confidence intervals (between brackets) have been estimated using the IGAMMA model. The second column presents the estimated number of Andalusian hospitals that are expected to exceed the guaranteed response times. It is ∗ estimated that approximately 19 ( 51 0.3644 ) hospitals exceed the average waiting time of 90 days, the corresponding observed data is 17 hospitals, see Table B1 in Appendix B. There are no Andalusian public hospitals that exceed the average waiting time of 365 days for surgical waiting, neither with the estimated theoretical model nor in the observed data. Exceeding 180 days of waiting times, a total of 1.49 hospitals are estimated for Andalusia, and the observed data is 3 16 as of June 2022.
| Probabilities | Hospitals | Waiting list(patients) | |
| Surgery (IGAMMA) | 18.58 7.75 1.49 0.03 | 54,672.39 22,805.17 4,381 105 | |
| Outpatient consultations (GA) | 34.36 | 599,183.84 |
Analyzing the observed data of the 8 Andalusian provinces, we find that Córdoba and Sevilla do not have hospitals exceeding the average waiting time of 120 days. We highlight the case of Córdoba with 6 hospitals and just one, Reina Sofía U.H. (112 days), exceeding the average waiting time of 90 days, see Appendix B, Table B1.
e total number of patients on the waiting list for Surgery is 150,034 patients, multiplying this number by the probabilities in the first column of Table 5 we obtain the estimated number of patients exceeding a certain threshold at Andalusian public hospitals in the third column. We observed that the estimated numbers of pending patients represent a considerable amount. Even in the case of having almost zero probabilities of waiting times, 𝑃 ( 𝑤 > 365 ) , the estimated total number is 105 patients for the complex of Andalusian hospitals.
In the same way, and based on the gamma model, we have proceeded for Outpatient consultations, where both the probability of exceeding the average waiting time of 60 days (0.6609) and the estimated number of patients pending on the waiting list for the group of hospitals Andalusians (599,183.84) are much higher than those estimated for Surgery. This is also accompanied by a greater number of hospitals that are estimated to exceed that time, 34 hospitals, being the observed data 31 hospitals as of June 2022, see Table B2 in Appendix B. With respect to the observed data, all Andalusian provinces have most of their hospitals exceeding said threshold. We highlight again the case of Córdoba, since only one of its hospitals, Valle del Guadiato high-resolution Hospital, exceeds the 60 days on average.
As has already been commented throughout this study, Surgery waiting times are longer than those for Outpatient consultations, although the probabilities of exceeding the considered waiting times are lower for Surgery.
It should be noted that, for Surgery, the probability of exceeding, for example, 90 days on average, will include patients pending surgical procedures with different response guarantee periods of 90, 120 and 180 days, as well as patients without guarantee of response, since the average surgical waiting times used in this study includes both categories[17]. The estimated number of pending patients that exceed 90 days on average is 54,672.39. This estimation could be considered by the AHS since many of these patients may be waiting to receive surgery that has a maximum response guarantee period, with the subsequent cost that this would entail for public health.
Another application of the methodology developed in this section can be obtained at the microdata level, where the observations under study are made up of patients on the waiting list at each hospital. Let us remember that, in our case, the observations are the hospitals, having available the average waiting times for each hospital, hence the estimates provided in this section are for the data of all Andalusian public hospitals.
The possibility of having microdata by hospital would allow estimating probabilities by different levels of disaggregation: estimating the distribution of waiting times for patients on the waiting list, with surgical procedures or first outpatient consultations, with a guarantee of response within the deadlines already commented; by age groups, and other socio-economic characteristics that the patients on the waiting list can provide.
According to Economic Theory, in markets where prices regulate supply and demand, long waiting lists could be avoided by paying a higher price in private healthcare. Nevertheless, in the case of Spain where there are no real prices that regulate the demand in public health, it is more difficult to find a balance between supply and demand. Assuming that waiting times/lists will always exist, we emphasize the role that knowledge of the optimal distribution of the waiting time variable can play in the appropriate management of material and human resources.
Discussion and conclusion
In a first analysis of the waiting times/lists, we find: first, there is a lack of positive correlation between waiting times and waiting lists. The average waiting times for Surgery are higher than those for Outpatient consultations, both at the regional level and in the hospital analysis for Andalusia. However, the number of pending patients on the waiting list is much higher in Outpatient consultations. Second, Surgery and Outpatient consultations studies for Andalusia show that there are hospitals with atypical waiting times, with no correlation between the type of hospital, waiting lists, or between waiting times. Third, the flexible GAMLSS methodology allows expanding the set of models for adjusting the data to a total of 23 distributions, with positive range and continuous, with different number of parameters, selecting through the GAIC(k) information criterion, the inverse gamma model as the optimal one for the average waiting times of Surgery and the gamma probability distribution for the average waiting times of Outpatien consultations.
As a result of these modeling, we find the following conclusions: the property of parsimony has prevailed in our study given that models with a lower number of parameters have been selected, despite using the AIC among the information criteria, which is usually more favorable to probability distributions with a greater number of parameters. We conclude that the models finally selected, inverse gamma and gamma, both biparametric, outperform models with parameters that include the express modeling of asymmetry and kurtosis, such as those of BCCG (Box-Cox Cole and Green) and BCPE (Box-Cox Power Exponential), with three and four parameters, respectively.
Both distributions, Surgery and Outpatien consultations average waiting times, adopt a markedly positive and leptokurtic asymmetric form, meaning that the two data series are comprised of abundant of short waiting times and relatively fewer long-waiting times. This result would rule out the normality assumption of linear models. These results are in line with those found in Abásolo et al. (2014a, 2014b) analyzing Spanish data, and in Siciliani et al. (2014) studying OECD countries.
For the Andalusian hospitals, it has been analyzed that surgical waiting times are longer than those for the first outpatient consultations, although the low estimated probabilities that exceed the different average waiting time thresholds for surgical interventions may be indicative of an efficient management of the Andalusian community to data from June 2022 and in the short term. This result would ratify the downward trend in average surgical waiting times in Andalusia from June 2020 to June 2022, the date on which a value lower than before the pandemic was reached. This is not the case for Outpatient consultations, with worse predictions both in estimated probabilities and in patients on the waiting list, constituting this health service a clear bottleneck problem for the AHS.
This methodology can also be applied to microdata, having the waiting times for each patient in a hospital. For example, using the optimal model, one can estimate the number of pending patients per hospital who will exceed a certain waiting time, specifically, the maximum times with guarantee of response.
We consider that the continuous technological advances in the computer field together with a good operating system for monitoring databases at the hospital level will facilitate, almost regularly, the optimal modeling of the waiting times distribution. This will avoid undesirable effects of waiting times, such as worsening illnesses, and the additional costs for exceeding waiting times with guarantees of response.
We find two limitations in this work. First, the AHS publishes the number of patients pending intervention or first outpatient consultation for each Andalusian public hospital, but regarding waiting times it provides the average data for each hospital, which could affect our estimates. Second, the difficulty of finding information on predictor variables explaining waiting times at the hospital level further reinforces the fact of finding a good model that adjusts waiting times. It is known that there are both internal and external indicators of the public health systems that affect waiting times/lists such as: the aging of the population that increases the prevalence and incidence; new technologies and developments that increase the demand by expanding the range of diseases that in previous years could not be treated; managerial or administrative deficiencies; availability of material and human resources; medical practice (priority setting) and missing data, see Abbing (2001). Other important indicators are sociodemographic characteristics, public spending on health, and the waiting list itself (bottlenecks). However, accessing all this information is difficult, even more at the hospital level, either due to a lack of data or because they are not published by the different public health systems.
Future lines of research would be to apply the GAMSLSS methodology to other regions or countries, if information is homogeneous, and to include explanatory variables in the model. One of the tough challenges for all researchers in this field is to study the effect of explanatory variables on waiting times. The flexibility of this methodology makes it a useful tool for selecting an optimal econometric model, bearing in mind that one of the most important modelling decisions for a GAMLSS model is the choice of the distribution for the response variable, see Stasinopoulos (2019).
To conclude, this work brings to light the social, economic, and political debate that both the lists and the waiting times cause in all societies and provides a suitable tool for estimating the provision of funds and material and personnel resources, lines of action that hospital managers must consider for future periods.
References
Abásolo, I., Negrin-Hernández, M. A., & Pinilla, J. (2014a). Equity in specialist waiting times by socioeconomic groups: evidence from Spain. The European Journal of Health Economics, 15(3), 323-334.
Abásolo, I., Barber, P., López-Valcarcel, B. G., & Jiménez, O. (2014b). Real waiting times for surgery. Proposal for an improved system for their management. Gaceta Sanitaria, 28(3), 215-221.
Abbing, H. R. (2001). Criteria for the Management of Waiting Lists and Waiting Times in Health Care, a Council of Europe Report and Recommendation. Eur. J. Health L., 8, 57.
Akaike, H. (1974). A new look at the statistical model identification. IEEE transactions on automatic control, 19(6), 716-723.
Akaike, H. (1983). Information measures and model selection. Int Stat Inst, 44, 277-291.
Bosque‐Mercader, L., Carrilero, N., García‐Altés, A., López‐Casasnovas, G., & Siciliani, L. (2023). Socioeconomic inequalities in waiting times for planned and cancer surgery: Evidence from Spain. Health Economics.
Buuren, S. V., & Fredriks, M. (2001). Worm plot: a simple diagnostic device for modelling growth reference curves. Statistics in medicine, 20(8), 1259-1277.
Cima, J., & Almeida, Á. (2022). The impact of cancellations in waiting times analysis: evidence from scheduled surgeries in the Portuguese NHS. The European Journal of Health Economics, 23(1), 95-104.
Cullen, A. C., & Frey, H. C. (1999). Probabilistic techniques in exposure assessment: a handbook for dealing with variability and uncertainty in models and inputs. Springer Science & Business Media.
Dawson, D., Jacobs, R., Martin, S., & Smith, P. (2004). Is patient choice an effective mechanism to reduce waiting times? Applied health economics and health policy, 3(4), 195-203.
Delignette-Muller, M. L., & Dutang, C. (2015). fitdistrplus: An R package for fitting distributions. Journal of statistical software, 64, 1-34.
De Pablos Escobar, L., & Centeno, M. C. G. (2021). Impacto de la COVID-19 sobre las listas de espera quirúrgicas. Revista española de salud pública, (95), 38.
Díaz, A. S., & Iglesias-Gómez, G. (2013). Evolución de la productividad y asociación con la satisfacción en la atención hospitalaria y especializada de los sistemas sanitarios de las Comunidades Autónomas. Investigaciones Regionales-Journal of Regional Research, (27), 7-32.
Dimakou, S., Dimakou, O., & Basso, H. S. (2015). Waiting time distribution in public health care: empirics and theory. Health economics review, 5(1), 1-27.
García-Corchero, J. D., & Jiménez-Rubio, D. (2022). Waiting times in healthcare: equal treatment for equal need? International Journal for Equity in Health, 21(1), 1-14.
Granado, P. A. C., & Vega, A. H. (2014). Análisis de la eficiencia hospitalaria por Comunidad Autónoma en el ámbito del Sistema Nacional de Salud. Investigaciones Regionales-Journal of Regional Research, (28), 147-158.
Hastie, T., & Tibshirani, R. (1990). Generalized additive models. Monographs on statistics and applied probability, 43, 335.
López-Valcarcel, B. G., & Barber, P. (2017). Economic crisis, austerity policies, health and fairness: lessons learned in Spain. Applied Health Economics and Health Policy, 15(1), 13-21.
Madeira, A., Moutinho, V., & Fuinhas, J. A. (2021). Does waiting times decrease or increase operational costs in short and long-term? Evidence from Portuguese public hospitals. The European Journal of Health Economics, 22(8), 1195-1216.
Marazzi, A., Paccaud, F., Ruffieux, C., & Beguin, C. (1998). Fitting the distributions of length of stay by parametric models. Medical care, 915-927.
Ministerio de Sanidad (2022). Catálogo Nacional de Hospitales. https://www.sanidad.gob.es/ciudadanos/prestaciones/centrosServiciosSNS/hospitales/docs/CNH_2022.pdf
Ministerio de Sanidad, Política Social e Igualdad (2008). Informe Annual del Sistema Nacional de Salud. https://www.sanidad.gob.es/estadEstudios/home.htm
Monstad, K., Engesæter, L. B., & Espehaug, B. (2014). Waiting time and socioeconomic status -- An individual‐level analysis. Health Economics, 23(4), 446-461.
Nelder, J. A., & Wedderburn, R. W. (1972). Generalized linear models. Journal of the Royal Statistical Society: Series A (General), 135(3), 370-384.
Nikolova, S., Harrison, M., & Sutton, M. (2016). The impact of waiting time on health gains from surgery: Evidence from a national patient‐reported outcome dataset. Health economics, 25(8), 955-968.
OECD (2020). Waiting times for health services: Next in line. OECD Health Policy Studies.
Rigby, R. A., & Stasinopoulos, D. M. (2001). The GAMLSS project: a flexible approach to statistical modelling. In New trends in statistical modelling: Proceedings of the 16th international workshop on statistical modelling (Vol. 337, p. 345). University of Southern Denmark.
Rigby, R. A., & Stasinopoulos, D. M. (2005). Generalized additive models for location, scale and shape. Journal of the Royal Statistical Society: Series C (Applied Statistics), 54(3), 507-554.
Schwarz, G. (1978). Estimating the dimension of a model. The Annals of Statistics, 6(2), 461–464.
Siciliani, L., Moran, V., & Borowitz, M. (2014). Measuring and comparing health care waiting times in OECD countries. Health policy, 118(3), 292-303.
Simonsen, N. F., Oxholm, A. S., Kristensen, S. R., & Siciliani, L. (2020). What explains differences in waiting times for health care across socioeconomic status? Health Economics, 29(12), 1764-1785.
Stasinopoulos, D. M. (2019). GAMLSS Practicals for the Bilbao short course October 2019.
Stasinopoulos, D. M., & Rigby, R. A. (2008). Generalized additive models for location scale and shape (GAMLSS) in R. Journal of Statistical Software, 23, 1-46.
Stasinopoulos, M. D., Rigby, R. A., Heller, G. Z., Voudouris, V., & De Bastiani, F. (2017). Flexible regression and smoothing: using GAMLSS in R. CRC Press.
Voudouris, V., Gilchrist, R., Rigby, R., Sedgwick, J., & Stasinopoulos, D. (2012). Modelling skewness and kurtosis with the BCPE density in GAMLSS. Journal of Applied Statistics, 39(6), 1279-1293.
Información adicional
JEL Classification: C14; I18; O18; R10