BIOMETRY, MODELLING AND STATISTIC
Estimating the area and weight of cactus forage cladodes using linear dimensions

Estimating the area and weight of cactus forage cladodes using linear dimensions
Acta Scientiarum. Agronomy, vol. 43, e45460, 2021
Editora da Universidade Estadual de Maringá - EDUEM
Received: 20 November 2018
Accepted: 27 September 2019
ABSTRACT: The forage palm is one of the main forages of ruminants in semiarid regions. Measurements of leaf area are required in agronomic studies because they are one of the main parameters used to evaluate plant growth. The objective of this study was to validate and define the best models for estimating the area and weight of Giant Sweet clone (Nopalea cochenillifera) forage cladodes in a non-destructive way based on the linear dimensions of length, width and thickness. There were 432 randomly measured cladodes at 550 days after planting. The length, width and thickness of each cladode were measured using a digital calliper. The cladodes were weighed individually. The cladode area was calculated by the gravimetric method. The power regression model was the most efficient method to explain the cladode area as a function of the product of length by width, while the gamma model was the most efficient method to explain the weight of cladodes as a function of the product of length by width and thickness. The power model, , and gamma model, , were used to determine the area and weight of Nopalea cochenillifera Giant Sweet clone cladodes, respectively, based on the values of linear dimensions measured independently of the order of the cladode.
Keywords: Giant Sweet clone, non-destructive method, modelling, Nopalea cochenillifera, regression.
Introduction
Species adapted to arid and semi-arid environments, such as forage palms (Nopalea spp. and Opuntia spp.), can contribute to increasing the biomass yields of agricultural areas by improving the efficiency at which local natural resources are used (Diniz et al., 2017).
The cactus forage is a xerophilous plant with multiple uses in different countries throughout every continent; some of these uses include as forage, fruits, vegetables, raw materials for processing, biomass for energy purposes, live fences, erosion control, soil conservation, landscaping, dye production, and medicinal uses (Inglese, Barbera, & Mantia, 1995).
The cactus forage stands out as a forage alternative in semi-arid regions due to its high potential of phytomass production, high energy value, richness of non-fibrous carbohydrates, high ruminant acceptability, high digestibility coefficient, large water reserve and easy propagation (Pereira, Leite, Cavalcante, & Lucena, 2018). One of the determining factors of biomass production is the leaf area; in the cactus forage, this function of absorption and use of solar radiation in the photosynthetic process is realized by cladodes.
The cactus forage employs CAM (Crassulacean Acid Metabolism) and photosynthetic metabolism, with day closure of stomata and nocturnal carbon assimilation, thus providing a greater capacity to adapt to abiotic factors (Santos et al., 2016; Souza Filho, Ribeiro, Santos, & Macedo, 2016). The number of stomata in the cladodes is low, 10 to 30 per mm2, while the leaves of C3 plants present 300 stomata per mm2. In addition, the stomata of cactus forage can be closed for several months in water stress situations (Liguori, Inglese, Pernice, Sortino, & Inglese, 2013).
All of these anatomical and morphophysiological adaptations acquired by cactus forage contribute to the high agroecological success of the crop, allowing adaptation to environmental conditions with high atmospheric evaporative demand and reduced soil water contents due to its high water use efficiency (Hartzell, Bartlett, & Porporato, 2018; Winter, Garcia, & Holtum, 2011). The yield of this crop is influenced mainly by light interception, which in turn is determined by morphological characteristics such as the cladode area (Pinheiro et al., 2014).
The determination of the photosynthetic area of a plant, leaf or cladode is fundamental for studying the intensity of transpiration, the leaf area ratio, the specific leaf area and the leaf area index (Schmildt, Amaral, Schmildt, & Santos, 2014). Non-destructive and indirect methods are both currently used for the estimation of leaf area (Leite, Lucena, Sá Júnior, & Cruz, 2017) based on the relationships between the measurable biometric variable and the real leaf area (Flumignan, Adami, & Faria, 2008) and allowing rapid, successive evaluations of the same plant (Toebe, Cargnelutti Filho, Loose, Heldwein, & Zanon, 2012).
The development of regression models from the linear measurements of leaves to determine leaf area has been very useful in the study of plant growth and development (Achten et al., 2010). Mathematical models are advantageous because they are fast, do not destroy plants and are easy to handle in field conditions (Leite et al., 2017).
Several studies using linear dimensions in the estimation of the cladode area of cactus forage have been established for several species of the genus Opuntia: O. ficus-indica (Cortazar & Nobel, 1991; Reis, Gazarini, Fonseca, & Ribeiro, 2016) and O. stricta (Lucena, Leite, Simões, Simões, & Almeida, 2018b) and have generated equations with high precision.
Although there is information about the agronomic characteristics of the species N. cochenillifera, studies have rarely been reported in the literature for clones of this species, with estimated cladode areas (Silva et al., 2014) and weights, using the linear dimensions as an explanatory variable. The objective of this study was subsequently to validate and define the best models for non-destructively estimating the areas and weights of the cactus forage cladode (Nopalea cochenillifera (L.) Salm-Dyck) Giant Sweet clone based on its linear dimensions of length, width and thickness.
Material and methods
This research was conducted from March 15, 2016, to October 12, 2018, in the forage farming sector (GEFOR) of the Federal Rural University of Pernambuco (UFRPE), Academic Unit of Serra Talhada (UAST), which was located in the following geographic coordinates (07°57’01” S e 38°17’53” E) at an elevation of 523 metres. According to Koppen, the climate condition is a BSwh’ with a rainy season during the summer, starting in November and ending in April. The average annual rainfall is 632.2 mm, the average annual air temperature is 26ºC, and the average air relative humidity is 60% (Leite et al., 2017).
The soil used in the experiment was collected at a depth of 0-20 cm and classified as Typical Haplic Cambisol Ta Eutrophic, as described by EMBRAPA (2013). The soil sample was analysed by the soil fertility laboratory of the Empresa Pernambucana de Pesquisa Agropecuária (IPA) and was characterized by the following chemical attributes: pH (water) = 6.80; P (extractor Mehlich I) = 40 mg dm-3; K+ = 0.45; Ca2+ = 5.50; Mg2+ = 1.60; and Al3+ = 0.0 cmolc dm-3. The cleaning and preparation of the study area were performed manually in March 2016. Soon after, the cladodes of forage palms were planted. Organic fertilization was performed using 40 t ha-1 of bovine manure. The row spacing was 1.4 m, and the planting was performed using the card of deck system. In this system, a groove is made, and the cladodes are planted in a single file where one plant overlaps the other.
A uniformity trial was conducted using a cactus forage clone, Giant Sweet (Nopalea cochenillifera (L.) Salm-Dyck). The experimental unit was an area of 22.4 m2 (5.6 x 4.0 m), which consisted of five rows and 40 columns of cacti spaced in rows 1.40 apart (228,570.7 plants ha-1). The rows and columns of the border were excluded. Cultural dealings were made where necessary. Two weeds were identified upon their emergence. The area was maintained in dry conditions throughout the crop cycle. Evaluations were performed 550 days after planting (DAP).
To determine the cladode areas, a randomized collection of 432 cladodes (162- primary; 127-secondary, and 143- tertiary), free of damage, diseases or pests, was conducted according to methodologies established in the literature (Schmildt et al., 2014; Leite et al., 2017, Lucena, Leite, Cruz, & Sá Jr., 2018a). The cladodes were numbered from 1 to 432 and then measured using a digital calliper; the length (L) (cm), width (W) (cm) and thickness (T) (mm) of each cladode were also recorded. The regions of greatest width and length of each cladode were used to measure the two characteristics. The length and width were multiplied, determining the product in cm2. The cladodes were weighed on a precision balance, and their values were recorded in grams (g).
Each cladode was spread over a millimetre graph paper, and the outline of the cladode was drawn following the methodology described by Leite et al. (2017). Using scissors, the area of the millimetre graph paper covered by the outline was cut and weighed on an electronic balance. From the same paper, a square of 10 cm x 10 cm was cut, equivalent to 100 cm2, weighing 0.630 g. Thus, it was possible to calculate the proportional cladode area.
To determine the most fit model to predict the real cladode area (RCA) as a function of the product between L and W (LW), regression studies were performed using linear, gamma and power models (Lucena et al., 2018b; Leite et al., 2017; Leite, Lucena, Cruz, Sá Jr., & Simões, 2019) (Table 1). The best fit model was used to predict the weight of the cladodes as a function of thickness (T) and product between L and W (LW), and regression studies were performed using linear, gamma and power models (Table 1). The linear and power models with normal distributions assumed that the response of the dependent variable was in the range of -∞ to ∞, and the gamma models with gamma distributions assumed that the response of the dependent variable was in the range of 0 to ∞ (Lucena et al., 2018b; Leite et al., 2017; Leite et al., 2019), (Table 1).
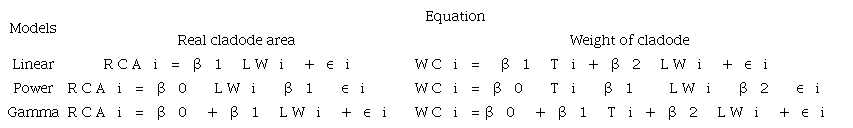
where: RCAi is the real cladode area of the i-th cactus forage; WCi is the weight of the cladode of the i-th cactus forage; LWi is the product between the length and width of the i-th cladode; Ti is the thickness of the i-th cladode; and (i is the i-th error interrelated with the cladode area or weight. (i exhibited a normal distribution of mean 0 and variance constant σ² > 0 in the distributions of parameters α and β for the linear, power and gamma models. The (0, (1and (2 are parameters related to the model.
The following criteria were used to evaluate the models: The Coefficient of determination (R²), Akaike's Information Criterion (AIC) defined by Akaike (1974), Sum of Square of Residuals (SSR) and the Willmott index (d) defined by Willmott (1981).
The coefficient of model determination is expressed by:
The Akaike information criteria (AIC), as defined by Akaike (1974), is given by:
The sum of square of the residuals (SSR) is the square sum of the difference between the values observed and predicted by the models, where the lowest value contributes to the choice of the best equation. SSR for this study is defined by the following expression:
The d index defined by Willmott (1981) is given by:
where: L(x\(^) is the maximum likelihood function, defined as the production of density function, and p is the number of model parameters; Y^_i is the values of the i-th cladode area or weight after model adjustment; and Y- is the mean value of the cladode area (Yi) or the weight cladode (Yi) of the cactus forage.
To evaluate the correlations between the variables, the Pearson correlation coefficient was used (Lucena et al., 2018a), which was denoted by:
where: Yi and Xi are the i-th observations of the variables Y and X, while Y- and X- are the means of the variables Y and X, respectively. T-tests were used to assess the significance of the correlation between the variables.
Results and discussion
Table 2 shows a high variation in Giant Sweet clone cladode size, independent of the cladode order. The mean cladode length ranged from 25.53 ± 6.33 cm in secondary cladodes to 17.30 ± 4.81 cm in tertiary cladodes. Similar variations occurred for the cladode width, especially in the secondary cladodes (12.06±2.95 cm) and in the detriment of tertiary cladodes (8.53 ± 2.06 cm). The thickness of the cladodes ranged from 2.50 mm (tertiary) to 33.40 mm (primary). The mean real cladode area ranged from 300.23 ± 133.71 cm² in secondary cladodes to 140.15 ± 68.83 cm² in tertiary cladodes. Heavier cladodes were primary (288.70 ± 108.87 g), and the lighter cladodes were tertiary (61.29 ± 30.40 g). The cladode weights showed a high dispersion, with secondary cladodes weighing 1.05 g and primary cladode weighing 965.00 g. This high variation in the size of the cladodes likely occurred because some cladodes were in expansion, while others were fully expanded, which is a peculiar growth characteristic of this cactus.
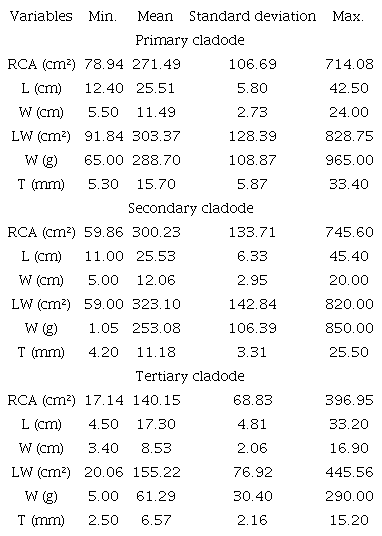
Similar results were obtained by Silva et al. (2010) relating the morphological and productive characteristics of 50 clones of cactus forage, which were first cut at 720 DAP; a mean cladode length of 21.97 cm was observed. Gomes, Queiroz, Pereira, Costa, and Oliveira (2016) verified the cladode length of Nopalea cochenillifera Giant Sweet clones, fertilized with bovine manure, as 12.35 cm at 210 DAP. Gomes et al. (2016) found a mean cladode length of 12.56 cm, width of 5.87 cm and thickness of 7.81 mm. Reis et al. (2016) verified the cladode measurements of Opuntia fícus-indica, with a mean length of 38.61 cm, a width of 18.70 cm, a thickness of 18.6 mm, an area of 586.71 cm² and a weight of 893.93 g independent of the cladode order.
There was a positive correlation between the RCA and LW (r = 0.95; p < 0.0001) of the primary cladodes, between RCA and W (r = 0.77; p < 0.0001) and between W and LW (r = 0.76; p < 0.0001) (Table 3). For secondary cladodes, RCA was positively correlated with LW (r = 0.99; p < 0.0001) and weight (r = 0.75; p < 0.0001), and W was positively correlated with LW (r = 0.73; p < 0.0001). There was a positive correlation between RCA and LW (r = 0.96; p < 0.0001) of the tertiary cladodes, between RCA and W (r = 0.91; p < 0.0001), W and LW (r = 0.87; p < 0.0001), and W and T (r = 0.67; p = 0.035). Cunha et al. (2012) observed a small positive correlation of cladode weight with length (r = 0.59), width (r = 0.61), thickness (r = 0.73) and area (r = 0.65) in Sweet cacti clone. Lucena et al. (2018b) observed that, independent of the cladode order, the area of Elephant-Mexican clone (O. stricta) presented a positive correlation (r) with the product of length by width with a magnitude of 0.90. Guimarães, Donato, Azevedo, Aspiazú, and Silva Jr. (2018) also verified a positive correlation of weight with the cladode area of 0.86 in O. ficus-indica.
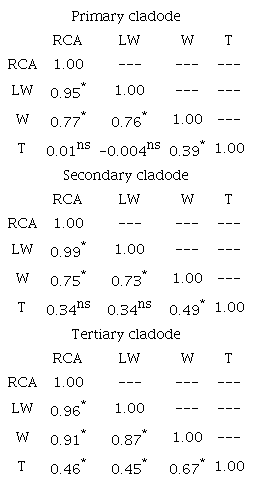
*significant by t-test (p < 0.005); nsnon-significant by t-test (p > 0.05).
Evaluating the relationship between the RCA and LW of the primary cladodes verified that the linear regression model presented an explanatory power (R²) of 98.55%, while the power model had an R2 of 99.97%, and the gamma model had an explanatory power of 99.52% (Table 4). The linear regression model showed a sum of squared residuals (SSR) of 199,676.40, while the power model showed an SSR of 194,707.10, and gamma model showed an SSR of 192,109.10. The linear model presented an Akaike information criterion (AIC) of 1,616.67, with 295.15 in the power model and 1,485.50 in the gamma model. All the models presented a Willmott index (d) of 0.974 (Table 4). The models that presented the best results for the primary cladodes were the power model followed by the gamma model.
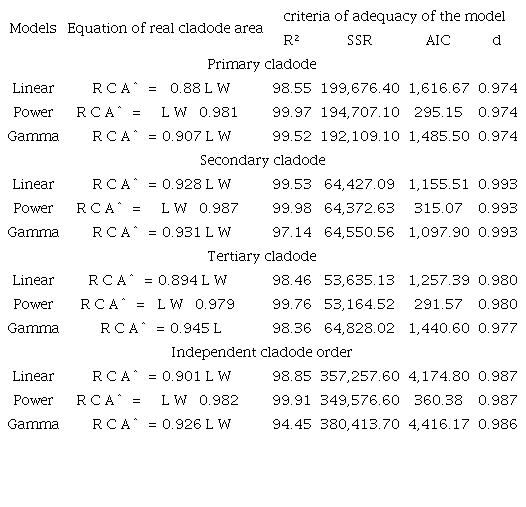
R2 (determination coefficient); SSR (sum squared of residuals); AIC (Akaike information criteria); d (Willmott index).
In evaluating the relationship between RCA and LW in the secondary cladodes, the power model presented the best results for the coefficient of model determination (99.98%), sum squared of residuals (64,372.63), Akaike information criteria (315.07) and Willmott index (0.993) compared with the linear and gamma models whose explanatory powers were 99.53% and 97.14%, SSR (64,427.09 and 64,550.56), AIC (1,155.51 and 1,097.90) and Willmott index (0.993 and 0.993), respectively (Table 4). For the tertiary cladodes, the power model presented the best results for R² (99.76%), SQR (53,164.52), AIC (291.57) and Willmott index (0.98) compared with the linear and gamma models (Table 4). Independent of the cladode order evaluated, the highest performance was for the power model, which presented the highest power of explanation (R² = 99.91%) and lowest SSR (349,576.60), AIC (360.38) and Willmott index (0.987) compared to the linear and gamma models (Table 4).
Similar results were reported in Opuntia stricita (Lucena et al., 2018b), Opuntia fícus-indica (Reis et al., 2016) and Nopalea cochenillifera (Silva et al., 2014) when the authors verified the relation of the cladode areas as a function of the products of length and width using a linear regression model that presented explanatory powers of 96.77, 91, and 96.96%, respectively.
Figure 1 shows the relation of observed values of the real cladode area and the values estimated by models of both according with and independent of the cladode order. Note that for all orders and independent of the cladode order, the values estimated by the models are very close to the observed values, indicating good model adequacies.
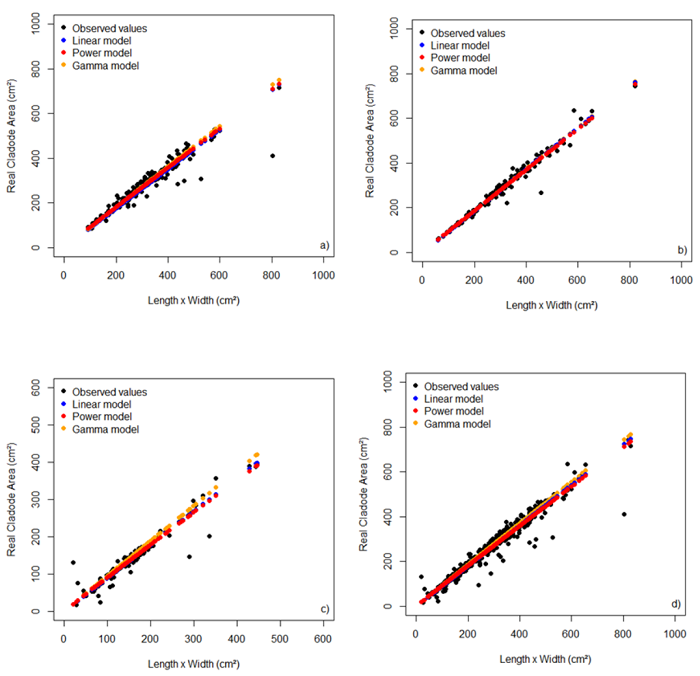
Figure 1
Relation of the real cladode area and the product of length by width of primary (a), secondary (b), and tertiary (c) cladodes and independent of the cladode order (d) and their respective model fittings.
In the evaluation of the weights of the primary cladodes as a function of the thickness and the product of length by width, it was verified in Table 5 that the gamma model presented the best results with an R² of 99.90%, an SSR of 1,301,280, an AIC of 1,879.40 and a Willmott index of 0.892, while the linear model presented the lowest values of R² (91.30%), SSR (15,514,515), AIC (1,950.80) and Willmott index (0.854). The power model presented a higher power of explanation of 99.74% and a smaller AIC (157.55), as well as an SSR of 1,566,153 and a Willmott index of 0.854. Checking the adequacy criteria of the models, the gamma model is the most adequate model to explain the relationship between the weight of primary cladodes as a function of thickness and the product of length by width. Based on the four criteria evaluated, the gamma model presents better results compared to the linear and power models.
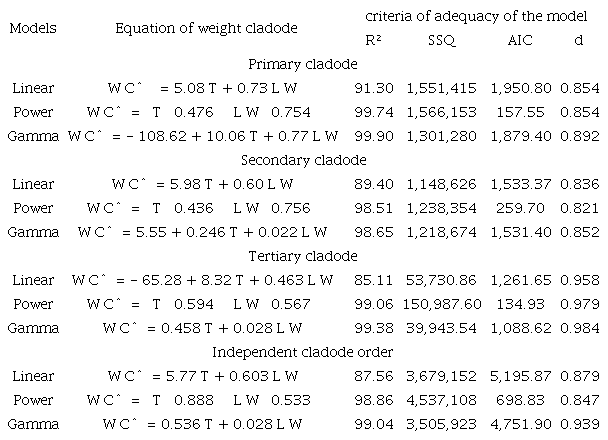
R2 (determination coefficient); SSR (sum squared of residuals); AIC (Akaike information criteria); d (Willmott index).
In the evaluation of the relationship between the weight, thickness and the product of length by width of the secondary cladodes, the gamma model presented the highest coefficient of determination of the model (98.65%), a sum squared of residuals of 1,218,674, Akaike information criteria of 1,531.40 and a larger Willmott index (0.852); the linear model presented a smaller R² (89.40%) and SSR (1,148,626), an AIC of 1,533.37 and a Willmott index of 0.836, while the power model presented a higher power of explanation (98.51%), an SSR of 1,238,354, and a smaller AIC (259.70) and Willmott index (0.821) (Table 5). Checking the adequacy criteria of the model, the gamma model was most adequate to explain the relationship between the weight of secondary cladodes as a function of thickness and the product of length by width; compared with the other models, it presented better results in three of the four analysed criteria.
For the tertiary cladodes, the gamma model showed the best performance for R² (99.38%), SSR (39,943.54) and Willmott index (0.984) compared to the linear and power models (Table 5). Independent of the cladode order evaluated, the gamma model was also the most adequate to explain the weight of cladodes because it presented the highest R² (99.04%) and Willmott index (0.939) and a smaller SSR (3,505,923) compared to the linear and power models (Table 5). Reis et al. (2016) found that the weight of cladodes of Opuntia fícus-indica can be estimated by a linear regression model with a precision of 91%. The linear regression model was used to explain the weight of cucumber leaves (Cho, Oh, Oh, & Son, 2007) and cacau leaves (Salazar, Melgarejo, Bautista, Rienzo, & Casanoves, 2018); taking into account the product of length and width as the explanatory variable, these models presented explanatory powers of 93.3% and 97%, respectively.
Figure 2 shows the relation of the observed values of weight cladodes and the values estimated by the models independent of the cladode order as a function of the explanatory variables of cladode length by width and thickness. Note that independent of the cladode order, the values estimated by the models are very close to the observed values, indicating good model adequacies.
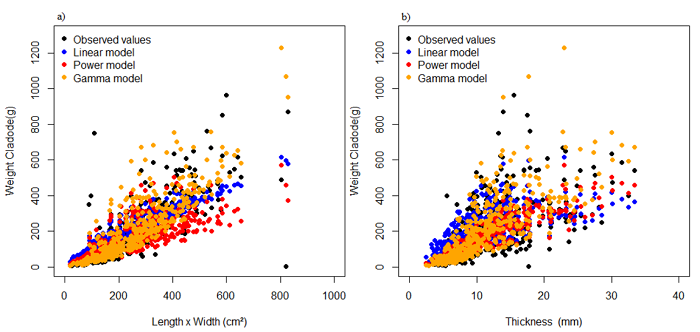
Figure 2
Relation of weight cladodes observed and adjusted by models independent of cladode order as a function of the explanatory variables product of length by width (a) and thickness (b).
Conclusion
The product of cladode length and width is an appropriate parameter for use as an independent variable in the prediction of the cladode area of the Nopalea cochenillifera Giant Sweet clone by regression models.
The power () and gamma () models, can be used to determine the cladode area and weight of Nopalea cochenillifera Giant Sweet clone.
The adoption of the power and gamma models makes it possible to non-destructively estimate the area and weight of cladodes of cactus forage Giant Sweet clone with high precision, speed and low cost, requiring only measurement of the cladode length, width and thickness.
References
Achten, W. M. J., Maes, W. H., Reubens, B., Mathijs, E., Singh, V. P., Verchot, L. V., & Muys, B. (2010). Biomass production and allocation in Jatropha curcas L. seedlings under different levels of drought stress. Biomass and Bioenergy, 34(5), 667-676. DOI: 10.1016/j.biombioe.2010.01.010
Akaike, H. (1974). A new look at the statistical model identification. IEEE Transactions on Automatic Control, 19(6), 716-723. DOI: 10.1109/TAC.1974.1100705
Cho, Y. Y., Oh, S., Oh, M. M., & Son, J. E. (2007). Estimation of individual leaf area, fresh weight, and dry weight of hydroponically grown cucumbers (Cucumis sativus L.) using leaf length, width, and SPAD value. Scientia Horticulture, 111(4), 330-334. DOI: 10.1016/j.scienta.2006.12.028
Cortazar, V. G., & Nobel, P. S. (1991). Prediction and measurement of high annual productivity for Opuntia ficus-indica. Agricultural and Forest Meteorology, 56(3-4), 261-272. DOI: 10.1016/0168-1923(91)90095-8
Cunha, D. N. F. V., Gomes, E. S., Martuscello, J. A., Amorim, P. L., Silva, R. C., & Ferreira, P. S. (2012). Morfometria e acúmulo de biomassa em palma forrageira sob doses de nitrogênio. Revista Brasileira de Saúde e Produção Animal, 13(4), 1156-1165. DOI: 10.1590/S1519-99402012000400005
Diniz, W. J. S., Silva, T. G. F., Ferreira, J. M. S., Santos, D. C., Moura, M. S. B., Araújo, G. G. L., & Zolnier, S. (2017). Forage cactus-sorghum intercropping at different irrigation water depths in the Brazilian Semiarid Region. Pesquisa Agropecuária Brasileira, 52(9), 724-733. DOI: 10.1590/s0100-204x2017000900004
Empresa Brasileira de Pesquisa Agropecuária [EMBRAPA]. (2013). Centro Nacional de Pesquisas de Solos. Sistema Brasileiro de Classificação de Solos (3 ed.). Brasília, DF: Embrapa Solos.
Flumignan, D. L., Adami, M., & Faria, R. T. (2008). Área foliar de folhas íntegras e danificadas de cafeeiro determinada por dimensões foliares e imagem digital. Coffe Science, 3(1), 1-6. DOI: 10.25186/cs.v3i1.67
Gomes, M. L. S., Queiroz, M. J., Pereira, F. C., Costa, D. B., & Oliveira, G. S. (2016). Caracterização biométrica de artículos da palma miúda (Nopalea cochenillifera) em função da adubação orgânica. Revista Principia, 2(9), 39-45. DOI: 10.18265/1517-03062015v1n29p39-45
Guimarães, B. V. C., Donato, S. L. R., Azevedo, A. M., Aspiazú, I., & Silva Jr., A. A. (2018). Prediction of ‘Gigante’ cactus pear yield by morphological characters and artificial neural networks. Revista Brasileira de Engenharia Agrícola e Ambiental, 22(5), 315-319. DOI: 10.1590/1807-1929/agriambi.v22n5p315-319
Hartzell, S., Bartlett, M. S., & Porporato, A. (2018). Unified representation of the C3, C4, and CAM photosynthetic pathways with the Photo3 model. Ecological Modelling, 384, 173-187. DOI: 10.1016/j.ecolmodel.2018.06.012
Inglese, P., Barbera, G., Mantia, T. L. (1995). Research strategies for the improvement of cactus pear (Opuntia ficus-indica) fruit quality and production. Journal of Arid Environments, 29(4), 455-468. DOI: http://dx.doi.org/10.1016/S0140-1963(95)80018-2
Leite, M. L. M. V., Lucena, L. R. R., Sá Júnior, E. H., & Cruz, M. G. (2017). Estimativa da área foliar em Urochloa mosambicensis por dimensões lineares. Revista Agropecuária Técnica, 38(1), 9-16. DOI: 10.25066/agrotec.v38i1.32041
Leite, M. L. M. V., Lucena, L. R. R., Cruz, M. G., Sá Júnior, E. H., & Simões, V. J. L. P. (2019). Leaf area estimate of Pennisetum glaucum by linear dimensions. Acta Scientiarum. Animal Sciences, 41(1), 1-7. DOI: 10.4025/actascianimsci.v41i1.42808
Liguori, G., Inglese, G., Pernice, F., Sortino, G., & Inglese, P. (2013). CO2 uptake of Opuntia ficus-indica (L.) Mill. whole tress and single cladodes, in relation to plant water status and cladode age. Italian Journal of Agronomy, 8(1), 14-20. DOI: 10.4081/ija.2013.e3
Lucena, L. R. R., Leite, M. L. M. V., Cruz, M. M., & Sá Jr., E. H. (2018a). Estimativa da área foliar em Urochloa mosambicensis por dimensões foliares e imagens digitais. Archivos de Zootecnia, 67(259), 408-413. DOI: 10.21071/az.v67i259.3798
Lucena, L. R. R., Leite, M. L. M. V., Simões, V. J. L. P., Simões, V. J. L. P., & Almeida, M. C. R. (2018b). Área de cladódio da palma Opuntia stricta utilizando dimensões lineares. Agrarian Academy, 5(9), 46-55. DOI: 10.18677/Agrarian_Academy_2018a5
Pereira, J. S., Leite, M. L. M. V., Cavalcante, A. B., & Lucena, L. R. R. (2018). Crescimento inicial de Nopalea cochenillifera em função do fracionamento do cladódio. Revista Agropecuária Técnica , 39(2), 120-128. DOI: 10.25066/agrotec.v39i2.37995
Pinheiro, K. M., Silva, T. G. F., Carvalho, H. F. S., Santos, J. E. O., Morais, J. E. F., Zolnier, S., & Santos, D. C. (2014). Correlações do índice de área do cladódio com características morfogênicas e produtivas da palma forrageira. Pesquisa Agropecuária Brasileira , 49(12), 939-947. DOI: 10.1590/S0100-204X201400120000
Toebe, M., Cargnelutti Filho, A., Loose, L. H., Heldwein, A. B., & Zanon, A. J. (2012). Área foliar de feijão-vagem (Phaseolus vulgaris L.) em função de dimensões foliares. Semina: Ciências Agrárias, 33(1), 2491-2500. DOI: 10.5433/1679-0359.2012v33Supl1p2491
Reis, C. M. G., Gazarini, L. C., Fonseca, T. F., & Ribeiro, M. M. (2016). Above-ground biomass estimation of Opuntia ficus-indica (L.) Mill. for forage crop in a mediterranean environment by using non-destructive methods. Experimental Agriculture, 54(2), 227-242. DOI: 10.1017/S0014479716000211
Salazar, J. C. S., Melgarejo, L. M., Bautista, E. H. D., Rienzo, J. A., & Casanoves, F. (2018). Non-destructive estimation of the leaf weight and leaf area in cacao (Theobroma cacao L.). Scientia Horticulturae, 229, 19-24. DOI: 10.1016/j.scienta.2017.10.034
Santos, T. N., Dutra, E. D., Prado, A. G., Leite, F. C. B., Souza, R. F. R., Santos, D. C., ... Menezes, R. S. C. (2016). Potential for biofuels from the biomass of prickly pear cladodes: Challenges for bioethanol and biogas production in dry areas. Biomass and Bioenergy , 85, 215-222. DOI: 10.1016/j.biombioe.2015.12.005
Schmildt, E. R., Amaral, J. A. T., Schmildt, O., & Santos, J. S. (2014). Análise comparativa de equações para estimativa da área foliar em cafeeiros. Coffee Science, 9(2), 155-167. DOI: 10.25186/cs.v9i2.573
Silva, T. G. F., Miranda, K. R., Santos, D. C., Queiroz, M. G., Silva, M. C., Neto, J. F. C., & Araújo, J. E. M. (2014). Área do cladódio de clones de palma forrageira: modelagem, análise e aplicabilidade. Revista Brasileira de Ciências Agrárias, 9(4), 633-641. DOI: 10.5039/agraria.v9i4a4553
Silva, N. G. M., Lira, M. A., Santos, M. V. F., Dubeux Jr., J. C. B., Mello, A. C. L., & Silva, M. C. (2010). Relação entre características morfológicas e produtivas de clones de palma-forrageira. Revista Brasileira de Zootecnia, 39(11), 2389-2397. DOI: 10.1590/S1516-35982010001100011
Souza Filho, P. F., Ribeiro, V. T., Santos, E. S., & Macedo, G. R. (2016). Simultaneous saccharification and fermentation of cactus pear biomass-evaluation of using different pretreatments. Industrial Crops and Products, 89, 425-433. DOI: 10.1016/j.indcrop.2016.05.028
Willmott, C. J. (1981). On the validation of models. Physical Geography, 2(2), 184-194. DOI: 10.1080/02723646.1981.10642213
Winter, K., Garcia, M. N., & Holtum, J. A. M. (2011). Drought-stress-induced up-regulation of CAM in seedlings of a tropical cactus. Journal of Experimental Botany, 62(11), 4037-4042. DOI: 10.1093/jxb/err106
Author notes
*Author for correspondence. E-mail: leandroricardo_est@yahoo.com.br