PLANT BREEDING
Selection for grain size and sieve yield in F3 common bean genotypes using linear mixed models

Selection for grain size and sieve yield in F3 common bean genotypes using linear mixed models
Acta Scientiarum. Agronomy, vol. 44, e52953, 2022
Editora da Universidade Estadual de Maringá - EDUEM
Received: 03 April 2020
Accepted: 16 July 2020
ABSTRACT. : Grain size is an essential trait in common bean breeding as it determines the acceptance of a new cultivar by producers, consumers, and the industry. The objectives of this study were to identify the ideal traits for selecting common bean lines in the F3 generation to obtain an adequate sieve yield and to identify the best lines for sieve yield by applying early generation selection. Two trials were conducted in two locations during the 2016/2017 crop season. These trials were composed of 300 F3 populations and two parents (used as checks). The experimental design used was an augmented block design without repetition for the treatments (lineages). After harvest, the grain yield, yield components, and sieve yield (SY) were evaluated. In conclusion, selection in the F3 generation can be performed for sieve yield, considering the traits SY12+13, SY14, and relative grain yield, as they present the highest values of heritability and greatest correlation between genotype and performance in the evaluated environments. Additionally, the lines selected to continue in the breeding program are composed of the 15 best lineages for traits SY12+13, SY14, and relative grain yield. Preference should be given to lines that excel in more than one of these traits.
Keywords: Phaseolus vulgaris L., early generation selection, relative grain yield, genotype × environment interaction..
Introduction
The main goal of breeding programs for the common bean (Phaseolus vulgaris L.) is to develop cultivars with high grain yield potential (Silva, Melo, Melo, Bassinello, & Pereira, 2013). However, for the release of a new cultivar and its acceptance by producers, consumers, and industry, other characteristics need to be present (Assefa et al., 2019). Such characteristics include plant architecture, life cycle, resistance to diseases, and the shape/size and color of the grains. Grain size is becoming increasingly significant as an essential trait for breeding. Common bean grains are classified using oblong sieves that are numbered from 10 to 14. Until 1998, the Brazilian commercial group ‘carioca’ presented the grain size considered standard in the Brazilian market, which remained in sieves 11 and 12. After 1998, the release of the cultivar Pérola by Embrapa resulted in a change in the grain pattern and the standard size changed to sieves 12 and 13, which were then preferred by consumers and by the industry (Carbonell, Chiorato, Gonçalves, Perina, & Carvalho, 2010).
Early selection in autogamous species generally occurs in progenies obtained from the F2 and F3 generations. The methodology to be used will depend on the ability of the breeder to select superior progenies in highly heterozygous populations. Selection in early generations may be more efficient for traits that present high heritability (Ribeiro, Pereira, Coelho, & Freitas Júnior, 2009). However, this does not mean that the selection of traits with polygenic inheritance in these generations would not be efficient (Ramalho, Oliveira, & Ferreira, 2005).
The objectives of this study were to identify the ideal traits to select common bean lines in the F3 generation to obtain an adequate sieve yield, and to identify the best lines for sieve yield by applying early generation selection.
Material and methods
In the 2014/2015 crop season, artificial crosses between the cultivars IAC Imperador and IPR Tuiuiú were carried out (Table 1). Each F1 plant originated in an F2 row of 2.5 m. From these F2 lines, each plant was harvested individually, producing 300 F3 lines. The F3 lines were sown in the beginning of October 2016 at two locations in Paraná State, Brazil: Pato Branco (PB; latitude 26º07’ S, longitude 52º43’ W, altitude 683 m) and Clevelândia (CL; latitude 26º24’ S, longitude 52º19’ W, altitude 943 m). In both locations, sowing was carried out in a no-tillage system with a density of 12 plants per linear meter. Each of the 300 genotypes was sown in one row, 2.5 m long, spaced 0.5 m between rows. Fertilization was composed of 280 kg ha-1 of N-P-K (8-20-15), applied in furrows at sowing. In addition, a covering application of 45 kg ha-1 N was performed at phenological stage V4 (Fernández, Gepts, & López, 1986).
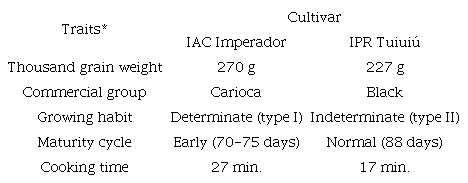
*Source: Chiorato et al. (2012), and IAPAR (retrieved on January, 20, 2020 from http://www.iapar.br/arquivos/File/folhetos/iprtuiuiu/iprtuiuiu.html)
The experimental design used was an augmented block design (Federer, 1956) composed of four blocks. Parents were used as checks in the trials. Four rows of each parent were allocated in each block and randomly distributed, that is, 10% of the total area was composed of the checks. Approximately 80 F3 lines were allocated in each block, and they were not repeated in the other blocks. The 300 tested genotypes were not separated in relation to the type of tegument although the parents were of contrasting groups. This separation was made in subsequent generations. The tegument of the seed is a tissue of maternal origin, and for this reason, the tegument is delayed by one generation in relation to the embryo.
The harvest of all genotypes was performed manually to avoid broken grains. The evaluated traits were as follows: number of legumes per plant (NLP), number of grains per plant (NGP), number of grains per legume (NGL), grain weight per plant (GWP, in g), and thousand grain weight (TGW, in g). Regarding the partial production of genotypes, the grains were classified in sieves with oblong hole numbers 11 (11/64" in.), 12 (12/64"), 13 (13/64" in.), and 14 (14/64" in.) for the determination of grain production in each sieve. This information was used to determine the relative grain yield (RGY, in %), and sieve yield (SY, %) for sieves 11, 12, 13 and 14 (SY11, SY12, SY13, and SY14, respectively), the sum of SY12 and SY13 (SY12+13, in %), and sum of SY12, SY13 and SY14 (SY12+13+14, in %). The sum of SY11, SY12, SY13, and SY14 totaled 100%.
RGY was calculated using the equation proposed by Carbonell et al. (2010), with modifications (Equation 1):
, (Equation 1)
where the parameters are as defined above.
Variance components were evaluated using the restricted maximum likelihood (REML) method, and the mean components were obtained using the best linear unbiased prediction (BLUP) method. The analysis of adaptability, stability, and productivity was performed using the Selegen statistical package (Resende, 2007), model 77 (Equation 2):
, (Equation 2)
where: y is the vector of data, f is a vector of effects assumed as fixed (means of the checks and mean of the principal treatments in each location), b is a vector of the environmental effects of blocks (assumed as random), g is a vector of the genotypic effects (assumed as random), i is the vector of the genotype × environment interaction (random), and e is the vector of the residual (random). Uppercase letters represent incidence matrices for these effects.
The ranking of genotypes was based on the harmonic mean relative performance of the genetic values, multiplied by the general mean of all locations (HMRPGV*GM). This parameter gives the mean genotypic value, penalized by instability and capitalized by adaptability. According to these criteria, all traits present the same importance once they are correlated with the general mean.
Results and discussion
Estimation of the variance components showed a large variation in the broad sense heritability (h2g) for the evaluated traits (Table 2). The highest h2g was obtained for the traits SY14, SY12+13, RGY, and SY13, with values of 0.53, 0.52, 0.46, and 0.44, respectively. These results are within the expected range for traits controlled by a few genes, as found by Sundaram et al. (2019) for chickpea, who concluded that two genes were controlling 100-seed weight. These h2g values indicate that the selection for SY is feasible in F3 lines, and SY12+13 and SY14 should be prioritized when early generation selection is applied to identify lineages with an appropriate grain size and sieve yield. For all traits, the interaction variance (Vint) was responsible for the largest part of the phenotypic variance (Vf).
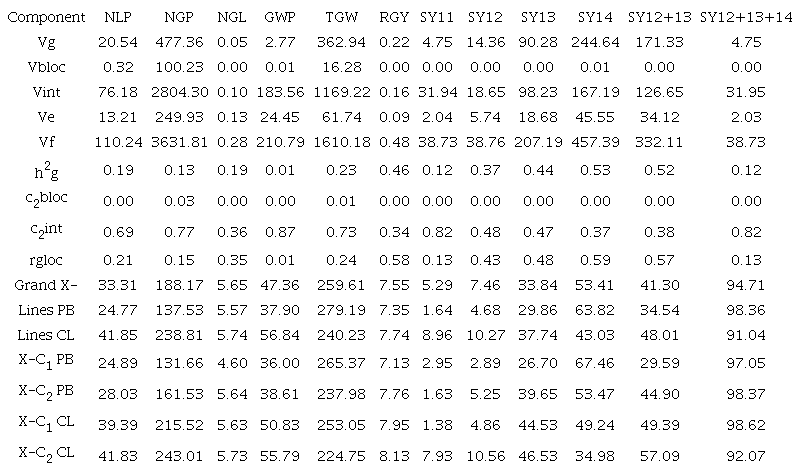
Vg: genotypic variance; Vbloc: environmental variance between blocks; Vint: genotype x environment interaction variance; Ve: residual variance; Vf: individual phenotypic variance, h2g: coefficient of individual heritability in the broad sense; c2bloc: coefficient of determination of block effects; c2int: coefficient of determination of the genotype x environment interaction effects; rgloc: genotypic correlation through environments; Grand X-: mean performance for the 300 common bean F3 lines and the two parents (checks); C1: parent 1/check 1, cultivar IAC Imperador; C2: parent 2/check 2, cultivar IPR Tuiuiú; PB: Pato Branco, state of Paraná, Brazil; CL: Clevelândia, state of Paraná, Brazil. For example, X-C1 PB is the mean of the check C1 in Pato Branco, state of Paraná, Brazil.
The yield components showed low values for h2g: NLP (0.19), NGP (0.13), NGL (0.19), GWP (0.01), and TGW (0.23). These results can be explained by the fact that grain production and grain yield components are polygenic and therefore strongly influenced by the environment (Pereira et al., 2016). Lana, Cardoso, and Cruz (2003) found higher values of h2g in F3 lineages for NLP (0.57 to 0.71) and corroborated the current results for traits such as NGL (0.03 to 0.16) and TGW (0.02 to 0.66). These authors found an h2g for grain yield of between 0.57 and 0.71 in progenies of different common bean crosses evaluated in the ‘summer’ crop season. The current study identified an extremely low h2g value for GWP. This result occurred due to the low h2g for grain yield components, and because these results are obtained from a single row and not from a plot, only the central row could be harvested to reduce the experimental error.
Based on the genotype correlation between performance in the environments (rgloc), traits RGY (0.58), SY12+13 (0.57), and SY14 (0.59) can be highlighted. They showed greater stability in both environments because they are traits with a qualitative inheritance. These traits can be considered the easiest to select and fix as well as being less influenced by the environment (Bered, Barbosa Neto, & Carvalho, 1997). For the other traits, it is possible to observe the occurrence of a complex interaction, with significant changes in the ranking of genotypes when performance in the test locations was compared (Table 3).
The percentage of acceptable grains (summarized by the trait SY12+13+14) was 98.36 and 91.04% in PB and CL, respectively. These results are satisfactory, since the sieves with numbers 12, 13, and 14 are considered the most important because of the current demand of the consumer market and the packaging industry. The RGY was acceptable for both environments and similar to the checks in Table 2. These high values of RGY may be related to the presence of residual heterotic effects, since the lines were evaluated in the F3 generation. According to Carbonell et al. (2010), breeding programs should only select new cultivars with RGY greater than 70%. However, the effects of heterosis are not as high in autogamous as in allogamous species, even in the F1 generation. Thus, no large RGY reductions in homozygous generations are expected.
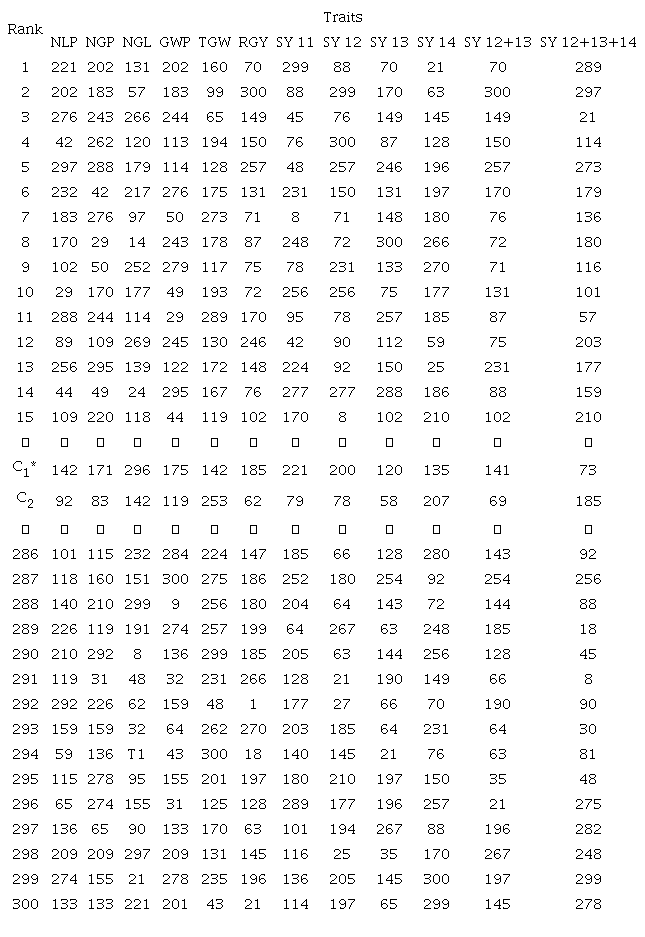
*C1 (IAC Imperador) and C2 (IPR Tuiuiú) refers to the parents of the lineages and were used as checks in the trials. The interpretation of the Table changes for lineages and for the checks. For example: lineage 221 presented the highest value for NLP. Counterpart, for C1 and C2 is indicated the position of the checks in relation to the lineages, i.e., check C1 was the 142nd best ranked for NLP.
TGW in CL decreased as the number of legumes and grains increased. On the other hand, the lower number of grains provided a higher TGW in PB. When the number of grains increases or decreases, the relationship between source and sink changes, that is, under the same translocation rate of photoassimilates, a lower number of grains theoretically improves the grain mass. The distribution of photoassimilates occurs according to the characteristics of each genotype, involving environmental conditions and the level of stresses, adjusting the source and sink relations (Fancelli, Alves, & Almeida, 2015).
GWP showed a better performance for the lines in CL in comparison to the PB environment, with values of 56.84 and 37.90 g, respectively. The difference in results is related to the contrasting climatic conditions between these two environments. In PB, low rainfall led to the occurrence of water deficit during flowering. The stages in which common bean crops are more sensitive to drought stress are germination (V0), flowering (R6), and legume formation (R7), where they cause the greatest reductions in productivity (Brito et al., 2016; Empresa Brasileira de Pesquisa Agropecuária [Embrapa], 2013). In CL, climatic conditions for the development of the crop were closer to the ideal, which resulted in better grain filling and consequently, a higher GWP.
SY is a sensitive trait in the common bean because it is directly influenced by the yield components and, consequently, by all the traits that affect these components. In PB, when the grain size was higher in SY12+13+14, the NLP was smaller, and this lower NLP decreased GWP. The variable that most contributes to increased productivity in common bean is NLP, acting both directly and indirectly, that is, there is a visible correlation between grain mass and NLP (Cabral, Soares, Lima, Soares, & Silva, 2011). Likewise, this higher SY provided a lower NGP in PB. There is a partial compensation for the increase in grain size in soybean crops when the NLP and NGL decrease, and these components are the most important for crop yield (Herbert & Litchfield, 1982). In contrast, TGW was higher in PB, and this is true when considering the SY14 observed in PB, but when the genotypes presented high values for SY12 and SY13, there was a small decrease in TGW and GWP.
The variance of the genotype × environment interaction (Vint) was high, similar to the c2int coefficient, causing a difficulty in selecting genotypes based on some of the evaluated traits in early generations. They are strongly influenced by the environment, which makes selection more difficult. Other authors have also observed significant genotype × environment interactions for grain size (Arns et al., 2018), number of legumes per plant (NLP; Okii et al., 2017), 100 grain weight (Pereira et al., 2013; Okii et al., 2017), and grain yield (GY; Ribeiro, Mambrin, Storck, Prigol, & Nogueira, 2013).
In Table 3, the 300 lines are ranked, and the 15 genotypes with the best performance and the 15 with the worst performance are shown. It is possible to divide the traits of Table 3 into two groups: the first group is composed of NLP, NGP, NGL, GWP, and TGW, which are directly obtained from plants. The second group is composed of the index RGY, and the traits SY11, SY12, SY13, SY14, SY12+13, and SY12+13+14, which are parts of this index. Hence, the behavior of these traits can be identified, and the relationship between them discerned for genetic improvement.
For the ideal grain size considered by the packaging companies (SY12+13+14), genotypes 289, 297, 21, 114, 273, 179, 136, 180, 116, 101, 57, 203, 177, 159, and 210 were the best ranked lines. The parents used as checks C1 and C2 were positioned at 73 and 185, respectively. When comparing the genotypes with the yield components, when larger grain sizes occurred, a higher TGW, a lower NGP, and a larger NGL were observed to be present. According to Ribeiro, Domingues, and Zemolin (2014), grain mass presents a moderate, negative correlation with NGP and with NGL, and therefore, the increase of NGP and NGL implies a reduction in grain mass. Jauer, Menezes, and Garcia (2002) verified in four common bean cultivars that the highest TGW was found in the cultivar with the largest grain size.
NLP had no correlation to the largest grain size, and breeding programs should therefore select them separately. The highest NLP and the highest NGL can be used for the selection of common bean lines with differentiated grain conformation and with higher grain yield (Vencovsky & Barriga, 1992).
According to Carbonell et al. (2010), SY12 and SY13 are the standard for packing industries and consumers. The best lines for SY12+13 were 70, 300, 149, 150, 257, 170, 76, 72, 71, 131, 87, 75, 231, 88, and 102. The five best genotypes ranked by RGY were the same for SY12+SY13 probably because SY12 and SY13 have a higher weight in the composition of the RGY index. Line 300 had the second-best ranking for RGY. However, it was among the worst in relation to GWP and TGW. Line 114 was the best ranked for GWP (5th), which was also well ranked (4th) for SY12+SY13+SY14. These two aspects, related to lines 300 and 114, show that GWP and yield RGY are probably not highly correlated. This constitutes a challenge for common bean breeding. For farmers, what matters is the capability to commercialize his product, with the best possible commercial type associated with high production. In this way, for both breeders and farmers, what matters is a composite trait called ‘quality per hectare’. These results indicate that SY has a greater heritability, perhaps more due to morphology than the physiology of the genotype, which allows greater efficiency of selection for seed size and/or shape in an early generation selection compared to grain yield itself, represented here by GWP.
Checks C1 and C2 were ranked 141st and 69th for RGY, respectively. These results indicate that the parents used in these crosses are adequate to achieve new genotypes and cultivars with better grain size and a higher sieve yield.
Conclusion
Selection in the F3 generation can be performed for sieve yield, considering mainly the traits SY12+13, SY14, and RGY index, since they present the highest values of heritability and greater genotype correlation between the performance in the evaluated environments. In addition, the lines selected to continue in the breeding program are the 15 best lineages for traits SY12+13, SY14, and RGY. Preference should be given to lines that excel in more than one of these traits.
Acknowledgments
The authors are grateful to CNPq, CAPES, and UTFPR for financial support, and KSP Sementes e Pesquisas LTDA for the support in the field trials
References
Arns, F. D., Ribeiro, N. D., Mezzomo, H. C., Steckling, S. M., Kläsener, G. R., & Casagrande, C. R. (2018). Combined selection in carioca beans for grain size, slow darkening and fast-cooking after storage times. Euphytica, 214(4), 66. DOI: https://doi.org/10.1007/s10681-018-2149-8
Assefa, T., Mahama, A. A., Brown, A. V., Cannon, E. K. S., Rubyogo, J. C., Rao, I. M., ... Cannon, S. B. (2019). A review of breeding objectives, genomic resources, and marker-assisted methods in common bean (Phaseolus vulgaris L.). Molecular Breeding, 39(20), 1-23. DOI: https://doi.org/10.1007/s11032-018-0920-0
Bered, F., Barbosa Neto, J. F., & Carvalho, F. I. F. (1997). Marcadores moleculares e sua aplicação no melhoramento genético de planta. Ciência Rural, 27(3), 513-520. DOI: https://doi.org/10.1590/S0103-84781997000300026
Brito, J. E. D., Almeida, A. C. S., Lyra, G. B., Ferreira Junior, R. A., Teodoro, I., & Souza, J. L. (2016). Produtividade e eficiência de uso da água em cultivo de feijão sob diferentes coberturas do solo submetido à restrição hídrica. Revista Brasileira de Agricultura Irrigada, 10(2), 565-575. DOI: https://doi.org/10.7127/rbai.v10n200405
Cabral, P. D. S., Soares, T. C. B., Lima, A. B. P., Soares, Y. J. B., & Silva, J. A. (2011). Análise de trilha do rendimento de grãos de feijoeiro (Phaseolus vulgaris L.) e seus componentes. Revista Ciência Agronômica, 42(1), 132-138. DOI: https://doi.org/10.1590/S1806-66902011000100017
Carbonell, S. A. M., Chiorato, A. F., Gonçalves, J. G. R., Perina, E. F., & Carvalho, C. R. L. (2010). Tamanho de grão comercial em cultivares de feijoeiro. Ciência Rural, 40(10), 2067-2073. DOI: https://doi.org/10.1590/S0103-84782010005000159
Chiorato, A. F., Carbonell, S. A. M., Carvalho, C. R. L., Barros, V. L. N. P., Borges, W. L. B., Ticelli, M., … Santos, N. C. B. (2012). ‘IAC IMPERADOR’: early maturity “carioca” bean cultivar. Crop Breeding and Applied Biotechnology, 12(4), 297-300. DOI: https://doi.org/10.1590/S1984-70332012000400012
Empresa Brasileira de Pesquisa Agropecuária [EMBRAPA]. (2013). Informações técnicas para o cultivo do feijoeiro comum na região nordeste Brasileira 2013-2014. Aracaju, SE: Embrapa Tabuleiros Costeiros.
Fancelli, A. L., Alves, L. R. A., & Almeida, R. E. M. (2015). Milho. Brasília, DF: Embrapa/CPAC.
Federer, W. T. (1956). Augmented (or hoonuiaku) designs. Biometrics Unit Technical Reports, 1-33.
Fernández, F. C., Gepts, P., & López, M. (1986). Etapas de desarrollo de la planta de frijol común (Phaseolus vulgaris L.). Cali, CO: Centro Internacional de Agricultura Tropical.
Herbert, S. J., & Litchfield, G. V. (1982). Partitioning soybean seed yield components. Crop Science, 22(5), 1074-1079. DOI: https://doi.org/10.2135/cropsci1982.0011183X002200050044x
Jauer, A., Menezes, N. L., & Garcia, D. C. (2002). Tamanho das sementes na qualidade fisiológica de cultivares de feijoeiro comum. Revista da Faculdade de Zootecnia, Veterinária e Agronomia, 9(1), 65-75.
Lana, A. M. Q., Cardoso, A. A., & Cruz, C. D. (2003). Herdabilidades e correlações entre caracteres de linhagens de feijão obtidas em monocultivo e em consórcio com o milho. Ciência Rural, 33(6), 1031-1037. DOI: https://doi.org/10.1590/S0103-84782003000600006
Okii, D., Mukankusi, C., Sebuliba, S., Tukamuhabwa, P., Tusiime, G., Talwana, H., ... Gepts, P. (2017). Genetic variation, Heritability estimates and GXE effects on yield traits of Mesoamerican common bean (Phaseolus vulgaris L.) germplasm in Uganda. Plant Genetic Resources, 16(3), 237-248. DOI: https://doi.org/10.1017/S1479262117000259
Pereira, H. S., Costa, A. F., Melo, L. C., Peloso, M. J., Faria, L. C., & Wendland, A. (2013). Interaction between common bean genotypes and environments in Pernambuco State: stability, environmental stratification and decomposition of interaction. Semina: Ciências Agrárias, 34(6), 2603-2614. DOI: http://dx.doi.org/10.5433/1679-0359.2013v34n6p2603
Pereira, T. C. V., Schmit, R., Haveroth, E. J., Melo, R. C., Coimbra, J. L. M., Guidolin, A. F., & Backes, R. L. (2016). Reflexo da interação genótipo x ambiente sobre o melhoramento genético de feijão. Ciência Rural, 46(3), 411-417. DOI: https://doi.org/10.1590/0103-8478cr20130998
Ramalho, M. A. P., Ferreira, D. F., & Oliveira, A. C. (2005). Experimentação em genética e melhoramento de plantas (3. ed.). Lavras, MG: UFLA.
Resende, M. D. V. (2007). SELEGEN-REML/BLUP: sistema estatístico e seleção genética computadorizada via modelos lineares mistos. Colombo, PR: Embrapa Florestas.
Ribeiro, E. H., Pereira, M. G., Coelho, K. S., & Freitas Júnior, S. P. (2009). Estimativas de parâmetros genéticos e seleção de linhagens endogâmicas recombinantes de feijoeiro comum (Phaseolus vulgaris L.). Revista Ceres, 56(5), 580-590.
Ribeiro, N. D., Domingues, L. S., & Zemolin, A. E. M. (2014). Avaliação dos componentes da produtividade de grãos em feijão de grãos especiais. Científica, 42(2), 178-186. DOI: http://dx.doi.org/10.15361/1984-5529.2014v42n2p178-186
Ribeiro, N. D., Mambrin, R. B., Storck, L., Prigol, M., & Nogueira, C. W. (2013). Combined selection for grain yield, cooking quality and minerals in the common bean. Revista Ciência Agronômica, 44(4), 869-877. DOI: https://doi.org/10.1590/S1806-66902013000400025
Silva, A. C. F., Melo, P. G. S., Melo, L. C., Bassinello, P. Z., & Pereira, H. S. (2013). Eficiência de métodos de melhoramento para teor de fibra e produtividade de grãos em progênies de feijoeiro comum. Bragantia, 72(4), 326-331. DOI: https://doi.org/10.1590/brag.2013.046
Sundaram, P., Samineni, S., Sajja, S. B., Roy, C., Singh, S. P., Joshi, P., & Gaur, P. M. (2019). Inheritance and relationships of flowering time and seed size in kabuli chickpea. Euphytica, 215(9), 144. DOI: https://doi.org/10.1007/s10681-019-2464-8
Vencovsky, R., & Barriga, P. (1992). Genética biométrica no fitomelhoramento. Ribeirão Preto, SP: Sociedade Brasileira de Genética.
Author notes
* Author for correspondence. E-mail: tfinatto@utfpr.edu.br