Meteorologia
Identification of Rainfall Homogenous Regions taking into account El Niño and La Niña and Rainfall Decrease in the state of Pará, Brazilian Amazon
Identificação de regiões homogêneas de chuvas considerando El Niño e La Niña e redução de chuvas no estado do Pará, Amazônia brasileira
Identification of Rainfall Homogenous Regions taking into account El Niño and La Niña and Rainfall Decrease in the state of Pará, Brazilian Amazon
Acta Scientiarum. Technology, vol. 38, no. 2, pp. 209-216, 2016
Universidade Estadual de Maringá
Received: 07 February 2015
Accepted: 17 November 2015
Abstract: The statistical analysis of rainfall data is a tool to identify homogenous clusters which reveal the behavior pattern of the rainfall regime in a given region. Current study identifies homogenous clusters in the state of Pará in the Amazon region, Brazil, with rainfall data for 413 monitored sites. A 31-year historical series was used (1960-1990) and the years with the occurrence of El Niño and La Niña were selected. Ward’s Hierarchical Agglomerative Clustering Method was employed with Euclidean distance used as a similarity measurement. Results generated homogenous rainfall clusters for the state of Pará. A similarity in rainfall rates for the homogenous clusters was constructed which made possible the need to identify and analyze the importance of taking into consideration El Niño and La Niña to determine homogenous rainfall regions. One may also identify regions with low rainfall rates, which may represent climate changes caused by change in land use, as in the southeastern region of Pará, where agriculture and ranching have been replacing the Amazon forest for the last forty years.
Keywords: climate change, cluster analysis, Ward method.
Resumo: A análise estatística dos dados de precipitação é uma ferramenta utilizada com a finalidade de facilitar a identificação de grupos homogêneos. Esses grupos revelam o padrão de comportamento do regime de chuvas em uma determinada região. O objetivo foi identificar regiões homogêneas do estado do Pará, utilizando dados de precipitação de 413 pontos de monitoramento de chuvas. Uma série histórica de 31 anos (1960-1990) foi utilizada, selecionando-se, dentres eles, anos com ocorrência do fenômeno El Niño e La Niña. O método de aglomeração hierárquica Ward foi utilizado neste estudo, com a distância euclidiana empregada como uma medida de semelhança. Os resultados possibilitaram a geração de grupos homogêneos de chuvas no estado do Pará. Com isso, foi possível encontrar uma semelhança nos valores de precipitação para os grupos homogêneos formados, tornando possível identificar e analisar a importância de se considerar o El Niño e La Niña na determinação de regiões homogêneas de precipitação. Com este estudo, pôde-se também identificar regiões com menores índices pluviométricos, o que pode representar mudanças climáticas causadas por diferenças no uso da terra, como na região sudeste do Pará, onde a agricultura e a pecuária substituem áreas de floresta ao longo dos últimos quarenta anos.
Palavras-chave: mudanças climáticas, análise de agrupamento, método de Ward.
Introduction
Climate variations that cause transformations on a global scale and, affect the regime of the principal meteorological parameters should be thoroughly understood. Rainfall rates in the Amazon region, including the state of Pará, Brazil, is a meteorological parameter that vary greatly in time and space and they are associated with the influence of different systems of meso-scale, synoptic scale
and large scale. Thus, the probable causes of an increase in climate variability are the extreme phases of the Southern Oscillation Index, mainly its negative (El Niño phenomenon) and positive (La Niña phenomenon) phases which are considered to be the main source of changes, producing from moderate to intense droughts in the northern and western Amazon, increasing the probability of forest fires, mainly in degraded forests areas, with heavy damage and danger to communities in the case of El Niño and intense flooding in the case of La Niña.
Another factor that should be taken into account to explain climate changes in the Amazon is the change in land use over the last 40 years, or rather, the replacement of the forest by pastureland and monocultures (Rego, Fernandes, Blanco, & Barp, 2013). This change in use has been mainly caused by extensive land occupation projects in the region. It may also be the cause of low rainfall levels since approximately half of the rain in the Amazon derives from the transpiration of the forest. In other words, 48.5% of total rainfall returns to the atmosphere by transpiration and 25.6% by evaporation (Salati, 1986). Salati and Nobre (1991) discussed the transformation of the Amazon region into pastureland and farmland and stated that this conversion would modify the microclimate of small disturbed areas if the size of those areas increased and climate would be disturbed even on a regional scale. If one were to increase the scale of those areas even more, climate changes would have a worldwide effect and would affect regions far away from the Amazon. Recent studies (Cook, Zeng, & Yoon, 2012; Saad, Rocha, Dias, & Rosolem, 2010) also point to the increase in deforested areas as a possible explanation for rainfall decrease in the Amazon.
According to Salati (2001), forest evapotranspiration in the Amazon amounts to 8.4 trillion m3 year-1 and causes a total rainfall of 15 million m3 year-1 in the region, exceeding by 50% the total rainfall from the Ocean. The percentage of recycled water in the region increases from east to west. When the water reaches the Andes, 88% has fallen at least twice as rain (Lettau, Lettau, & Molion, 1979). Recycled water is very important to the transport of Amazon water to other regions. Water transported to other regions may be calculated by the difference between incoming water (10 trillion m3 year-1) and water flowing at the mouth of the Amazon River (6.6 trillion m3 year-1). The difference (3.4 trillion m3 year-1) is transported to other places. Some part of it escapes the Amazon, over the Andes, on the northwestern corner of the region, Colombia. However, most of the water is redirected and exported south on the Andes. Much of it then moves to the east, providing water for rain in center-southern Brazil (Fearnside, 2006).
Due to lack of data monitoring, there is only a dearth of studies for the Amazon region on the rainfall regime. This problem is partly due to the size of the region which increases costs in the establishment and operation of the network, as well as the costs of in logistics and transport of technical teams for measurements, data collection, analysis of the behavior of rainfall and flows, all highly crucial for hydrological studies. One alternative for contributing towards solving this problem is to develop models for estimating rainfall rates in regions without rainfall gauge stations. An important requirement is the statistical analysis of rainfall data to identify homogenous regions and reveal the type of rainfall regime.
The term homogenous in hydrology is associated with regions that have hydrological similarity. In this case, similarity comprises physical, climatic, biological and geological factors and human activities and effects. The definition of homogenous is considered to be the stage of regionalization with the greatest degree of difficulty because it often requires a subjective judgment. The cluster analysis method has provided notable results among the methods that have been forwarded to determine homogeneity, (St.-Hilaire et al., 2003; Lyra, Garcia, Piedade, Sediyama, & Sentelhas, 2006; Yang et al. 2010; Cabrera, Romero, Such, García, & Porrúa, 2012; Lyra, Oliveira-Júnior, & Zeri, 2014). In fact, it has also been employed in current study. Region analysis or cluster analysis is a technique used to classify objects or study cases into relatively homogenous regions called clusters or agglomerations.
A synthesis of a regional rainfall analysis was presented in a study drawn up by St.-Hilaire et al. (2003), which consisted of choice of the homogenous regions, selection of the regional distribution functions and adjustment of parameters for these functions. Cluster analysis has been used to determine the various homogenous regions in Canada and the L-moments homogeneity test was applied to confirm the appropriateness of the sites within the homogenous region. Lyra, Garcia, Piedade, Sediyama, and Sentelhas (2006) determined homogenous regions based on the seasonality of monthly rainfall precipitation in the state of Táchira, Venezuela. Data were monthly precipitation rates from 25 climatological stations for a period between 24 and 62 years. The Ward method was applied to the cluster of months with similar monthly rainfall and resulted in 7 homogenous regions in the state. Modarres (2006) studied regional rainfall in Iran with cluster analysis by the Ward method and Euclidean distance as a measure of similarity to determine climatically homogenous regions. Results provided eight regions for the country. Raju and Kumar (2007) applied the cluster analysis (Fuzzy Cluster Analysis - FCA) and Kohonen-type (Kann) Artificial Neural Networks. These methods were used to classify 159 meteorological stations in homogenous regions in India. Eight parameters were considered for classifying regions: latitude, longitude, altitude, average temperature, humidity, wind velocity, hours of sunlight and solar radiation. Based on the Davies-Bouldin index, determined by the ratio between the internal dispersion of clusters and the distance between clusters, 14 homogenous regions were formed. The FCA approach presented better performance when compared to artificial neural networks. Gaál, Szolgay, Lapin, and Fasko (2009) used the regional frequency analysis method for rainfall based on the estimate of parameters of a regional distribution function using L-moments to delimit homogenous regions. The authors used a hybrid cluster technique comprising a subjective analysis of rainfall data from rainfall stations, based on physical and geomorphological characteristics, and an objective analysis (cluster analysis) using statistical tools for delimiting homogenous regions.
Yang et al. (2010) used cluster analysis to determine four variables of the 42 selected rainfall stations, to describe the region´s rainfall regime. The variables included latitude, longitude, altitude and average annual rainfall. Cabrera, Romero, Such, García, and Porrúa (2012) used the annual average of daily rainfall to group climatological stations into clusters by employing the k-means procedure and the principal component analysis with varimax rotation. The authors identified two clusters that occupy northwestern and north-central Mexico and another at the center of the territory. Clusters were compared with the results of previous studies and revealed that regions were invariant in time and space, regardless of the clustering method and the sampled stations. Lyra, Oliveira-Júnior, and Zeri (2014) identified spatial and temporal rainfall patterns for the northeastern Brazilian state of Alagoas by cluster analysis and related patterns to the weather systems over the region. The authors concluded that rainfall is not uniformly distributed in space and time on all regions; for example, two groups within the arid zone where more than 60% of the annual rainfall occurred within a period of 5 months, i.e., March to July.
No study has as yet been found in the literature that included a methodology for defining homogenous rainfall regions in the Amazon. Current paper contributes towards a methodology for defining pluviometrically homogenous regions in the Amazon, more specifically in the state of Pará, Brazil, taking into account the El Niño and La Niña climate anomalies.
Material and methods
The region studied in current paper is the state of Pará, northern region of Brazil and part of the Brazilian Amazon. Almost all the area is Humid Tropical Forest, except for parts where there are grassland formations on the Lower Trombetas River region and on the Marajó Archipelago (Figure 1). Located on the Equatorial Zone, Pará has a predominantly hot and humid equatorial climate, with constant winds and high rainfall rates. Rainfall rate is low between July and November. Annual average rate is 2,000 mm, ranging between 1,677 mm and 3,215 mm. No sharp changes in temperature occur in the state and annual averages range between 24 and 26ºC, with relative air humidity at approximately 80%. The other type of climate in the state of Pará is characterized by a superhumid regime. The Marajó Archipelago concentrates the wettest areas in the state, whereas the driest areas lie in the central-western municipalities of the Lower Amazon (Figure 1).
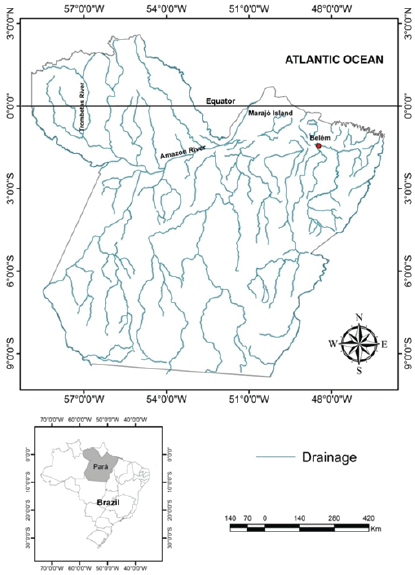
Figure 1
State of Pará and regions of the Lower Trombetas River to the northwest; Lower Amazon to the central-west; Marajó Archipelago to the northeast.
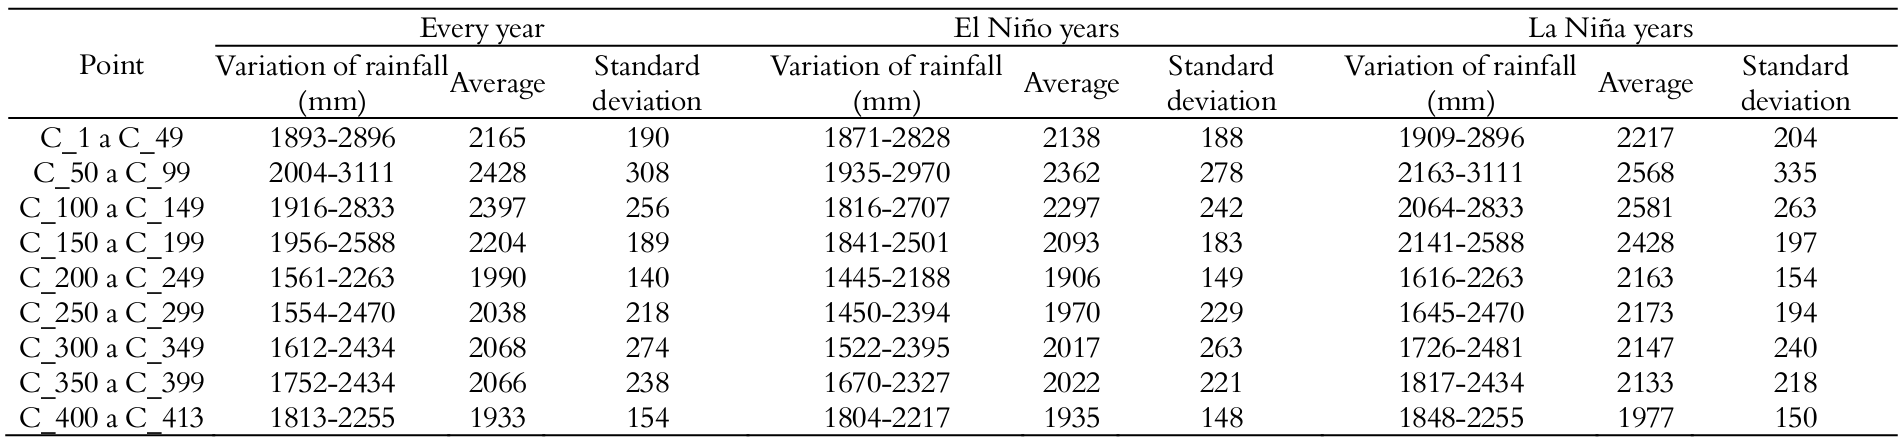
The Climate Research Center of the University of Delaware-Newark, USA, provided crude data which comprised geographic location and average monthly rainfall for the sites studied. Data were retrieved from 413 sampling sites for average monthly rainfall rates in the state of Pará, with a 31-year historical series (1960-1990). This sample was retrieved from the state of Pará, with 264 rainfall stations, although 63 are disabled. The 201 operating rainfall stations have no common periods of observed data; some have a short series and do not cover 10 years of observed data. The 413 sites are the result of a spaced grid of 0.5 x 0.5° latitude and longitude, with average monthly precipitation for each point being interpolated through the spherical version of Shepard algorithm (Webber & Willmott, 1998). Consequently, the average number of neighboring stations that influence each estimate is twenty. The period between 1960 and 1990 was selected in which the El Niño (totaling 19 years) and the La Niña (13 years) phenomena occurred, with information supplied at the INPE site (National Institute of Space Research in Brazil). Table 1 shows statistical data of the 413 rainfall sites in current study for a better comprehension of rainfall variability.
Four variables were selected to apply cluster analysis to data, namely, longitude, latitude, altitude and rainfall rate. Altitudes (Figure 2) were obtained from the study by Miranda (2005).
However, the variables had to be standardized since they were not in the same unit of measurement, before carrying out the cluster analysis. Standardization was performed so that the variables contributed equally towards similarity between individual units.
Cluster analysis aims at gathering individual units (such as objects, places or samples) into several groups according to a classification criterion so that there is homogeneity within a group and heterogeneity between groups. Thus, the technique was used to determine the division of the state of Pará into homogenous groups. In fact, the main objective was to group individual units (or variables) based on their characteristics.
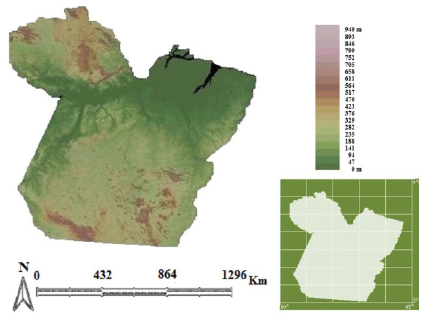
Figure 2
Terrain in the state of Pará. Source: Adapted from Miranda (2005).
The identification of groups of similar objects among the variables according to a criterion defined by the set of variables studied, the cluster analysis, may be expressed as follows:
Let X = {X1, X2, …, Xp} be a set of variables and e = {e1, e2, …, en} be a set of elements to be grouped; based on set X, one may determine participation by e in groups g1, such that: If er, es Î gi Þ er, es are similar.
The Euclidian distance, which is a common measure for grouping data, was employed to measure similarity between groups. This measure of distance is perfectly metrical since it is a straight line between two points. It is defined as the geometric distance between two objects i and i’, taken in a space with p dimensions, according Equation 1.
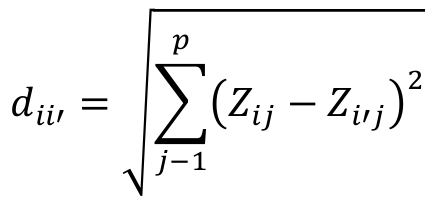 [1]
[1]where:
 - standardized variable of point i;
 – standardized variable of point i’.
The Ward method, employed for clustering, is a hierarchical method of data clustering, and forms groups in such a way that it always detects the smallest internal error between the vectors that make up each group and the average vector of the group. That is equivalent to pinpointing the lowest standard deviation between the data for each group. In the initial stage, the internal error is null for all groups, since each vector making up each group is the average vector of that group. In the same way, the standard deviation for each group is null. In the following stage, each possibility for agglomeration between the 2 by 2 groups is verified, and the cluster that causes the smallest increase in the internal error of the group is chosen. There are m x m verifications. Thus, for a data base with high m, these verifications require a major computing effort. One may note that there are i groups (i = number of iterations) for each iteration; however, since the number of elements belonging to each group increases, there is a larger number of calculations for the internal error of each group.
Further, , the value of component i of vector j of group k, must be taken into account to understand how the method operates. Thus, the average rate between the mk vectors of component i of group k is given by equation 2.
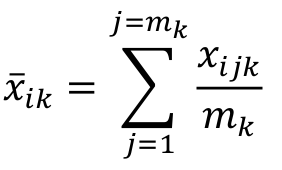 [2]
[2]where:
 - average rate between the mk vectors of component i of group k;
 - rate of component i of vector j of group k;
 - number of vectors of the database analyzed (number of verifications of group k).
Equation 3 determines the internal error between all rates of n components of mk vectors of a given group k with regard to the average rate of the group. Further, Equation 4 determines the total error of all k groups.
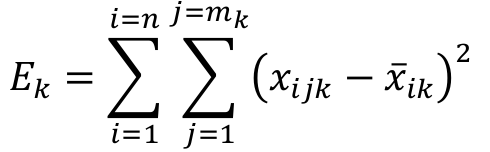 [3]
[3]
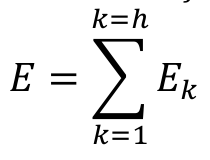 [4]
[4]where:
Ek = internal error of group k;
E = total error of all groups.
Increase in the internal error of group k, in case groups p and q are clustered, is shown by Equation 5.
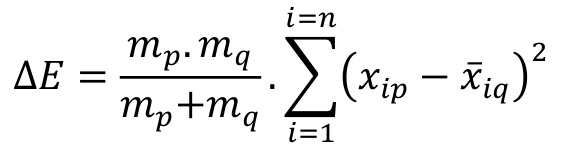 [5]
[5]where:
 = increase in internal error;
mp = number of vectors of group p;
mq = number of vectors of group q;
xip = rate of component i of group p;
 = average rate between mq vectors of component i of group q;
n = number of components in the vectors;
i = rate for components of the vectors;
j = rate for vectors of a group;
k = rate for groups within the database.
The Ward method, which governs functioning of the method and its convergence, employs Equation 5 for each stage. Cluster analysis was applied to the entire historical series (1960-1990) and to the historical series in which El Niño and La Niña occur, taking into consideration annual average rainfall. Statistical variables were calculated with Statistic 6.0® software developed by StatSoft. The state of Pará was thus divided into homogenous groups which were determined by transversal cuts in the dendrogram (graphic representation of the clusters), based on the mathematical criterion of inertia (distance between groups). The cutoff criterion adopted was the one in which the number n of groups formed results in the largest jump in inertia related to the preceding n + 1. The cutoff level in the dendrogram established in the study was based on an analysis of sensitivity in which the highest level of similarity was observed.
After selecting the groups formed with their respective data (longitude, latitude and rainfall rate), the Surf 9® program was employed to obtain the graphic representation of the homogenous regions in the state of Pará. A Microsoft Excel® spreadsheet was prepared with the data to be utilized in this program, with the respective rates for longitude, latitude and rainfall. Figure 3 summarizes the methodology in question.
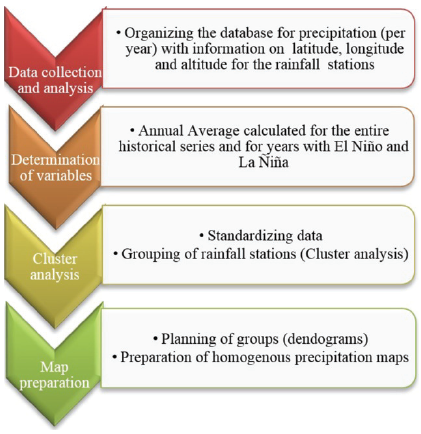
Figure 3
Flowchart of methodology.
Results and discussion
n current study, a cluster analysis was applied for annual rainfall averages, including 413 rainfall monitoring sites, considering a 31-year historical series, among which are enhanced the years in which the El Niño and La Niña phenomena occurred:
· All years: historical series covering the years 1960 to 1990;
· Years with El Niño: historical series utilizing data for 1963, 1965, 1966, 1968, 1969, 1970, 1972, 1973, 1976, 1977, 1978, 1979, 1980, 1982, 1983, 1986, 1987, 1988 and 1990;
· Years with La Niña: historical series utilizing data for 1964, 1965, 1970, 1971, 1973, 1974, 1975, 1976, 1983, 1984, 1985, 1988 and 1989;
A sensitivity analysis was performed for each historical series featuring results obtained from the cluster analysis and considering different connection distances. The groups were formed with varying connection distances. Three analyses were made and three different distances were obtained, obtaining different numbers of groups formed for each distance. Table 2 presents the results of sensitivity analyses. For cases studied in current paper, sensitivity analysis 2 was selected and 6 homogenous clusters were formed.
Figure 4 (a, b and c) shows dendrograms formed by cluster analysis of average annual rainfall. The x-axis represents the dendrogram of the sampling points grouped according to their similarity measured for bond distances represented in the y-axis. The 413 sampling sites in the state of Pará were retrieved from the website of the Climatic Research Center, Department of Geography, University of Delaware, Newark, USA.
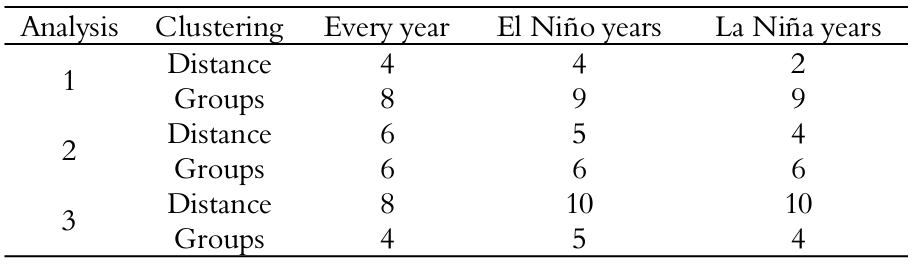
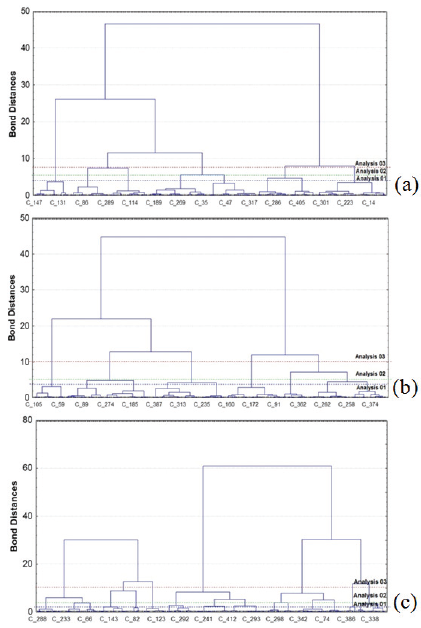
Figure 4
Dendrograms. Sampling sites grouped according to their similarity: a) every year – average annual; b) El Niño years – average annual; and c) La Niña years – average annual.
Figure 5 (a, b and c) shows clusters for annual averages, considering 31 years, between 1960 and 1990 (complete sample); years for El Niño and La Niña phenomena.
The highest rainfall index occurred in the Northeast of the state, or rather, in group F, with averages varying between 2638 mm year-1 for El Niño (Figure 5b) and 2906 mm year-1 for La Niña (Figure 5c). Averages are different from the average 2726 mm year-1, if one considers all the sample´s years (Figure 5a). In fact, it is an intermediate rate and confirms the more humid tendency for La Niña years and drier trend for El Niño years. The study developed by Ishihara, Fernandes, Duarte, Duarte, Ponte, and Loureiro (2014), which considered data from the 1978 - 2007 time series of rainfall, reveals
that average annual rainfall to the northeast of Pará ranges between 2400 and 2800 mm year-1. The above confirms rates in current study when the full time series (1960-1990) is taken into account.
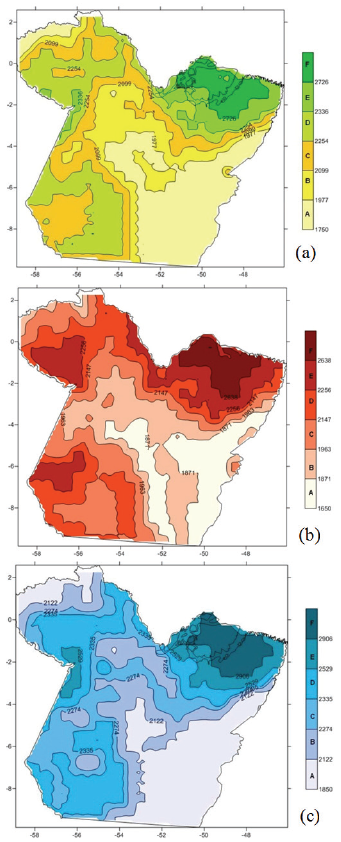
Figure 5
Homogenous rainfall regions in the state of Pará, with rainfall iso-surfaces in mm. a) Every year - average annual rainfall; b) El Niño years - average annual rainfall; and c) La Niña years - average annual rainfall.
The southwest region and a small region in the northeast of the state present lower rainfall rates for all cases (complete series for El Niño and La Niña), represented by group A, with averages varying between 1650 mm year-1 for El Niño (Figure 5b) and 1850 mm year-1 for La Niña (Figure 5c). In this case, the average rate for the complete sample was exactly the average rates for El Niño and La Niña phenomena, i.e., 1750 mm year-1. This confirms discussion in the previous paragraph. In the case of the southeast region, a possible explanation for lower rainfall rates may be linked to land use changes underway in the region. In fact, there were once larger areas of forestland which during the last forty years have been replaced by agriculture and ranching. The annual rainfall averages for other regions in the state of Pará in the cases analyzed resulted in intermediate rates to those presented and discussed above. Ishihara et al. (2014) also showed that the southeast of the state of Pará has an average rainfall rate between 1700 and 1900 mm, or rather, a region with the lowest rainfall in the state index, as presented in current study.
Figure 5 demonstrates groups (Group F and E) with more rainfall rates, or rather, those located in regions with low altitudes, or rather, those close to rivers. The regions with low rainfall rates (Regions A and B) are located in the south state, with higher altitudes and low humidity.
Conclusion
Six homogenous groups were identified by annual averages taking into consideration El Niño and La Niña years and the complete series. The method proposed by Ward determined a good spatial representation of the homogenous regions characterized by the groups. The annual rainfall averages with only El Niño and La Niña years are different from the average if all the years in the sample are taken into account. The average is an intermediate rate between averages for El Niño and La Niña years, confirming a wetter and a drier tendency respectively for La Niña and El Niño years. Reduced rainfall in southeast Pará was confirmed, corroborating the available literature.
Acknowledgements
The authors would like to thank the Coordenação de Aperfeiçoamento de Nível Superior (Capes) for financially supporting current research work with a PhD scholarship. Thanks are also due to the Conselho Nacional de Desenvolvimento Científico e Tecnológico (CNPq) for funding current research by an undergraduate scholarship and Productivity Grant no. 304175/2012-9. The authors would like to thank the Office for Research (Propesp) and the Foundation for Research Development (Fadesp) of the Federal University of Pará (UFPA) for their Grant PAPQ 2013.
References
Cabrera, J. L. B., Romero, E. A., Such, V. Z., García, C. G., & Porrúa, F. E. (2012). Cluster analysis for validated climatology stations using precipitation in Mexico. Atmósfera, 25(4), 339-354.
Cook, B., Zeng, N., & Yoon, J.-H. (2012). Will Amazonia dry out? Magnitude and causes of change from IPCC climate model projections. Earth Interactions, 16(3), 1-27.
Fearnside, P. M. (2006). Desmatamento na Amazônia: dinâmica, impactos e controle. Acta Amazonica, 36(3), 395-400.
Gaál, L., Szolgay, J., Lapin, M., & Fasko, P. (2009). Hybrid Approach to delineation of Homogeneous Regions for regional precipitation frequency analysis. Journal of Hydrology and Hydromechanics, 57(4), 226-249.
Ishihara, J. H., Fernandes, L. L., Duarte, A. A. A. M., Duarte, A. R. C. L. M., Ponte, M. X., & Loureiro, G. E. (2014). Quantitative and spatial assessment of precipitation in the Brazilian Amazon (Legal Amazon) - (1978 to 2007). Revista Brasileira de Recursos Hídricos, 19(1), 29-39.
Lettau, H., Lettau, K., & Molion, L. C. B. (1979). Amazonia’s hydrologic cycle and the role of atmospheric recycling in assessing deforestation effects. Monthly Weather Review, 107(3), 227-238.
Lyra, G. B., Garcia, B. I. L., Piedade, S. M. S., Sediyama, G. C., & Sentelhas, P. C. (2006). Homogeneous regions and probability density functions of pluvial precipitation in Táchira State, Venezuela (in portuguese). Pesquisa Agropecuária Brasileira, 41(2), 205-215.
Lyra, G. B., Oliveira-Júnior, J. F., & Zeri, M. (2014). Cluster analysis applied to the spatial and temporal variability of monthly rainfall in Alagoas state, Northeast of Brazil. International Journal of Climatology, 34(13), 3546-3558.
Miranda, E. E. (2005). Brazil in relief (in portuguese). Campinas, SP: Embrapa Monitoramento por Satélite. Recuperado de http://www.relevobr.cnpm.embrapa.br
Modarres, R. (2006). Regional precipitation climates of Iran. Journal of Hydrology, 45(1), 13-27.
Raju, K. S., & Kumar, D. N. (2007). Classification of Indian meteorological stations using cluster and fuzzy cluster analysis, and Kohonen artificial neural networks. Nord Hydrology, 38(3), 303-314.
Rego, A. G., Fernandes, L. L.; Blanco, C. J. C., & Barp, A. R. B. (2013). Evaluation of sustainability in the use of water within the Amazon deforestation area: a case study in Rondon do Pará, Pará State, Brazil. Acta Scientiarum, 35(2), 237-245.
Saad, S. I., Rocha, H. R., Dias, M. A. F. S., & Rosolem, R. (2010). Can the deforestation breeze change the rainfall in Amazonia? A case study for the br-163 highway region. Earth Interactions, 14(18), 1-25.
Salati, E. (1986). The climatology and hydrology of Amazonia. In G. T. Prance, & T. E. Lovejoy (Eds.), Amazonia (p. 18-48). Oxford, UK: Pergamon Press.
Salati, E. (2001). Mudanças climáticas e o ciclo hidrológico na Amazônia. In V. Fleischresser (Ed.), Causas e dinâmica do desmatamento na Amazônia (p. 153-172). Brasília, DF: Ministério do Meio Ambiente.
Salati, E., & Nobre, C. A. (1991) Possible climatic impacts of tropical deforestation. Climatic Change, 19(1), 177-196.
St.-Hilaire, A., Ouarda, T. B. M. J., Lachance, M., Bobée, B., Barbet, M., & Bruneau, P. (2003). Regionalization of precipitation: a literature review of recent developments (in french). Revue des Sciences de L'eau, 16(1), 27-54.
Webber, S. R., & Willmott, C. J. (1998). South American precipitation: 1960-1990 gridded monthly time series (Version 1.02). Newark, DE: University of Delaware.
Yang, T., Shao, Q., Hao, Z., Chen, X., Zhang, Z., Xu, C., & Sun, L. (2010). Regional frequency analysis and spatio-temporal pattern characterization of rainfall extremes in the Pearl River Basin, China. Journal of Hydrology, 380(3-4), 386-405.
Author notes
blanco@ufpa.br