Engenharia Mecânica
A methodology for analysis of defective pipeline by introducing stress concentration factor into beam-pipe finite element formulation
Uma metodologia de análise de duto com defeito através da introdução de fator de concentração de tensões na formulação de elementos finitos de viga-duto
A methodology for analysis of defective pipeline by introducing stress concentration factor into beam-pipe finite element formulation
Acta Scientiarum. Technology, vol. 38, no. 3, pp. 313-320, 2016
Universidade Estadual de Maringá
Received: 29 May 2015
Accepted: 09 November 2015
Abstract: This work proposes a methodology for defective pipe elastoplastic analysis using the Euler Bernoulli beam-pipe element formulation. The virtual work equation is modified to incorporate the stress concentration factor in beam-pipe element formulation. The stress concentration factor is evaluated a priori by a 2D or 3D finite element model according to the defect profile. In this work, a semicircular defect and a rectangular defect are considered. The stress concentration factor is inserted into the beam-pipe element elastoplastic formulation, and several applications are presented to show the applicability of the proposed method.
Keywords: Euler-Bernoulli beam element, stress concentration factor, virtual work equation, elastoplastic analysis.
Resumo: Este trabalho propôs uma metodologia de análise elastoplástica em duto com defeito, utilizando formulação do elemento viga-duto Euler-Bernoulli. A equação do trabalho virtual é modificada para incorporar na formulação do elemento viga-duto o fator de concentração de tensões, que é determinada previamente pelo modelo de elementos finitos 2D ou 3D conforme o perfil do defeito. Neste trabalho, defeito semicircular e defeito retangular são considerados. O fator de concentração de tensões é inserido na formulação elastoplástica do elemento viga-duto e diversas aplicações são apresentadas neste trabalho para mostrar a aplicabilidade do método proposto.
Palavras-chave: Elemento da viga Euler-Bernoulli, fator de concentração de tensões, equação do trabalho virtual, análise elastoplástica.
Introduction
Steel pipelines are widely used for conveying natural gas and crude oil, and their derivatives. Steel is used due to its high capacity of transportation and low manufacturing cost compared to other materials. The pipeline is typically constructed from carbon steel, because of its high mechanical strength, and also because it is cheaper than other materials. Nevertheless, depending on the derivative conveyed or the condition of the soil surrounding the pipeline, carbon steel can be subjected to corrosion that generates surface defects and reduces pipe wall thickness. Consequently, the mechanical strength of the pipe is compromised. Additionally, other defects in the pipe could be created during installation. In such a situation, the conveying pressure should be reduced in order to avoid rupture of the pipeline in the region of the defects; however, this could affect the conveying capacity. Another solution could be the interruption of operation to repair the defective part. Both cases involve financial implications. Thus, it is necessary to develop a methodology to assess the effect of limiting the operating pressure in defective pipes with more accuracy, without being too time consuming. An efficient way for such an assessment is the use of semi-empirical methods such as B31G (American Society of Mechanical Engineers [ASME], 1991), or numerical methods such as finite element method.
The defect creates irregularities on the surface and introduces, at the vicinity of defect, the effect of stress concentration, which increases the stress surrounding the defect region to a higher stress level. A 3D finite element model can be used to analyze the stress-concentration effect with accuracy when a proper mesh refinement is employed (Kim, Shim, Huh, & Kim, 2002; Choi, Goo, Kim, Kim, & Kim, 2003; Kim & Son, 2004). However, such a model only considers local effects, and cannot evaluate the effect of local stress concentrations in the global behavior of the pipeline. The solution of the 3D finite element models of the whole pipeline system needs long processing time and high computational effort. Therefore, the present work proposes a methodology for the analysis of defective pipelines. This methodology includes a finite element global static elastoplastic analysis in a pipeline with the Von Mises model for isotropic material hardening. The equilibrium equation for elastoplastic analysis is solved by the total Lagrangian formulation. Simultaneously, it incorporates a stress concentration factor into a three-node beam-pipe element formulation. This methodology unifies the global analysis of the pipeline, simulated by the Euler Bernoulli beam-pipe model by means of beam elements, with the local analysis of the defective pipe. This is achieved by introducing a stress concentration factor, evaluated a priori by 2D or 3D finite element models. A computational code named APC3D was developed in Fortran by the author of this work to implement the proposed methodology.
A brief literature review is presented concerning a stress concentration study in defective pipes with a finite element method developed for pipeline elastoplastic analysis.
Several studies have been conducted for finite element modeling of defective pipes. The defect could have different geometries, such as those formed by corrosion pits, located in the longitudinal direction. The effects of the interaction of defects on the pipe-wall strength were investigated (Chouchaoui & Pick, 1996; Kim et al., 2002). Some studies have studied a numerical method based on an equilibrium equation (Cronin & Pick, 2002) to determine the burst pressure. The method called weighted depth difference deals with irregular profiles on the corrosion surface. It further investigates the effects of pit interaction from adjacent corrosion. The effect of stress concentration in the defect region also plays an important role in the evaluation of the residual strength of the defective pipe. Several finite element models were developed to calculate the stress concentration factor with different defect geometries (Kim & Son, 2004). Some studies focused on pipe and pressure vessel global-local analysis (Staat, 2005). Crack-tip opening displacement has been adopted as a failure criterion. The results of the analysis were compared with the reported results. A beam element for elastoplastic analysis in a pipe without defects has also been developed (Nowzartash & Mohareb, 2004). This element was based on beam element formulation with two nodes, each with six degrees of freedom. This element is capable of calculating loads such as axial force, shear load, torsion, bending, and internal and external pressures. The elastic-perfect-plastic model was included in the finite element beam formulation. A methodology was presented for a local failure analysis of a defective pipe, with the defect represented by a semi-elliptic geometry (Adib, Jallouf, Schmitt, Carmasol, & Pluvinage, 2007). The methodology includes the stress concentration effect at the tip of the defect, and a further probabilistic analysis was presented. Another analysis has presented a local fracture criterion of a pipe with notch-type defects based on 3D finite element formulation (Oh, Kim, Baek, Kim, & Kim, 2007). Recently, a number of enriched finite element formulations such as the extended finite element method have been applied to analyze crack propagation in pipes (Zhang, Ye, Liang, Zhang, & Zhi, 2014). A review of the literature shows that the majority of studies concentrated on local failure analysis of defective pipes, while a few studies focused on developing a methodology for the global-local analysis of defective pipes.
Statement of problem
In this section, a brief presentation will be made on the equilibrium equation of a pipe and on the finite element model employed to simulate the global behavior of a pipeline. The formulation presented in this section will be modified to incorporate stress concentration factors as a methodology of global-local analysis.
The element used to simulate pipeline in this work is a three-node isoparametric element, with a Hermitian shape function (Dhatt, Touzot, & Cantin, 1985; Bathe, 1996). Each node has six degrees of freedom. The stiffness matrix is evaluated by numerical integration. There are seven Gauss integration points along the element. The element model can be seen in Figure 1.
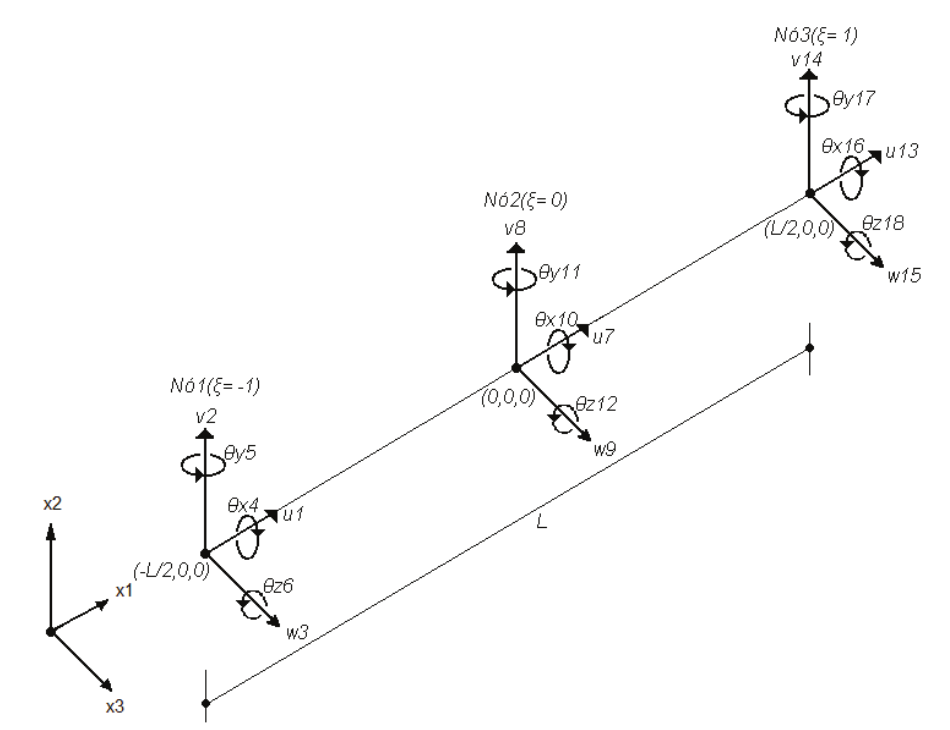
Figure 1
Spatial three-node beam element
According to Bathe (1996), the equation of virtual displacement in the Total Lagrangian Formulation is given by Equation 1:
 (1)
(1)where:
The term on the left represents internal virtual work, and the term on the right represents external virtual work. The external virtual work is given by Equation 2:
 (2)
(2)where:
where:
 : Components of force applied externally per unit volume at time t+Δt;
 : Components of traction applied on the external surface per unit surface at time t+Δt;
 : Surface at time t+Δt, where the external surface was subjected to external traction;
 =
=  calculated on surface.
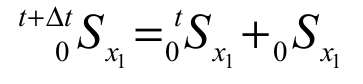
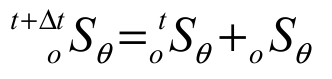
In Equation 1, the stress and strain increments are given, respectively, by Equations 3 and 4:
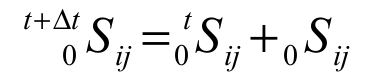 (3)
(3)
 (4)
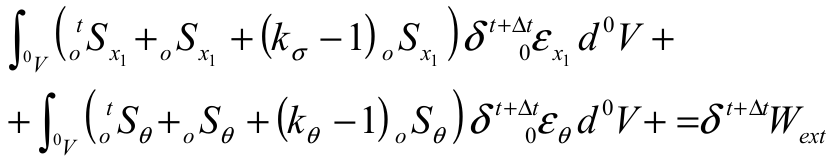
(4)The virtual work can be calculated considering the components of stress and strain of a pipe-beam element, according to Equation 5 given by:
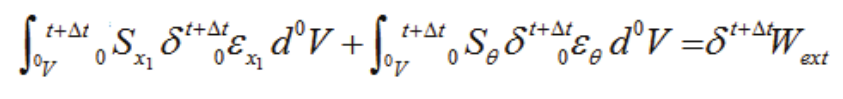 (5)
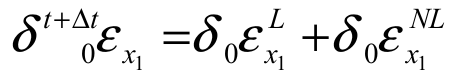
(5)In Equation 5, the first two terms represent the virtual work of stress on the pipe, axial and tangential, respectively. The term on the right hand side represents the external virtual work generated by the load application. The equations for stress and strain increments for a pipe in the longitudinal and tangential directions are given by Equations 6at9:
 (6)
(6)
 (7)
(7)
 (8)
(8)
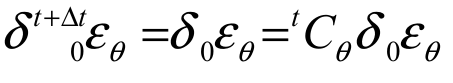 (9)
(9)The strain in the longitudinal direction is calculated by the sum of the linear and non-linear strain.
In the Von Mises model of isotropic material hardening, the volumetric plastic strain is zero. Therefore, it is appropriate to express the general relation of stress-strain at time t+Δt as Equation 10 (Bathe, 1996):
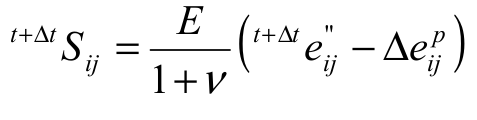 (10)
(10)where:
 (11)
(11)In the indicial form, Equation 10 is Equation 12:
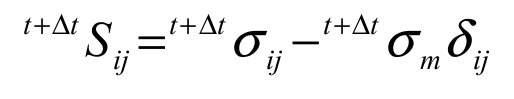 (12)
(12)where:
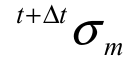 is the mean stress or volumetric stress, expressed as Equation 13:
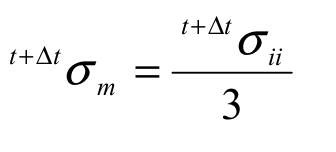 (13)
(13)From the Von Mises model, the yield condition at time t+Δt is expressed as Equation 14:
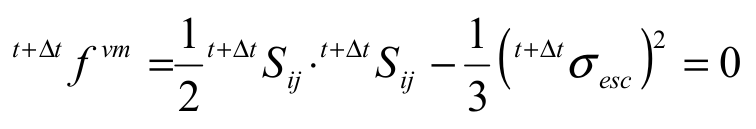 (14)
(14)where:
 is the yield stress at time t+Δt. The solution of Equation 14 is determined by using the Newton-Raphson algorithm (Bathe, 1996), considering that the iterative procedure is carried out at each numerical integration point. The energy norm is adopted as the criterion of convergence.
A methodology for stress compensation in virtual work equation
In order to incorporate a stress concentration factor (SCF) into beam-pipe element formulation, this work proposes a methodology to introduce an SCF into the virtual work equation. Consider that the SCF is obtained from a pipe in a 2D or 3D finite element model, subject to tension or to internal pressure loading.
To introduce the effects of an SCF into the virtual work equation, consider that the multiplication of this factor with incremental stress is shown by Equations 15 and 16. Observe that when there is no effect of defects in the pipe, the multiplier will assume unity as its value. If this occurs, Equations 15 and 16 return to Equation 6 and 7, which are the incremental stress equations presented in the previous section, according Equation 15 and 16.
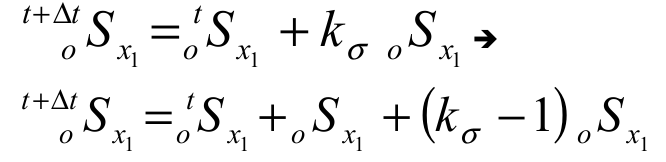 (15)
(15)
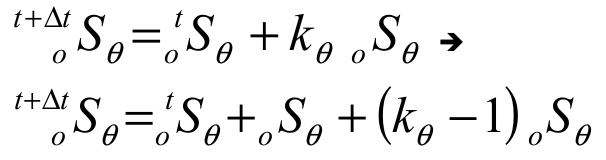 (16)
(16)Term
 represents the stress
concentration factor when only longitudinal stress is generated, and
represents the stress
concentration factor when only longitudinal stress is generated, and  when only tangential stress is generated. Introducing Equations
15 and 16 into Equation 5 results in the following Equation 17:
when only tangential stress is generated. Introducing Equations
15 and 16 into Equation 5 results in the following Equation 17:
 (17)
(17)Nevertheless, when the SCF is introduced into Equation 5, the global condition of equilibrium will be affected and the iterative procedure of Newton-Raphson algorithm will not converge. Consider the condition shown in Figure 2. The equilibrium state is achieved when the sum of the internal forces is zero. In this work, the energy convergence criterion is adopted, and the internal energy of a solid must be the same as the external energy produced by the external force, according Equation 18 and 19.
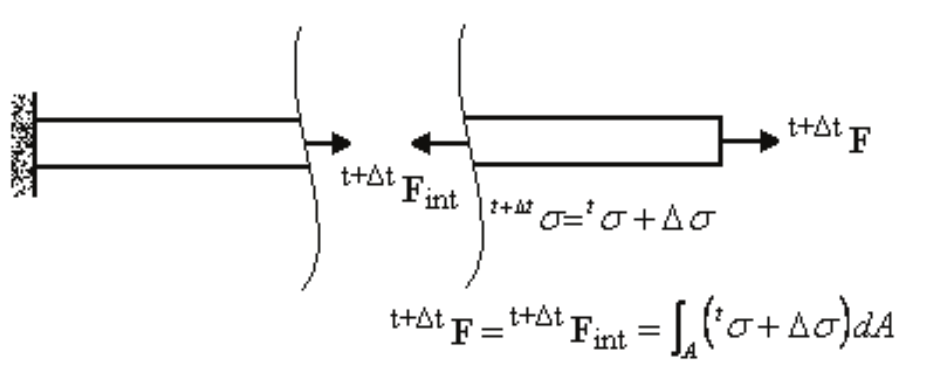
Figure 2
State of equilibrium of a beam without defect
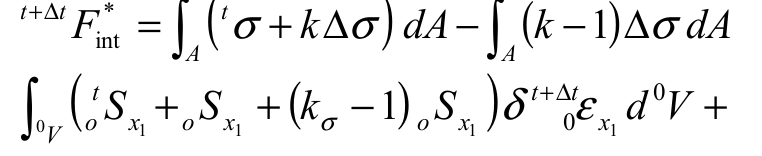 (18)
(18)
 (19)
(19)When introducing an SCF to the virtual work equation by multiplying the stress increments, the condition of equilibrium of Equation 5 will not be satisfied. The reason for this is that the SCF introduces an overbalance into the equation equilibrium evaluation. This overbalance is evaluated by multiplying the stress increment by the factor (k-1), as shown in Figure 3. In order to attain the equilibrium condition in the virtual work equation, and simultaneously, attain the convergence criterion, the overbalance should be eliminated. Thus, the internal force is calculated by Equation 18, and the equation of virtual work (Equation 5) cannot be simply evaluated by introducing Equations 15 and 16. However, it is necessary to sum the external energy part, the overbalance energy produced by SCF, as shown by Equation 19. It is simply summing an overbalance value on the left hand side of Equation 5, and simultaneously, summing the same overbalance value on the right hand side. In other words, mathematically, there are no additions to Equation 5. Thus, the criterion of equilibrium continues to be attained.
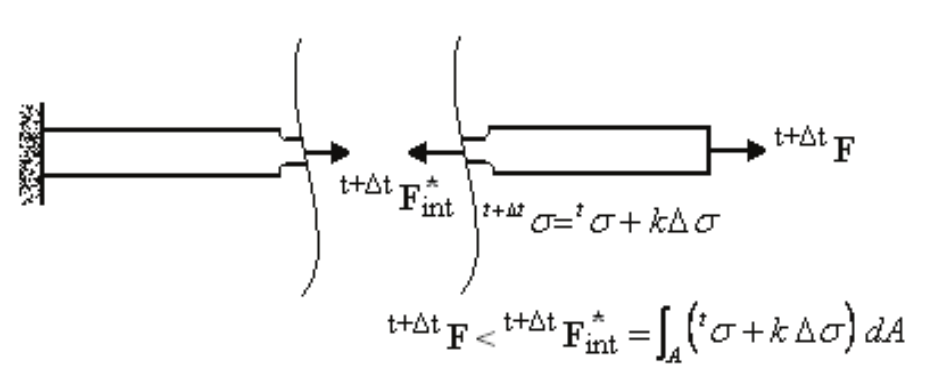
Figure 3
State of equilibrium not satisfied in the defective beam
Applications
In this section, a number of applications of the stress compensation method are presented. A computational code, named APC3D, is developed in Fortran to carry out the numerical applications. In order to validate the proposed methodology, the first case presents a study on pipe with a defect in a semicircular profile, subjected to internal pressure and tension in the free end. The second case shows an analysis in a pipe with defect in a semicircular profile subjected to bending. The last case is a pipe with a rectangular defect subjected to internal pressure. The results obtained by APC3D of these three cases are compared by commercial software.
The material adopted for all cases in this study is cold-worked steel. As the material in this analysis is considered to exhibit bilinear isotropic hardening behavior, the Newton-Raphson algorithm is adopted. The yield surface expansion is controlled by the Von Mises equation. The mechanical properties of the material are  ,
,  and
and  .
.
Pipe with semicircular defect subjected to internal pressure and tension
Consider the pipe model shown in Figure 4. A defect with a semicircular profile is located in the middle of pipe and has a 2.5 mm as radius; The analysis is divided into two cases. In the first case, only tension is applied at the end of model. In the second case, only internal pressure is applied.
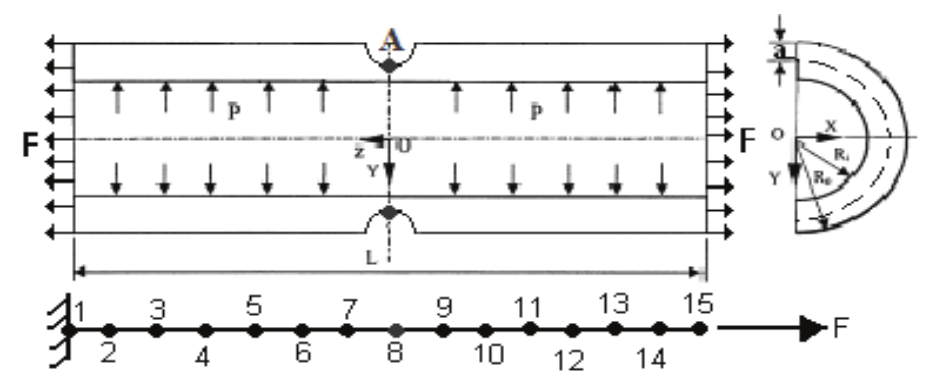
The curve of SCF is obtained from the computational model constituted by axisymmetric elements via ANSYS, Figure 5, and it is determined in the longitudinal direction in the first case, and in the tangential direction in the second case. The Von Mises stress is calculated in point A, Figures 4 and 5, which is located in the root of the defect. The curve of SCF is obtained as a ratio of Von Mises stress, via ANSYS, and nominal stress. The mesh adopted by APC3D with a beam-pipe element is shown in Figure 4, and it is the same for the tension and internal pressure cases.
In the first case, the results obtained by APC3D and by ANSYS are compared, as can be seen in Figure 6. Observe that in the linear regime, the method of stress compensation presents the same results as that obtained by the axisymmetric element model. The stress evaluated by APC3D is the same, or almost coincident, with the stress obtained by ANSYS in the linear regime. However, when the material yielding begins, there are differences between the results shown by APC3D and ANSYS. These differences are expected due to the differences in element formulation adopted in this analysis, considering that the present methodology uses a three-node beam pipe element, and ANSYS uses an axisymmetric element.
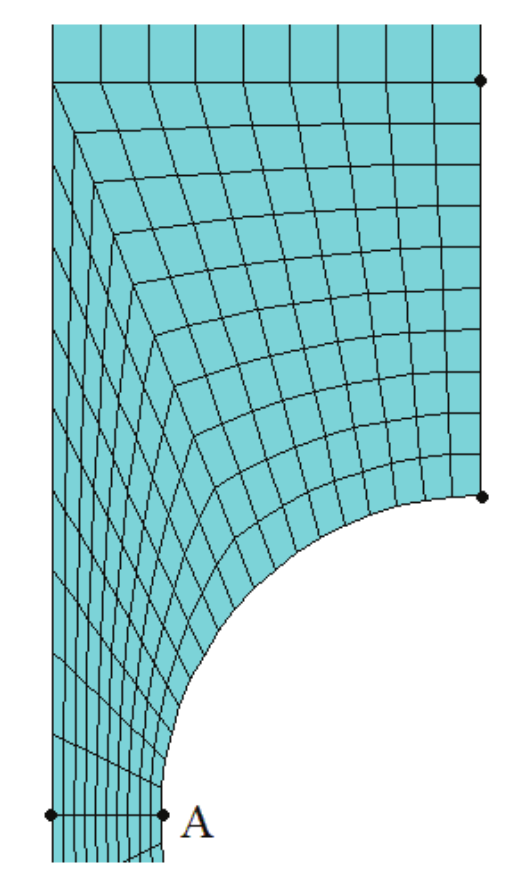
Figure 5
Mesh with axisymmetric element using commercial software
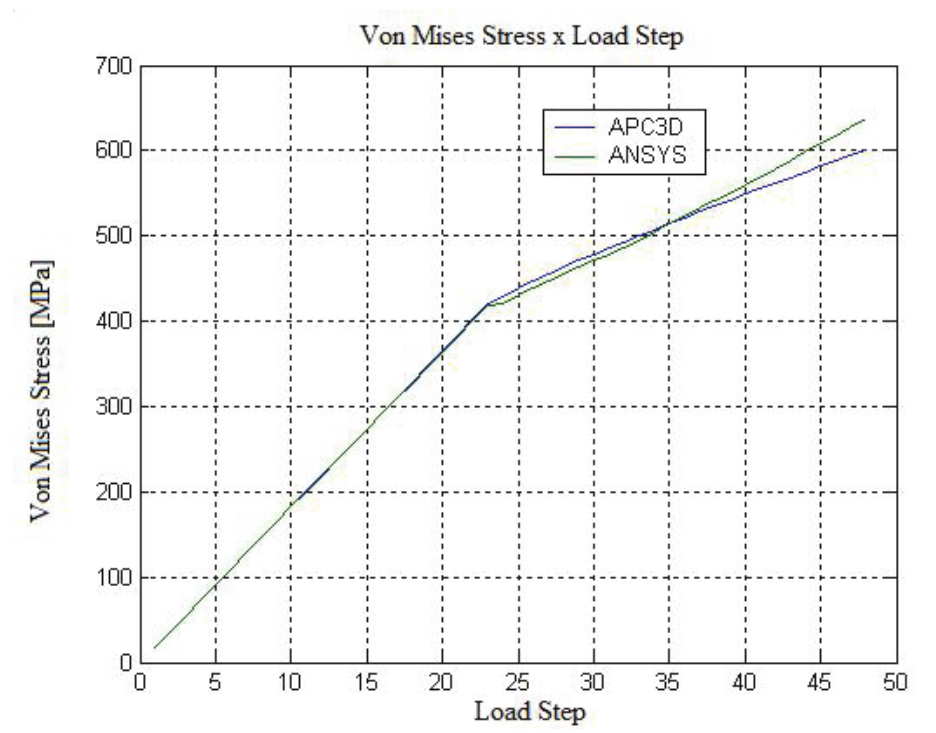
Figure 6
Calculated stress curves obtained from APC3D and ANSYS
In addition to the analysis of Von Mises stress, the displacement is calculated in Point A. In contrast to the stress, the displacement calculation conducted by APC3D does not involve an SCF, even in the linear and plastic regimes. The results obtained by APC3D and ANSYS are shown in Figure 7. The magnitude of displacement is similar for APC3D and ANSYS, which shows the applicability of the proposed methodology.
The same methodology of analysis is applied to the same defective pipe subjected to internal pressure in the second case of analysis. In order to show the applicability of the proposed method, the results obtained from ANSYS are compared to results obtained from APC3D, considering the effects of a tangential SCF, and without the effects of a tangential SCF. Observe that the results provided by the APC3D without tangential SCF curve are significantly different to those from ANSYS, shown in Figure 8. On the other hand, the APC3D with tangential SCF curve provides results similar to those from ANSYS, with an axisymmetric element model.
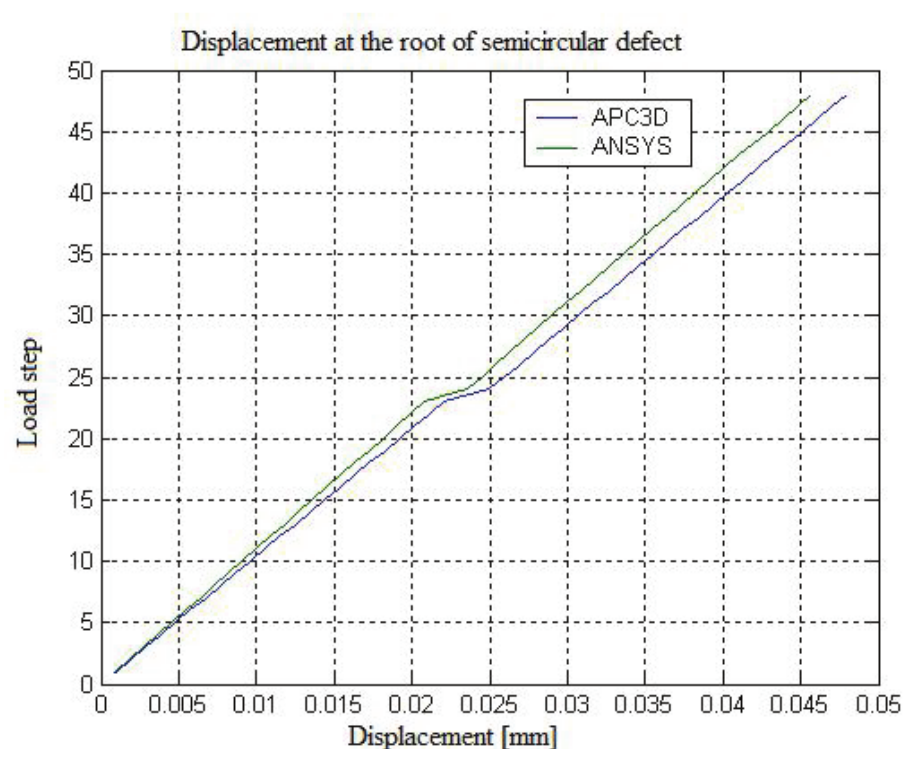
Figure 7
Comparison of displacement curve obtained from APC3D and ANSYS
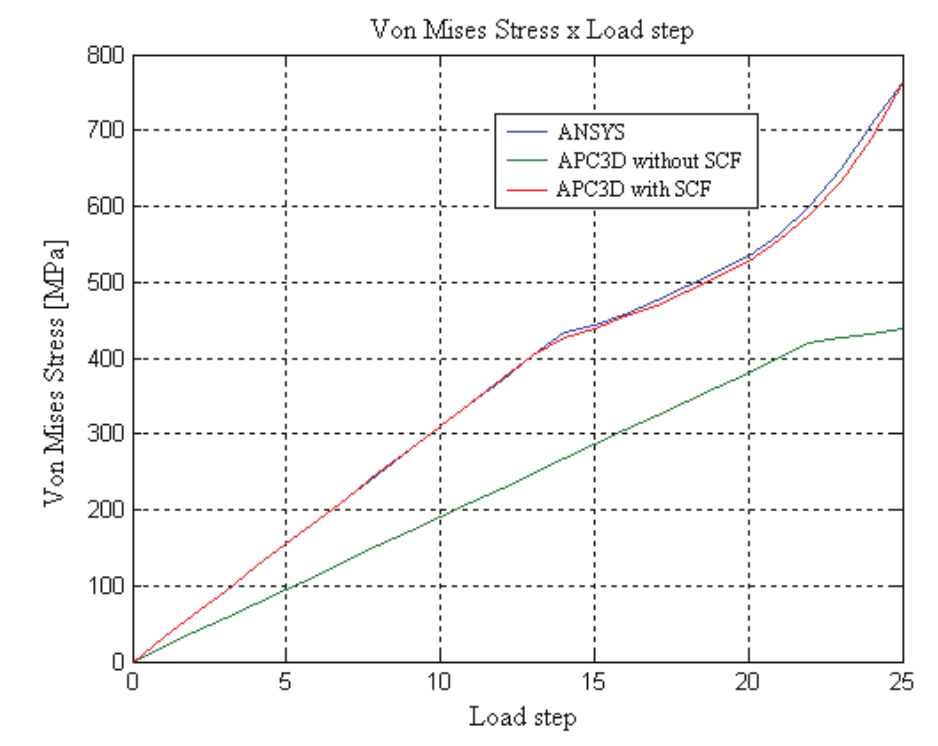
Figure 8
Von Mises stress comparison; the values are obtained at the root of defect by APC3D without SCF and with SCF, and ANSYS; pipe subjected to internal pressure
From the observation of results, it is possible to insert an SCF into the beam-pipe element formulation without compromising the applicability of the original element formulation when using the proposed method. This provides conditions to reduce the element model constituted by a 2D or 3D element in a model constituted by a unidirectional element. Consequently, this reduces the computational time processing.
Nevertheless, the proposed methodology presents several limitations, because an SCF is obtained from the results of a 2D or 3D finite element model. Therefore, the mesh refinement of these models plays an important role in the SCF calculation. Furthermore, the curve of the SCF is obtained by interpolation of the Von Mises stress versus the loading step, which is another source of numerical error. The manner in which the interpolation is conducted can adversely affect the accuracy of the analysis. These two aspects constitute the source of numerical error, and this error could be accumulated during an iterative procedure, such as Newton-Raphson.
The solution of the virtual work equation has been carried out based on the displacement method. Once the displacement is obtained, the strain can be evaluated, followed by the stress increment. The proposed methodology could determine with reasonable accuracy the stress with a concentration factor in the beam-pipe element model. However, the strain and displacement are not calculated with the same accuracy. Such difficulty in obtaining accurate results is based on the difficulty in determining the strain and displacement from the stress incremented by the SCF, in other words, the inverse process. This limitation is inherent to the finite element formulation adopted in this work.
Analysis of pipe with semicircular defect subjected to bending
This example presents an analysis of a pipe with a semicircular defect subjected to a loading applied at the end, simulating the situation of a clamped beam. Until now, the proposed method has been applied only to cases with tension and internal pressure. However, it has not been applied to the analysis when the pipe is subjected to moment. The distribution of the stress is axisymmetric to the neutral line.
Consider a pipe with a semicircular defect, and the geometrical properties shown in Figure 9; The semicircular defect has a radius of 2.5 mm and is situated in the middle of pipe. A load with magnitude 38 kN is applied at the end of pipe in the vertical direction, with the other end totally clamped, as a clamped beam. In ANSYS, only half a model has been considered, constituted by 3D elements, in order to reduce the computational effort, as shown in Figure 10. The restraints are applied according to symmetric considerations. The same situation was simulated with 11 beam-pipe elements in APC3D, in which the semicircular defect is represented by one element.
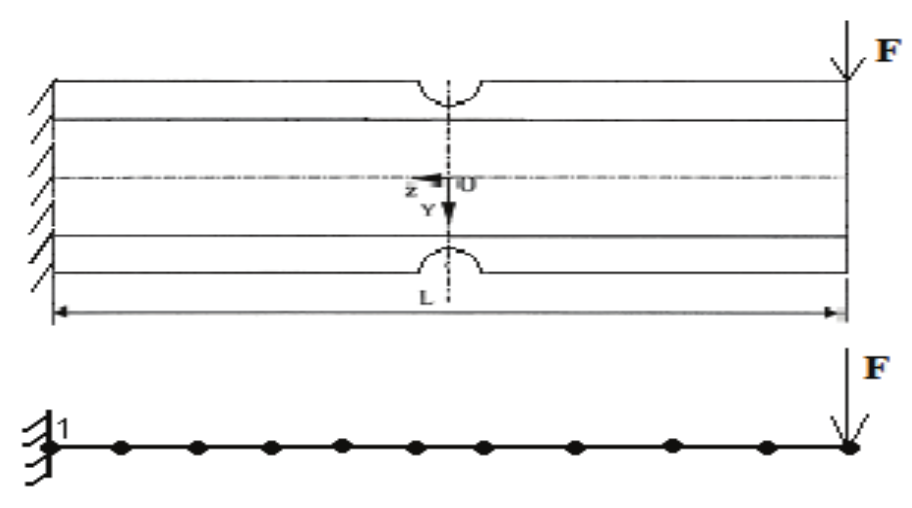
Figure 9
Schematic representation of defective pipe, and the mesh adopted by APC3D. Pipe subjected to moment
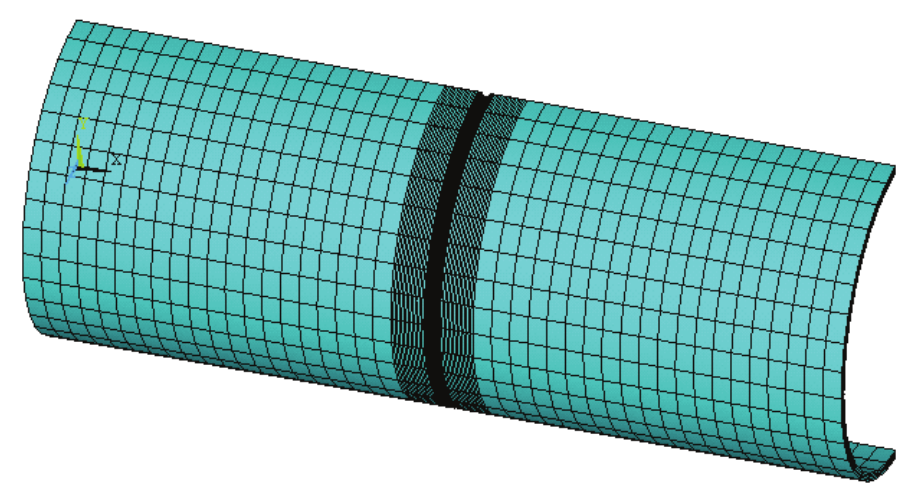
Figure 10
Mesh with brick element using commercial software
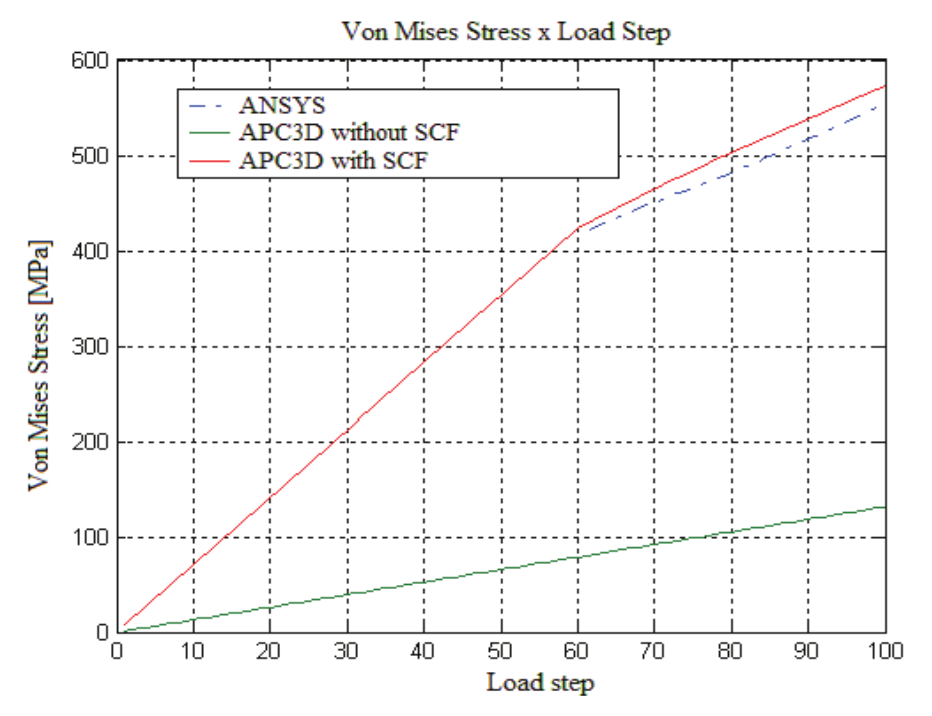
Figure 11
Von Mises stress obtained at the root of defect by APC3D without SCF and with SCF, and ANSYS; pipe subjected to moment
Analysis of pipe with rectangular defect subjected to internal pressure
In the third example, a pipe with a rectangular defect subjected to internal pressure is analyzed, considering the geometric properties shown in Figure 12. Due to the limitation of the proposed method, the beam-pipe element formulation, only point 4 is analyzed, as shown in Figure 13. It is possible to realize a mapping that involves more points of analysis and obtain curves of the stress concentration factors at these points. These curves can be inserted into the proposed method, and results can be obtained that involve points neighborhoods.
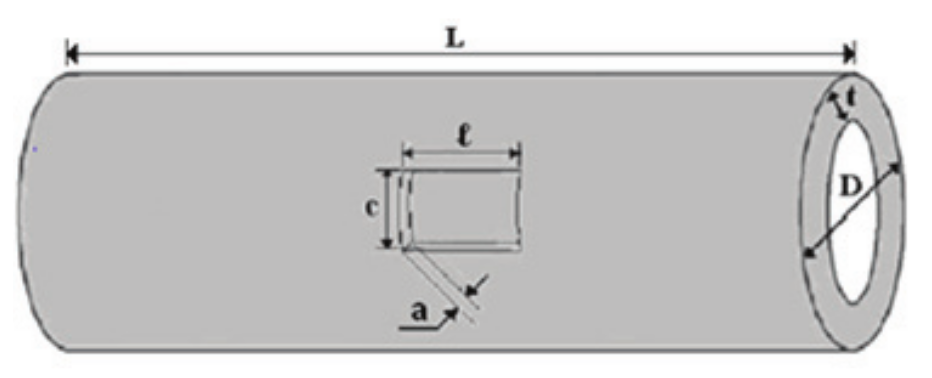
Figure 12
Schematic representation of a pipe with rectangular defect (Choi et al., 2003). L: 2300, D: 762, t: 17.5, c: 50, l: 300, a: 13,1 mm (75% de t)
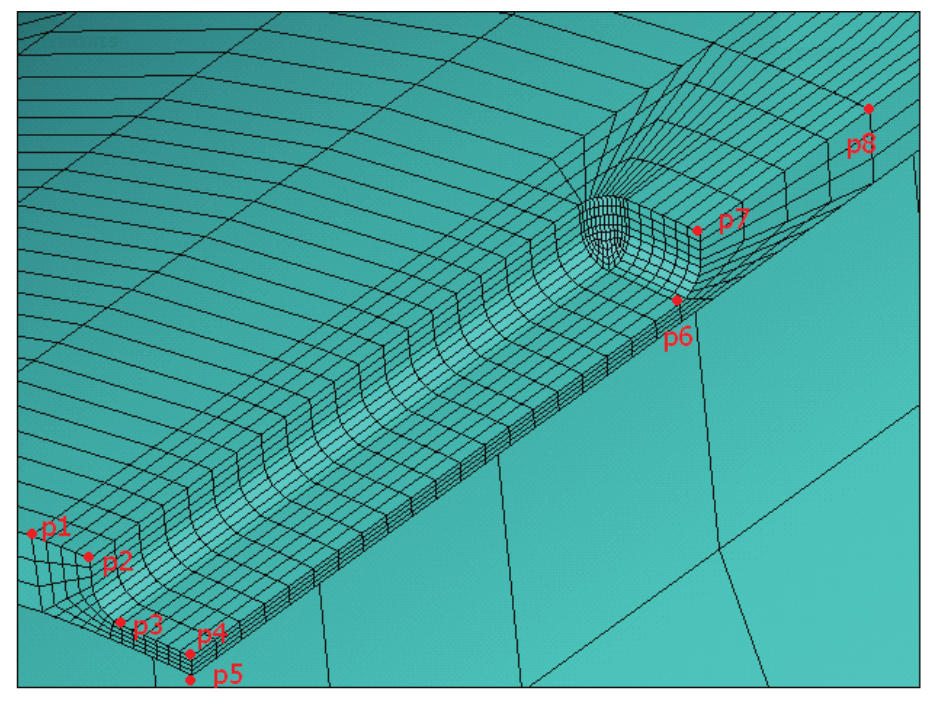
Figure 13
Discretization of a pipe with rectangular defect and principal points
The curve that shows the Von Mises stress versus load steps at point 4 is determined from a 3D element model from ANSYS. From this curve, a function of interpolation of the stress concentration factor is calculated and is inserted into APC3D. The numerical model of the beam-pipe element is constituted by 23 elements and the defect is represented by an element with an equivalent length to that of the defect. The results of Von Mises stress, with 63 load steps, at point 4 are presented in Figure 14, with an internal pressure 63 MPa. This example shows the versatility of the proposed methodology in analyzing different profiles of defects.
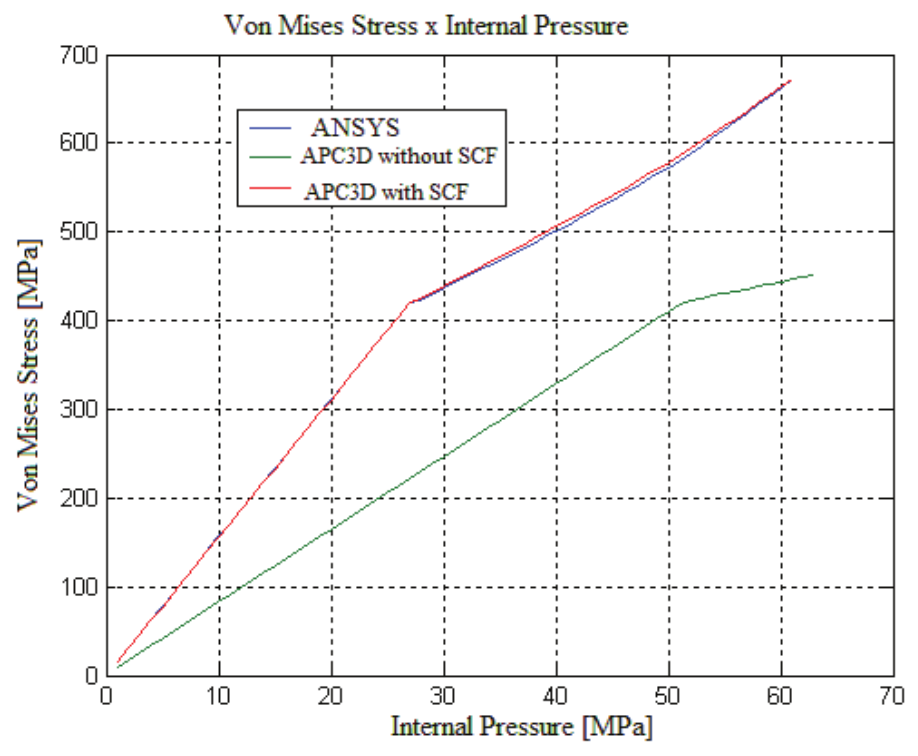
Figure 14
Von Mises stress obtained by APC3D without SCF and with SCF, and ANSYS; example 3
The Von Mises curve versus load steps is obtained at the root of defect. The SCF is determined in each load step and the function that represents the SCF variation is obtained. The function is inserted into APC3D and the results of analysis in terms of stress are represented in Figure 11, from which it can be observed that the APC3D with SCF presents similar results to that of ANSYS in the linear regime. However, in the non-linear regime, there are differences between the values in comparison. On the other hand, the time processing of APC3D with SCF is considerably smaller than that of ANSYS.
Conclusion
In this work, an effort has been made to develop a defective pipe analysis methodology to reduce the computational effort for evaluating the operation limit pressure with reasonable accuracy. It is well known that it is possible to assess the stress concentration effect using a 2D or 3D finite element model. However, the nonlinear solution of such a numerical model demands processing time. To overcome this problem, the methodology proposed in this work aims to introduce a stress concentration factor Equation, evaluated a priori by 2D or 3D elements, into beam finite element virtual work Equation. Such an introduction causes inaccuracy in the stress evaluation by beam elements, in comparison with 3D or 2D elements. In addition, it causes an overbalance in the virtual work Equation. This problem was solved by using the methodology of stress compensation, developed by the author of this work. From the analysis of several applications, the results obtained by the stress compensation method demonstrate the potential and applicability of the proposed method. The resulting accuracy can be improved by using a smaller tolerance for the convergence criterion and increasing the order of the polynomial Equation for the stress concentration factor approximation. On the other hand, the proposed method has the capacity to handle an analysis of a pipeline containing a rectangular defect, and simultaneously, subjected to a combination of loading in a global pipeline behavior analysis. Such analysis carried out by APC3D will take less computational effort in comparison to a numerical model constructed by 3D elements from commercial software.
References
Adib, H., Jallouf, S., Schmitt, C., Carmasol, A., & Pluvinage, G. (2007). Evaluation of the effect of corrosion defects on the structural integrity of X52 gas pipelines using the SINTAP procedure and notch theory. International Journal of Pressure Vessels and Piping, 84(3) 123-131.
American Society of Mechanical Engineers. (1991). B31G-1991. Manual for determining the remaining strength of corroded pipelines. New York City, NY: The American Society of Mechanical Engineers.
Bathe, K. J. (1996). Finite element procedures. Upper Saddle River, New Jersey: Prentice Hall.
Choi, J. B., Goo, B. K., Kim, J. C., Kim, Y. J., & Kim, W. S. (2003). Development of limit load solutions for corroded gas pipelines. International Journal of Pressure Vessels and Piping, 80(2), 121-128.
Chouchaoui, B. A., & Pick, R. J. (1996). Behaviour of longitudinally aligned corrosion pits. International Journal of Pressure Vessels and Piping, 67(1), 17-35.
Cronin, D. S., & Pick, R. J. (2002). Prediction of the failure pressure for complex corrosion defects. International Journal of Pressure Vessels and Piping, 79(4), 279-287.
Dhatt, G., Touzot, G., & Cantin, G. (1985). The finite element method displayed. Norwich: John Wiley & Sons.
Kim, Y. J., & Son, B. G. (2004). Finite element based stress concentration factors for pipes with local wall thinning. International Journal of Pressure Vessels and Piping, 81(12), 897-906.
Kim, Y. J., Shim, D. J., Huh, N. S., & Kim, Y. J. (2002). Plastic limit pressures for cracked pipes using finite element limit analyses. International Journal of Pressure Vessels and Piping, 79(5), 321-330.
Nowzartash, F., & Mohareb, M. (2004). An elasto-plastic finite element for steel pipelines. International Journal of Pressure Vessels and Piping, 81(12), 919-930.
Oh, C. K., Kim, Y. J., Baek, J. H., Kim, Y. P., & Kim, W. S. (2007). Ductile failure analysis of API X65 pipes with notch-type defects using a local fracture criterion. International Journal of Pressure Vessels and Piping, 84(8), 512-525.
Staat, M. (2005). Local and global collapse pressure o longitudinally flawed pipes and cylindrical vessels. International Journal of Pressure Vessels and Piping, 82(3), 217-225.
Zhang, B., Ye, C., Liang, B., Zhang, Z., & Zhi, Y. (2014). Ductile failure analysis and crack behavior of X65 buried pipes using extended finite element method. Engineering Failure Analysis, 45, 26-40.
Author notes
hsu.shang@pucpr.br