Estatística
Determination and validation of group numbers in a cluster analysis: A case study applied to forestry science
Determinação e validação do número de grupos em análise de agrupamento: um estudo de caso em ciência florestal
Determination and validation of group numbers in a cluster analysis: A case study applied to forestry science
Acta Scientiarum. Technology, vol. 38, no. 3, pp. 339-344, 2016
Universidade Estadual de Maringá
Received: 30 June 2015
Accepted: 23 November 2015
Abstract: The objective of this study was to systematically study and interpret the number of species groups through the adjusted Rand index (ARI), from the combination of the hierarchical technique and connection method characteristics. We attempted to facilitate the work of researchers on the number of groups and validation of the groups. The original data based on the Mahalanobis distance, the hierarchical single linkage, complete linkage, average linkage, Ward’s and ARI methods were applied. For the validation of methods, cophenetic coefficients and the ARI were used. It was observed that the use of the ARI had the potential to significantly improve the decisions regarding the number operating groups, becoming, therefore, a recommended technique to search for the optimal number of groups.
Keywords: cophenetic correlation, clustering algorithm, hierarchical, index of validation.
Resumo: Objetivou-se uma sistemática para o estudo e a interpretação do número de grupos por meio do índice de Rand ajustado (ARI), a partir da combinação de características da técnica hierárquica e dos métodos de ligação. Assim, procurou-se facilitar o trabalho dos pesquisadores quanto ao número de grupos e da validação dos grupos. Os dados originais foram aplicados, com base na distância de Mahalanobis, da técnica hierárquica e dos algoritmos de ligação simples, de ligação média, de ligação completa, e do algoritmo de Ward. O número de grupos foi determinado pelo ARI e para comparação dos algoritmos de ligação foram utilizados os coeficientes cofenéticos. Observou-se que o uso do ARI tem o potencial de melhorar significativamente a tomada de decisões sobre o número operacional grupos.
Palavras-chave: correlação cofenética, algoritmo de agrupamento, hierárquica, índice de validação.
Introduction
The collection of field data in a forest is a complex activity due to both the adversities inherent to the environment and the demand for high-quality data being collected. Furthermore, the density and diversity of a forest also make data collection complex, as noted by the a tree trunk heights, commercial, full, diameter at breast height (DBH) and tree volume. Studies of growth and forest production need these data, therefore, it is essential to identify methodologies that, despite the difficulties, can generate estimates of quality (Gonçalves, Eldik, & Pokorny, 2009).
In tropical forests, the presence of a canopy is characteristically formed by species able to reach great heights and an understorey formed by the shade tolerant species, which are of small stature (Gourlet-Fleury et al., 2005). Therefore, researchers are searching for methods to simplify its structure and facilitate interpretations of the functioning of these ecosystems. Among the main techniques, the group of forest species is compared to tree size.
In a natural forest, it is common to distribute plants according to a clustering architecture, i.e. by means of division into groups; according to Roberts and Gilliam (1995), this architecture is an important factor for maintaining higher species diversity and subsidising forest management. However, the recognition group is still controversial in the literature (Vale et al., 2009).
The purpose of this study is to consider the use of these techniques, as well as the type of species and their interrelations. Among the various multivariate techniques found in the literature, undoubtedly, the most used is the cluster analysis, as researchers generally seek the recognition of patterns, aiming to simplify and explain the behaviour of a forest and a group of plots or a plot through the measurement of various species.
In a cluster analysis, the objective is to gather objects or plots of a sample of the population studied for some classification criterion. Thus, its use requires making a number of independent decisions, which may represent different groups.
A cluster analysis requires researchers to make a series of independent decisions, which, in turn, require knowledge of its properties, the choice of similarity or dissimilarity of the various methods and a manner of validity, which may represent different groups. Furthermore, the result of the grouping may be influenced by the choice of the measure of similarity or dissimilarity, as well as by choosing the number of groups (Kunz, Ivanauskas, Martins, Silva, & Stefanello, 2009). Grouping is done to minimise the differences between homogeneous items within the study group and maximise heterogeneous differences between plots of different groupings.
Another important point to highlight is the identification of data on atypical behaviours, i.e. with the presence of outliers, which can be defined as observations that are beyond the expected pattern in each group with characteristics very divergent from other members of the population, which may impair the quality of results (Coimbra, Glauco, Cruz, Melo, & Eckert, 2010). Thus, before performing the cluster analysis, it is recommended to check for outliers, leaving the researcher to decide whether or not to continue using the database (Rody et al., 2010).
Thus, this work aimed to provide a more exploratory data analysis in order to facilitate the work of researchers regarding outliers, the number of groups, the clustering techniques and the validation groups, and increase the knowledge that can be obtained when applying a set of logical sentences in a cluster analysis.
Material and methods
We used survey data from the Atlantic Forest remnant called the Boilers Mata (Costa Jr., 2008), located in the municipality of Catende-PE, which is situated in the middle region of Pernambuco forest. Data were obtained from instalments of 250 quadrants measuring 40 m² (10 x 25 m each), and 29 species systematically allocated throughout the remaining area, lying 25 m apart. In these instalments, only live trees with circumference at breast height (CBH) of 15 cm, 1.30 m above the soil that received listed metal plates and had the following annotated data were used: the CBH was measured with a tape and by visual estimation using trimmer rods as a benchmark, which measured 2 m. Subsequently, from the CBH, DBH and basal areas were calculated.
To study the similarity among instalments, the average height obtained by the Lorey index was used Equation 1:
 (1)
(1)where:
 = Lorey mean height of the j-th species, in the k-th parcel;
hijk = height of the i-th individual, the j-th species in the k-th parcel;
gijk = basimetric area of the i-th individual of the j-th species in the k-th instalment,
j = 1, ...., 29; k = 1, ..., 40;
i = 1, ..., ni (ni = total number of individual of j-th species in the k-th term).
To perform the cluster analysis, the Mahalanobis distance (D2) was used as a dissimilarity measure and was calculated according to the following Equation 2:
 (2)
(2)where:
“Sigma” is the  inverse of the residual covariance matrix of X;
 is the vector referring to the portion i;
 , ' is the transposed vector of the difference between
  and
and  ;
;
D2 has the characteristic of being invariant for any linear and non-singular transformation.
Simple connect, complete link, average distances and Ward's were the clustering methods used, as described by Johnson and Wichern (2007) and Mardia, Kent, and Bibby (1997). These methods were used because they are more used in practise and are easy to locate in various computer programmes.
The fusion sequence of groupings, as the method used, was graphically represented by dendrograms in which the number of groups used was determined by the adjusted Rand index (ARI), with eight groups based on the Mahalanobis distance. Different dendrograms obtained were then compared to enable an analysis of the comparison and validity between the methods.
Comparison of the coefficients
Cophenetic correlation:
The basic idea is to perform a comparison between the observed distances between the objects and the distances predicted from the cluster analysis process (dendrogram).
For the many cluster methods used, their matrices resulting from the simplification afforded by the method were obtained. Based on the original dissimilarity matrix and the matrix obtained by the dendrogram, the cophenetic correlation was obtained according to the following Equation 3 (Albuquerque et al., 2006):
 (3)
(3)where:
ci j is the value of dissimilarity between individuals i and j obtained from the cophenetic matrix and di j is the value of dissimilarity between individuals i and j obtained from the dissimilarity matrix; in a good clustering, it is expected that the differences in distances between those obtained with the dendrogram (by observing the order determined by the distances observed) and the predicted distances are small.
Index of validation
ARI:
It is important to evaluate the result of the generated clusters, i.e. if the solution is representative of the data set analysed.
The ARI determines the value of the similarity between two parts (P1 and P2), which determines to which group perished plots in groups. This means that if two partitions belong to the same group, either P1 or P2, the index value increases. On the other hand, if the two portions belong to the same group in P1 but belong to a different group in P2, the index value decreases. The ARI is the normalised version of the Rand index, where  and
and  are the number of groups of instalments in P1 and P2; n is the number of initial datasets;
  is the number of instalments in the group
  ;
;  is the number of portions of the group
 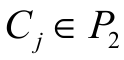 and
and  is the number of terms that belong to groups, i.e. the number of common instalments in P1 and P2.
According to Morey and Agresti (1984), the ARI is adjusted to chance and is defined as Equation 4:
 (4)
(4)This index ranges between -1 and 1. When the ARI equals 1, the two partitions are identical, since a value of 0 occurs when the agreement reached between the two partitions is due to chance, and a negative value occurs when the degree of similarity between the two partitions is smaller than expected by a random value assignment (Hubert & Aribie, 1985).
Results and discussion
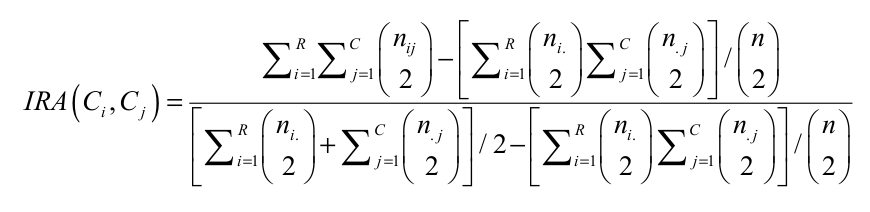
Based on the Mahalanobis distance matrix obtained from the original data transformed into Lorey height, the single, complete and average linkage methods and Ward’s method were obtained, resulting in the respective dendrograms (Figures 1 and 2).
Although the general structure of the clusters was very similar, it could be seen that there were small changes in the levels where the plots were grouped, i.e. the plots within the same group could be grouped in another order when the method was changed. However, this caused practical problems (Albuquerque et al., 2006).
In this study, through the use of the ARI, eight groups were determined instead of dividing the dendrogram at random.
The use of cluster analysis could greatly aid forest science researchers when building groups based on information from more than one feature. Researchers should evaluate the quality of clusters obtained, and compare the internal variance of each group and the total variance of the distance matrix.
The various types of existing methods have different ways of exploring and verifying the structures present in the data. The motivation to perform the combination of a hierarchical cluster analysis with validation is to combine the advantages of the methods and create a relationship between the hierarchical groups.
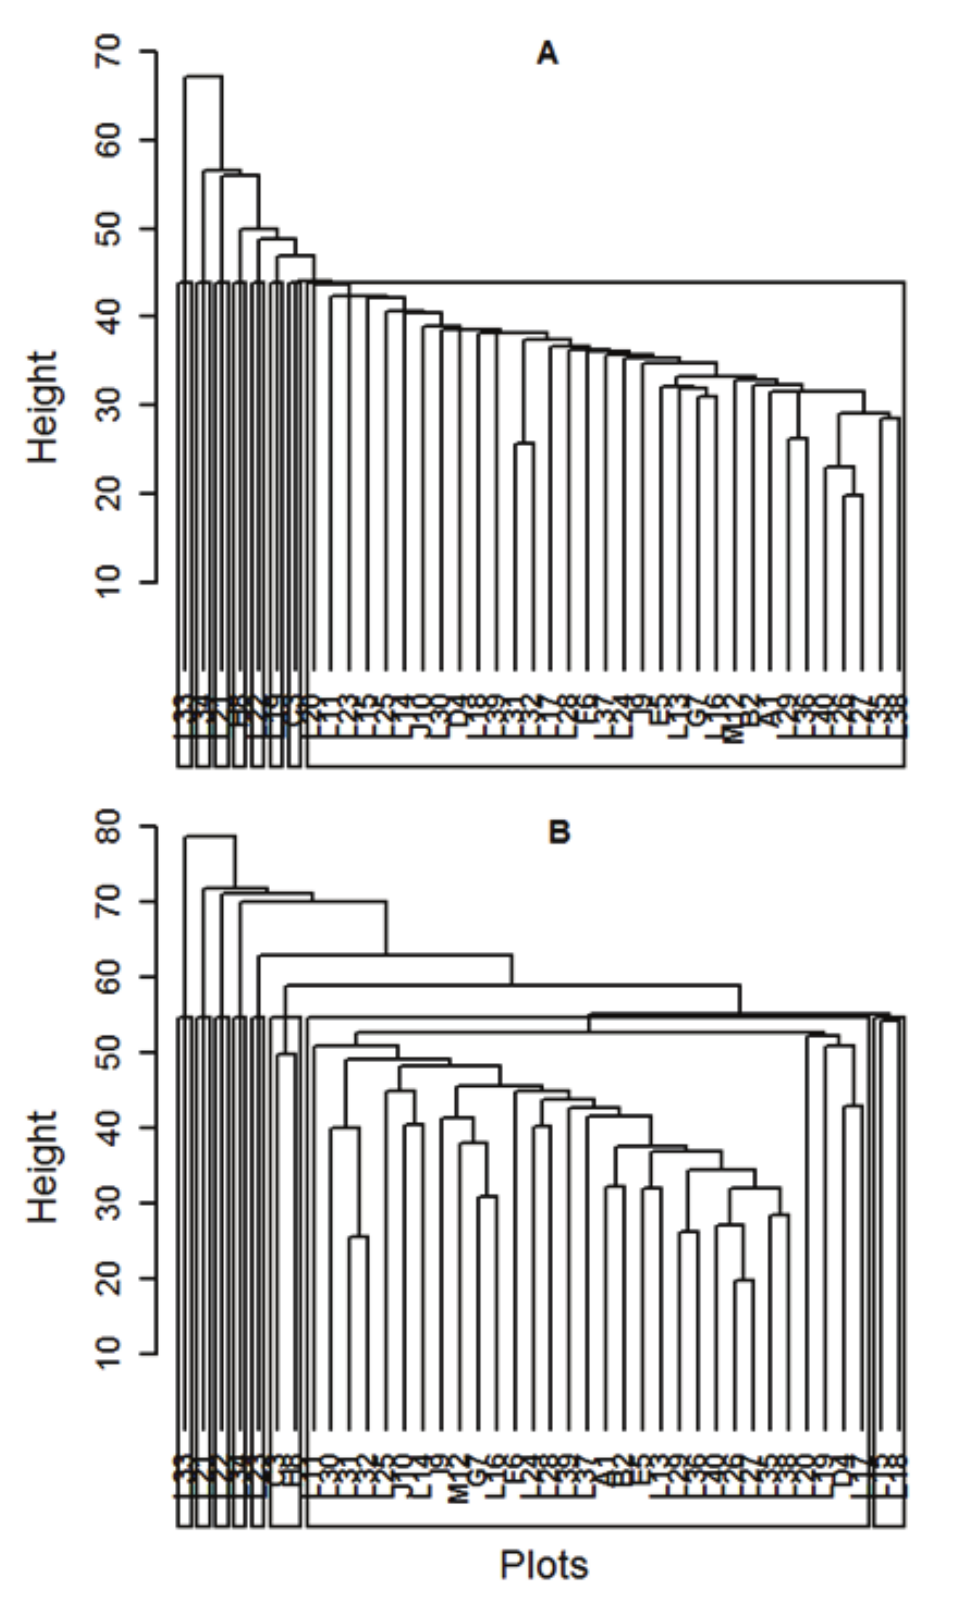
Figure 1
Dendrogram obtained by the single linkage (A) and average linkage (B) based on the Mahalanobis distance
The hierarchical technique has other features and advantages such as understanding the relationship between the data, finding the groups covered by the existing connections and their plots, and observing the number of groups ideal for the hierarchical technique of the assembly, among others (Albuquerque et al., 2006).
The hierarchical technique, when used to discover the relationships between groups and subgroups within a hierarchy of grouping, has complications related to the large volume of high-dimensional data, ease of navigation, and significant portions (Kruskal, 1964).
Observing the results obtained with the hierarchical methods used in this work, we noted that there were differences in the groups formed and the resulting amount of grouped data (Figures 1 and 2).
These differences were due to the method chosen, as the main feature of w hich was to be able to determine when a new group was to be created
during its implementation, while the methods are selected and from the choice even defines the number of groups. To validate the cluster involved ensuring that groups differed. Based on the cophenetic correlations of hierarchical clustering methods presented (Table 1), the method of average linkage provided better grouping, as it presented the highest cophenetic correlation (0.89), which was expected because the method of average distances produced better partitions than the single linkage, complete linkage and Ward’s methods. It has been observed that Ward’s method (0.39) provided the worst group, as it presented the smallest cophenetic correlation, which is in agreement with Barroso and Artes (2003) and Araujo, Chamil, Lonhhil, Avila, & Brena (2010), who also found similar results with the same methods but different species. Comparing is hierarchical methods (Table 1).
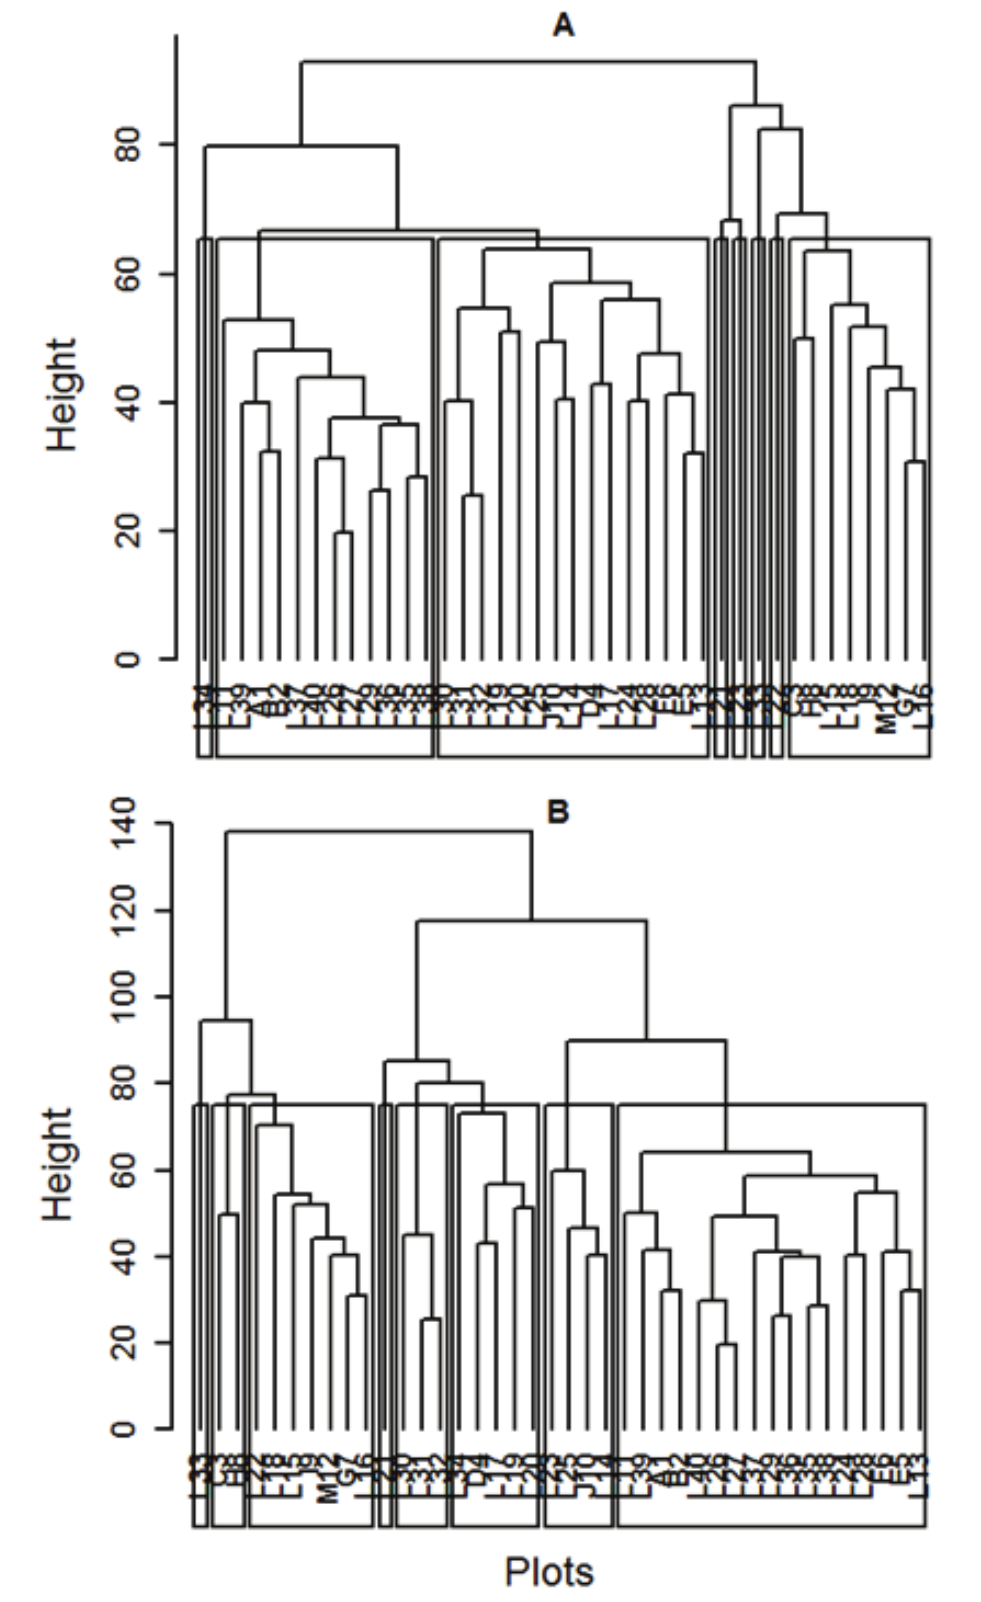
Figure 2
Dendrogram obtained via the complete linkage algorithm (A) and Ward’s method (B) based on the Mahalanobis distance
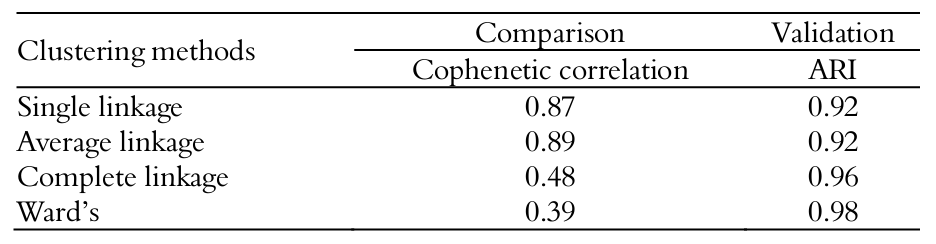
The cophenetic correlation groups should not be used to validate the number of groups or to make a comparison between the methods, since, for any number of groups, the cophenetic correlation has the same measurement. Further, a change in the method would change the value of the cophenetic correlation, because, for each method, it has a different value; therefore, the cophenetic correlation do the correlation of the original matrix via the method obtained from the dendrogram.
The cophenetic correlation values in Table 1 showed that simple and average linkage resulted in high magnitudes, and complete linkage and Ward’s methods were of low magnitude. This showed that there was a good representation of dissimilarity matrices as dendrograms, for the single and average linkage methods also showed that, through the cophenetic correlations, they were the preferred methods, as they had values equal to or greater than 0.8 (Meyer, Franco, & Souza, 2004).
In general, the higher the ARI, the more ‘efficient’ was the partition in the reduction of heterogeneity within the group using single linkage, complete linkage and Ward’s methods, as to yield the results observed in Table 1. The varied from 0.92 to 0.98, showed that there was a high level of efficiency. The complete linkage method showed the best result, while simple linkage presented the lowest value; however, all had values similar in magnitude, which showed that there were internal homogeneity and heterogeneity between groups (Milligan & Cooper, 1985).
Conclusion
The methodology proposed in the current work is promising for the study and interpretation of the validation of methods in the cluster analysis using various clustering methods on data from vegetation. Thus, it is believed that, with the use of the ARI, the researcher can discover the optimal number of groups and avoid the subjectivity involved in choosing the number of groups. These preliminary results can guide future research in the meaning of investigation and validation, which can justify or explain the different numbers of groups found.
References
Albuquerque, M. A., Ferreira, R. L. C., Silva, J. A. A., Stosic, B., Santos, E. S., & Souza, A. L. (2006). Estabilidade em análise de agrupamento: estudo de caso em ciência florestal. Revista Árvore, 30(2), 257-265.
Araujo, M. M., Chamil, L., Lonhhil, S. J., Avila, A. L., & Brena, A. D. (2010). Análise de agrupamento em remanescente de Floresta Ombrófila Mista. Ciência Florestal, 20(3), 1-18.
Barroso, L. P., & Artes, R. (2003). Análise multivariada. Reunião Anual da RBES e Seagro, 48(10), 100-118.
Coimbra, R. R., Glauco, G. M., Cruz, C. D., Melo, A. V., & Eckert, F. R. (2010). Caracterização e divergência genética de populações de milho resgatadas do Sudeste de Minas Gerais. Revista Ciência Agronômica, 41(1), 159-166.
Costa Jr., R. F., Ferreira, R. L. C., Rodal, M. J. N., Feliciano, A. L. P., Marangon, L. C., & Silva, W. C. (2008). Florística arbórea de um fragmento de Floresta Atlântica em Catende, Pernambuco – Nordeste do Brasil. Revista Brasileira de Ciências Agrárias, 2(4), 207-302.
Gonçalves, D. A., Eldik, T. V., & Pokorny, B. (2009). O uso do dendrômetro a laser em florestas tropicais: Aplicações para o manejo florestal na Amazônia. Floresta, 39(5), 175-187.
Gourlet-Fleury, S., Blanc, L., Picard, N., Sist, P., Dick, J., Nasi, R., … Forni, E. (2005). Grouping species for predicting mixed tropical forest dynamics: Looking for a strategy. Annual Forest Science, 62(8), 785-796.
Johnson, R. A., & Wichern, D. W. (2007). Applied multivariate statistical analysis (6th ed.). New Jersey, NJ: Upper Saddle River.
Hubert, L., & Arabie, P. (1985). Comparing partitions. Journal of Classification, 2(1), 193-218.
Kruskal, J. B. (1964). Multidimensional scaling by optimizing goodness of fit to a nommetric hypothesis. Psychometrika, 29(1), 1-27.
Kunz, S. H., Ivanauskas, N. M., Martins, S. V., Silva, E., & Stefanello, D. (2009). Análise da similaridade florística entre florestas do Alto Rio Xingu, da Bacia Amazônica e do Planalto Central. Revista Brasileira de Botânica, 32(4), 725-736.
Mardia, K. V., Kent, J. T., & Bibby, J. M. (1997). Multivariate analysis. London, UK: Academic Press.
Meyer, A. S., Franco, F. A. A., & Souza, A. P. (2004). Comparison of similarity coefficients used for cluster analysis with dominant markers in maize (Zea mays L.). Genetics and Molecular Biology, 27(1), 83-91.
Milligan, G. N., & Cooper, M. C. (1985). An examination of procedures for determining the number of cluster in a data set. Pfychometrika, 50(2), 159-179.
Morey, L. C., & Agresti, A. (1984). The measurement of classification agreement: An adjustment to the Rand statistic for chance agreement. Educational and Psychological Measurements, 44(1), 33-37.
Roberts, M. R., & Gilliam, F. S. (1995). Patterns and mechanisms of plant diversity in forested ecosystems: Implications for forest management. Ecological Application, 5(4), 969-977.
Rody, Y. P., Almeida, A. Q., Ribeiro, A., Sediyama, G. C., & Pezzopane, J. E. M. (2010). Delimitação de sítios ambientais homogêneos no Estado do Espírito Santo, com base no relevo, solo e clima. Ciência Rural, 40(12), 2493-2498.
Vale, V. S., Schiavin, I. I., Lopes, S. F., Dias Neto, O. C., Oliveira, A., & Gusson, A. E. (2009). Composição florística e estrutura do componente arbóreo em um remanescente primário de floresta estacional semidecidual em Araguari, Minas Gerais, Brasil. Hoehnea, 36(3), 417-429.
Author notes
marcioaa@uepb.edu.br