Engenharia Civil
Tension stiffening of steel-fiber-reinforced concrete
Análise do regime pós-fissuração do concreto armado reforçado com fibras de aço
Tension stiffening of steel-fiber-reinforced concrete
Acta Scientiarum. Technology, vol. 38, no. 4, pp. 456-463, 2016
Universidade Estadual de Maringá

This work is licensed under Creative Commons Attribution-NonCommercial-NoDerivs 3.0 International.
Received: 05 June 2015
Accepted: 15 March 2016
Abstract: In this paper, the mechanical behavior of steel-fiber-reinforced concrete was investigated to analyze the influence of steel fibers on tension stiffening. Using tension tests, the tension stiffening coefficient was evaluated through the load versus strain responses obtained from strain gages fixed to reinforcement steels. Moreover, an empirical model is proposed to estimate the tension stiffening coefficient of steel-fiber-reinforced concrete from reinforcement strains. From the test results, it was verified that the addition of steel fibers to concrete reduced the reinforcement steel strains and the crack width and increased the stiffness of cracked concrete, mainly in concretes reinforced with high volumes of fibers.
Keywords: tension tests, empirical model, crack width.
Resumo: Neste trabalho foi investigada a influência das fibras de aço no regime pós-fissuração do concreto armado submetido à tração. Para isso, foram ensaiados tirantes de concreto armado, dos quais foi obtido o parâmetro de endurecimento do concreto no regime pós-fissuração por meio de extensômetros colados nas barras de aço. Dos ensaios é proposto um modelo empírico para estimativa do parâmetro de endurecimento do concreto reforçado com fibras de aço. Os resultados mostram que a adição de fibras de aço ao concreto reduziu a deformação da armadura e a abertura das fissuras nos tirantes após a fissuração do concreto, com consequente aumento da rigidez do tirante quando comparada ao concreto sem adição de fibras. Esse efeito foi tanto mais acentuado quanto maior era o volume de fibras adicionado ao concreto.
Palavras-chave: tirante de concreto, modelo empírico, abertura de fissura.
Introduction
Tension stiffening reflects the ability of concrete to carry tension between cracks, which increases the rigidity of a reinforced concrete member before the reinforcement yields. This effect is primarily due to the mobilization of bonds at the steel–concrete interface. The tension stiffening is affected by the reinforcement ratio, the distribution and diameter of reinforcement bars, the concrete shrinkage, and the brittleness of the matrix. There are several empirical relationships to evaluate tension stiffening (Fields & Bischoff, 2004). For all relationships, the decrease of stiffness in a cracked member can be taken into account using a modified relationship for the load–strain response of the reinforcement steel (Figure 1a), using an average stress–strain response for concrete in the post-cracking range (Figure 1b), or both (Belarbi & Hsu, 1994). There are also some analytical models based on the bond-slip between concrete and reinforcement steel (Floegl & Mang, 1982; Gupta & Maestrini, 1990; Wu, Yoshikawa, & Tanabe, 1991; Choi & Cheung, 1996).
Figure 1a shows a typical load–strain response of a tension specimen and of a bare steel bar. In this figure, the contribution of concrete to the tension response is given by the difference between the strains in the tension specimen and the bare steel bar. The tension specimen response is initially linearly elastic with uniform stresses in the concrete and steel along the length of the member until the tensile strength of the concrete is reached. In Figure 1b, after the first crack (C1), the average tensile stress in the concrete decreases with increasing strain, which reduces the tension stiffening as the load increases (Fields & Bischoff,
2004). New cracks (C2, C3, and C4) arise as the load increases, further reducing the distance between them until this distance is more than twice the anchorage length. At the end of the cracking stage, the cracking becomes stable and no new cracks will form. During the stabilized cracking stage, the crack widths increase while the tensile stress and the tension stiffening decrease. However, the tension stiffening decreases more slowly due to the loss of bonding, which is due to internal micro-cracking near the interface between the steel and concrete (Fields & Bischoff, 2004). When the reinforcement steel yields, the transfer of tensile stresses at the steel-concrete interface is damaged, which makes it difficult to transfer loads after the yielding load of the reinforcement steel is reached.
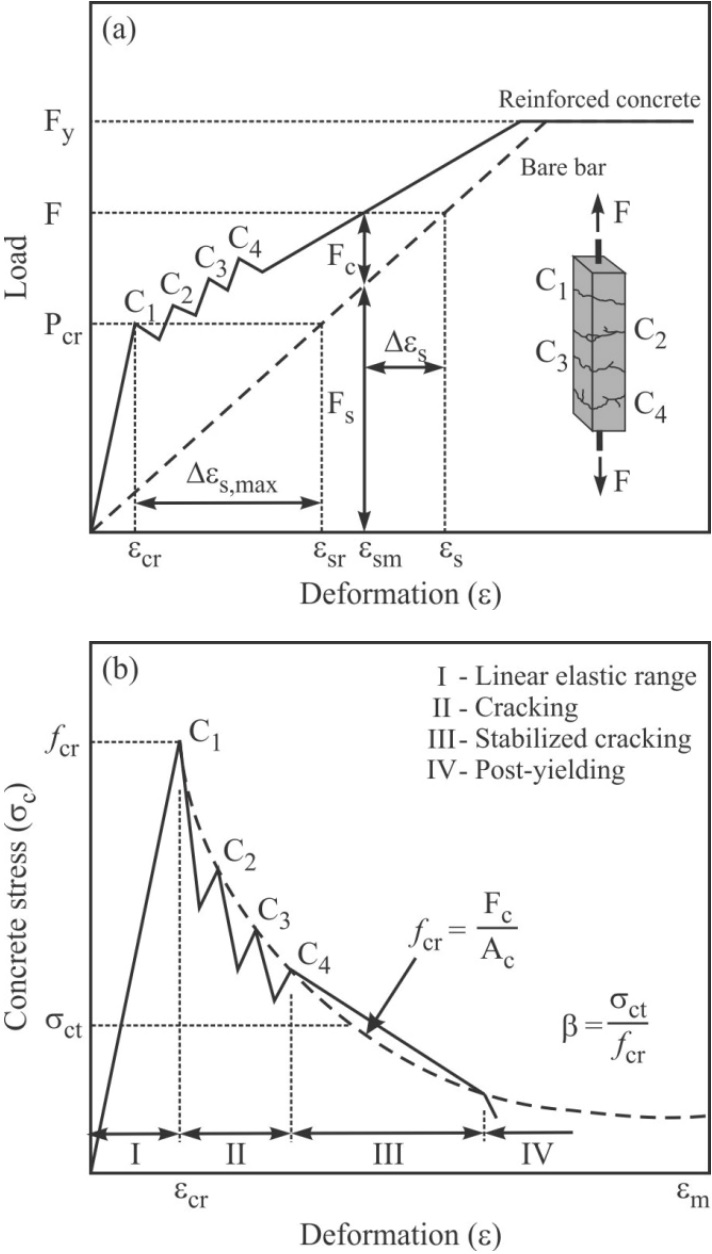
Figure 1
a) Typical load–strain response from a tension test and; b) reduction of the average tensile stress in concrete by tension stiffening
Concrete shrinkage negatively influences the tension stiffening once it causes an initial shortening of the member, which induces compressive stress in the reinforcement steel. To maintain equilibrium, the reinforcement steel induces tensile stress in the concrete, which reduces the cracking load (Lorrain, Maurel, & Seffo, 1998; Bischoff, 2001). In addition, high-strength concretes present larger shrinkage, and larger reductions of tension stiffening are expected when shrinkage is ignored.
In fiber-reinforced concrete, fibers improve the mechanical properties of the matrix due to the bridge effect through the cracks after cracking of the matrix. Furthermore, fibers improve the tenacity and ductility of the matrix by controlling the cracking process and increasing the tensile and bond strengths between the steel and concrete. The improvement of the bond strength and the ability to transfer tensile stress through the cracks should increase the tension stiffening of fiber-reinforced concrete (Abrishami & Mitchell, 1997; Yang, Walraven, & Den Uijl, 2009; Deluce & Vecchio, 2013; Lee, Cho, & Vecchio, 2013). Fibers also control splitting cracks and cracking caused by shrinkage. Fibers with a high modulus of elasticity are more efficient in limiting the shrinkage of the matrix because of the greater difference between the modulus of elasticity of the fiber and that of the matrix (Zhang & Li, 2001).
This paper aims to show the influence of steel fibers on the tension stiffening effect and proposes an empiric model for predicting the tension stiffening coefficient from the fiber content. In addition, this paper shows that the partial substitution of cement for less reactive materials, such as fly ash, is a possible strategy to reduce the consumption of cement because no changes in the tension stiffening of concrete due to mineral additions were observed.
Material and methods
Twenty-six tension tests of plain and steel-fiber-reinforced concrete (SFRC), with and without mineral additions (silica fume and fly ash), were performed. One tension specimen was produced for plain concretes with and without mineral additions, but two were produced for the fiber-reinforced concrete. The variables analyzed were the fiber aspect ratio and fiber content. The specimens were stored in a humid chamber in which the temperature was kept at approximately 23ºC and the humidity was approximately 95%. Thus, there was no need to determine concrete shrinkage because the specimens were removed from the humid chamber only 12 hours before the tests.
Materials
In the production of the concretes, the following materials were used: blast furnace slag Portland cement, natural sand, coarse aggregate with a maximum size of 25 mm, steel fibers, and a superplasticizer admixture (1.0%). The concretes with mineral additions were produced by adding 10% silica fume to provide workability and by replacement of 30% of the cement with fly ash. Dramix® RC 65/60 BN (called F65 in this paper because its aspect ratio is 65) and Dramix® RC 80/60 BN (called F80 is this paper because its aspect ratio is 80) steel fibers with hooked ends were used. The fibers were 60 mm long and had a tensile strength of 1,000 MPa and a modulus of elasticity of 200 GPa. The following fiber contents were used: 0.75% (58.87 kg m-3), 1.00% (78.50 kg m-3), and 1.50% (117.75 kg m-3). However, the addition of fiber with a high aspect ratio to fresh concrete is very difficult, even when using a high amount of superplasticizer. Thus, the greatest volume fraction of the F80 fiber was decreased from 1.50% to 1.25% (98.13 kg m-3), which was possible because the reinforcement index obtained for each type of fiber was very similar.
The composition of the concretes without mineral additions is presented in Table 1 and that with mineral additions in Table 2. The amount of cement and aggregates in the mixtures varied with fiber content as a result of the adjustment of the plain concrete composition due to the addition of steel fibers. However, this adjustment was small because a low volume fraction of fibers was used. The workability of fresh concrete with and without fibers obtained from slump tests is also presented in these tables. A slight decrease in the workability of SFRC was observed.
| Material | Plain concrete | Steel fiber-reinforced concrete | |||||
| Dramix RC 65/60 BN | Dramix RC 80/60 BN | ||||||
| 0.75% | 1.00% | 1.50% | 0.75% | 1.00% | 1.25% | ||
| Cement | 439.05 | 425.68 | 428.69 | 423.01 | 424.68 | 429.61 | 430.70 |
| Natural sand | 870.10 | 849.37 | 857.38 | 846.02 | 849.37 | 859.21 | 861.39 |
| Coarse aggregate | 870.10 | 849.37 | 857.38 | 846.02 | 849.37 | 859.21 | 861.39 |
| Water | 173.50 | 167.24 | 168.82 | 166.58 | 167.24 | 169.18 | 169.61 |
| Steel fiber | 0.00 | 58.87 | 78.50 | 117.75 | 58.88 | 78.50 | 98.13 |
| Superplasticizer | 3.29 | 4.25 | 4.29 | 4.23 | 4.25 | 4.30 | 4.31 |
| Workability (mm) | 210 | 135 | 130 | 85 | 40 | 120 | 85 |
| Material | Plain concrete | Steel fiber-reinforced concrete | |||||
| Dramix RC 65/60 BN | Dramix RC 80/60 BN | ||||||
| 0.75% | 1.00% | 1.50% | 0.75% | 1.00% | 1.25% | ||
| Cement | 261.46 | 260.84 | 259.40 | 256.53 | 257.09 | 259.40 | 257.96 |
| Silica fume | 31.74 | 31.67 | 31.49 | 31.15 | 31.,21 | 31.49 | 31.32 |
| Fly ash | 100.43 | 100.19 | 99.64 | 98.54 | 98.75 | 99.64 | 99.09 |
| Natural sand | 871.53 | 869.46 | 864.66 | 855.11 | 856.95 | 864.66 | 859.88 |
| Coarse aggregate | 871.53 | 869.46 | 864.66 | 855.11 | 856.95 | 864.66 | 859.88 |
| Water | 172.28 | 171.20 | 170.25 | 168.37 | 168.73 | 170.25 | 169.31 |
| Steel fiber | 0.00 | 58.87 | 78.50 | 117.75 | 58.88 | 78.50 | 98.13 |
| Superplasticizer | 3.27 | 4.35 | 4.32 | 4.28 | 4.28 | 4.32 | 4.30 |
| Workability (mm) | 220 | 190 | 150 | 60 | 140 | 130 | 100 |
To characterize the concretes, compression tests and splitting tensile tests were carried out after 28 days. For these tests, cylindrical specimens with diameters of 150 mm and heights of 300 mm were used. In addition, four-point bending tests were carried out to determine the toughness factor and the flexure tensile strength of the SFRCs by Japan Society of Civil Engineers (JSCE, 1984). For these tests, prismatic specimens that were 600 mm long, 150 mm high, and 150 mm wide were used.
Tension specimens
The RILEM Technical Committee FMB-147 (Elfgren & Noghabai, 2002) announced a round-robin test and analysis of bonding in which the dimensions and production of the test specimens, as well as the experimental setup and procedures, were specified. The experiments reported here follow the recommendations of this committee, although only concrete mixtures without fibers were prescribed. All tension specimens had square cross-sections of 150 mm on each side and were 800 mm in length and reinforced with a single bar of steel (see Figure 2) with a yielding strength of 494 MPa and a modulus of elasticity of 210 GPa. The cross-section was chosen to ensure the random distribution of fibers in concrete, that is, to avoid the preferential orientation of fibers once the specimens were made in the horizontal position.
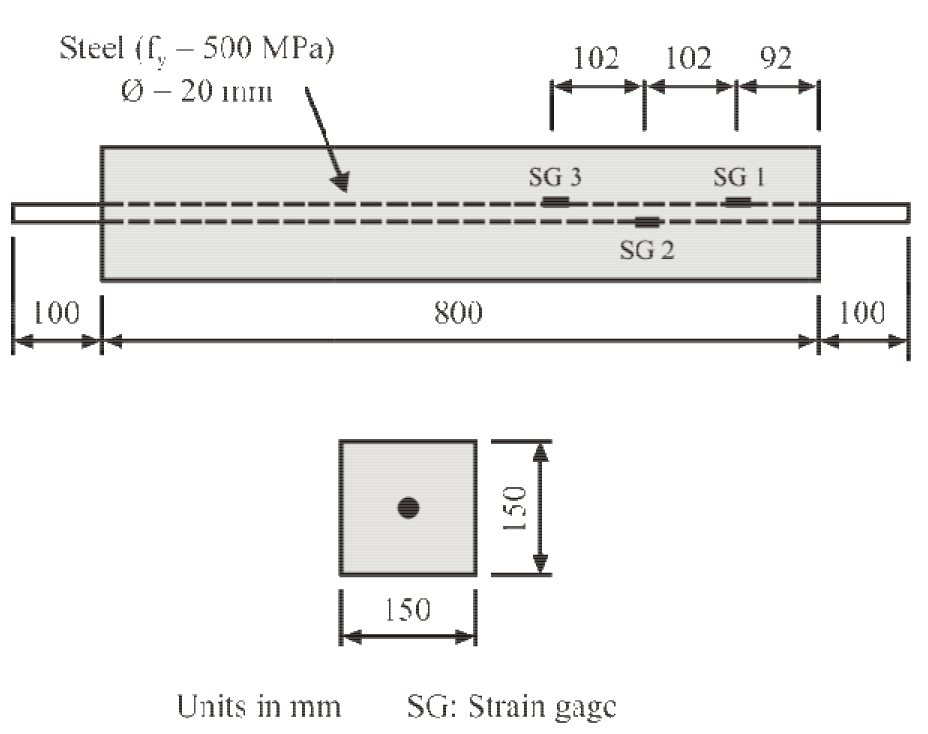
Figure 2
Geometry of tension specimens (SG: strain gage)
The reinforcement steel was 1000 mm long, with a diameter of 20 mm, and was positioned longitudinally along the specimens to leave 100 mm of free steel on both ends to allow a load to be applied. Three electrical strain gages were fixed to the reinforcement steel of all tension specimens according to the positions specified in Figure 2.
To compare the response of the tension specimen with the response of a bare bar, the same length, test setup, and measuring and evaluation techniques were used in both cases. The strain of the bare bar was measured by three electrical strain gages fixed to the same position of the tension specimens.
Testing procedure
The tension tests were carried out under displacement control in an electrical-mechanical universal testing machine with a capacity of 300 kN (see Figure 3). The rate of the displacements used during all tests was 0.3 mm min-1. The reinforcement steel strains were measured by three strain gages spaced 102 mm apart. The first strain gage was placed at 92 mm from the superior end of a concrete prism of 800 mm. The steel strains were measured at each 5 kN load increment.
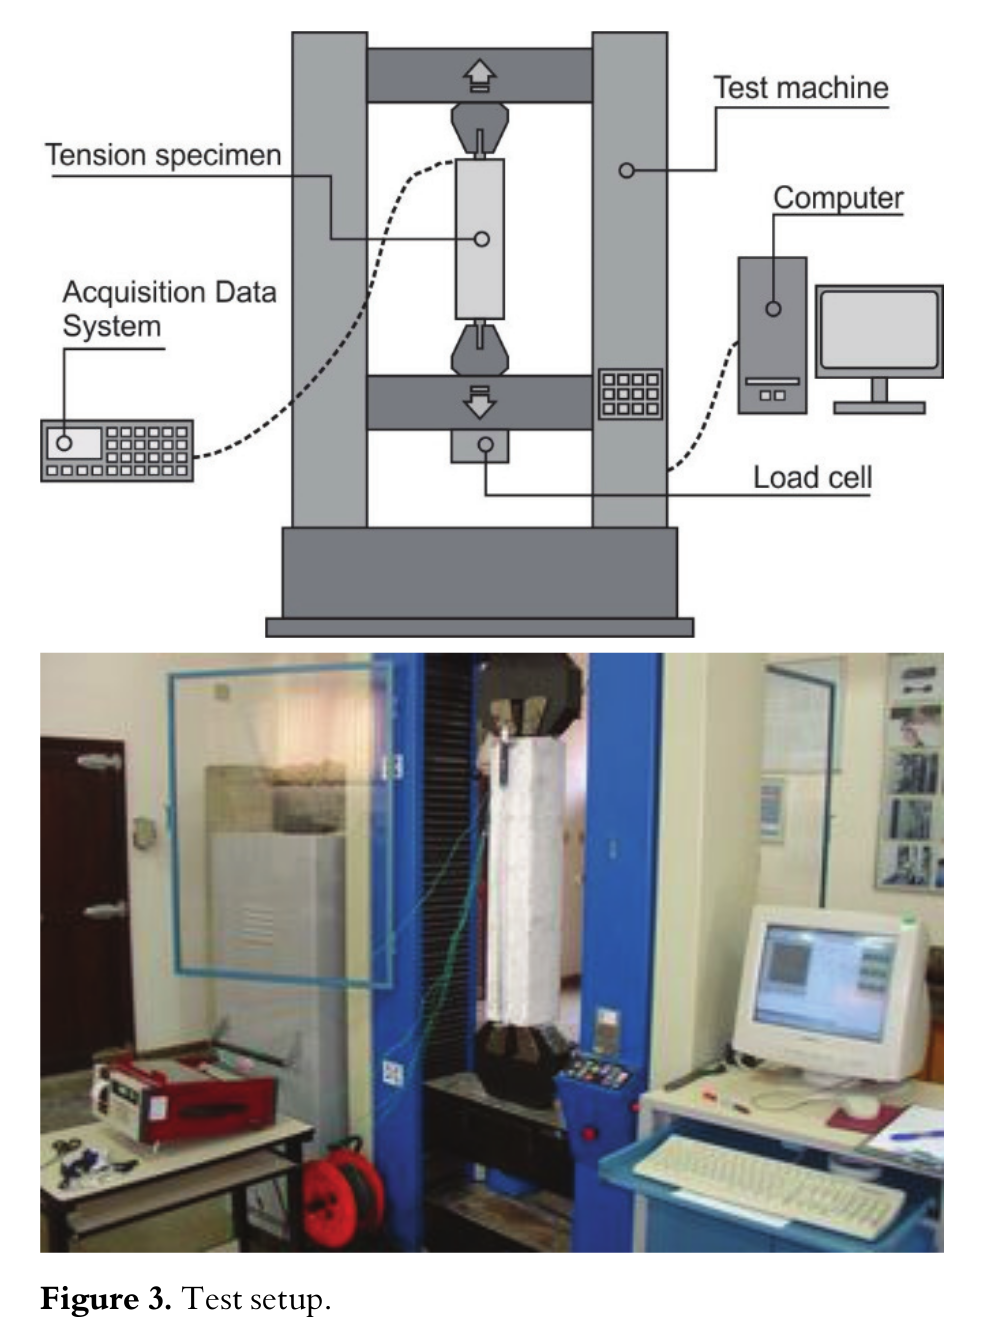
Figure 3
Test setup
Results and discussion
Concrete properties
The mechanical properties of concretes without mineral additions are given in Table 3 and concretes with mineral additions are given in Table 4.
These tables show that the mechanical properties of the SFRC were positively affected by the presence of fibers. The compressive strength (fcm) had a maximum increase of 28%. The flexure (fctm,f) and splitting (fctm) tensile strengths were also affected by fibers, and these properties increased as the fiber content increased. The same is true for the toughness factor. By comparing the results in Tables 3 and 4, it can also be observed that the mechanical properties of the SFRC were reduced by the 30% replacement of the cement by fly ash.
| Vf (%) | Plain concrete | Steel fiber-reinforced concrete | |||||
| Dramix RC 65/60 BN | Dramix RC 80/60 BN | ||||||
| 0.75% (0.49)A | 1.00% (0.65)A | 1.50% (0.98)A | 0.75% (0.60)A | 1.00% (0.80)A | 1.25% (1.00)a | ||
| fcm, MPa | 44.37 | 56.90 | 45.48 | 52.17 | 52.31 | 51.80 | 56.37 |
| fctm, MPa | 4.20 | 6.15 | 6.12 | 8.28 | 6.46 | 6.85 | 7.75 |
| fctm,f, MPa | – | 8.14 | 8.80 | 9.22 | 9.10 | 9.50 | 7.01 |
| Toughness factor, MPa | – | 7.13 | 7.91 | 8.25 | 7.35 | 7.95 | 5.56 |
| Vf (%) | Plain concrete | Steel fiber-reinforced concrete | |||||
| Dramix RC 65/60 BN | Dramix RC 80/60 BN | ||||||
| 0.75% (0.49)A | 1.00% (0.65)A | 1.50% (0.98)A | 0.75% (0.60)A | 1.00% (0.80)A | 1.25% (1.00)A | ||
| fcm, MPa | 41.40 | 44.37 | 42.63 | 49.90 | 43.20 | 42.05 | 45.00 |
| fctm, MPa | 4.25 | 4.73 | 6.48 | 7.09 | 6.15 | 5.96 | 5.85 |
| fctm,f, MPa | – | 6.85 | 6.87 | 9.84 | 8.20 | 9.34 | 8.93 |
| Toughness factor, MPa | – | 5.81 | 6.33 | 8.90 | 7.34 | 8.20 | 7.26 |
Crack width
The crack patterns in tension specimens were observed during tension tests. The plain concrete specimens showed a small number of transverse cracks. With the addition of steel fibers, multiple cracks were observed, which demonstrated that the best control of the cracking process was provided by the fibers.
Figure 4 shows how the average main crack width (wm) varied as the load increased. The values presented in these figures refer to the mean of measurements carried out at several points of the crack (mainly in corners), which means that the crack width was not uniform along its path. The same figure shows the maximum limit of cracking recommended by the American Concrete Institute (ACI, 2005) for concretes without fibers, which in this case was 0.329 mm. A significant reduction in the crack width due to the addition of fibers was observed, and this reduction increased as the amount of fiber increased. In some cases, this reduction reached 75% compared to the crack width in the tension specimen made of plain concrete. Comparing the crack width to the maximum limit
prescribed by the ACI 224R, it was noted that in tension specimens made of SFRC this limit was reached for loads near the yielding load of the reinforcement or, in some cases, was not reached.
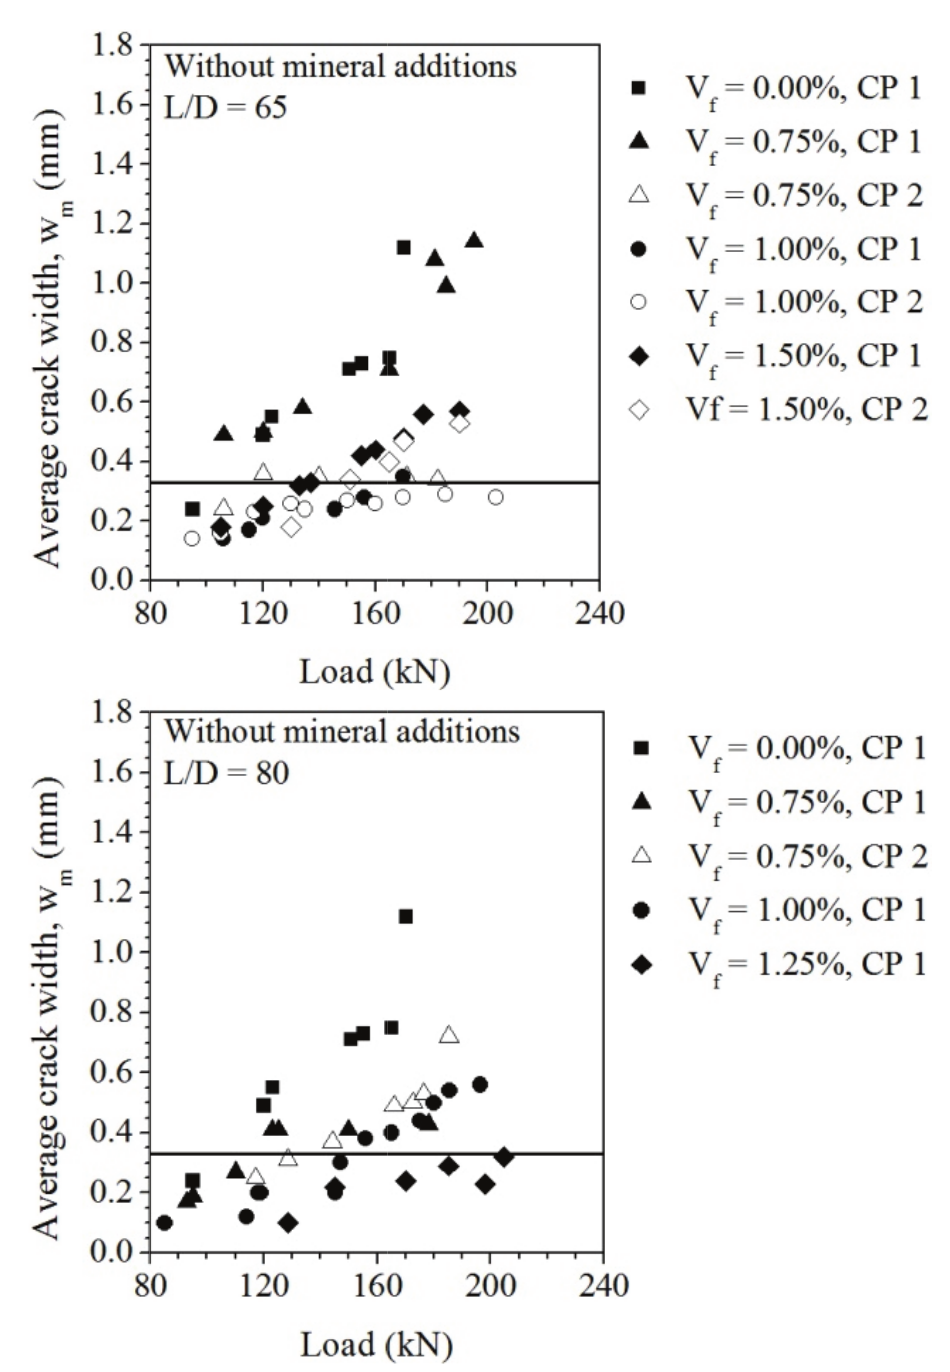
Figure 4
Average main crack widths in tension specimens without mineral additions
Load–strain relation
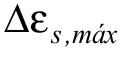
The load–strain relation was determined to evaluate the influence of steel fibers on the mechanical behavior of tension specimens. The fiber aspect ratio and the fiber content were evaluated. It was observed that specimens of the SFRC supported greater tensile loads for a given strain level than specimens of the plain concrete, and this load increased as the fiber content increased
(Figures 5 and 6), although it was not significantly affected by the fiber aspect ratio. It was also verified, for both fibers, that the yielding load of the reinforcement steel in the SFRC tension specimens was higher than the yielding load of reinforcement steel in the plain concrete tension specimens, which was verified for mixtures with and without mineral additions. Furthermore, the responses of concretes with mineral additions had lower scattering and
were similar to the responses of concretes without mineral additions, which suggests that the substitution of cement by fly ash is possible without reducing the tensile strength of SFRC.
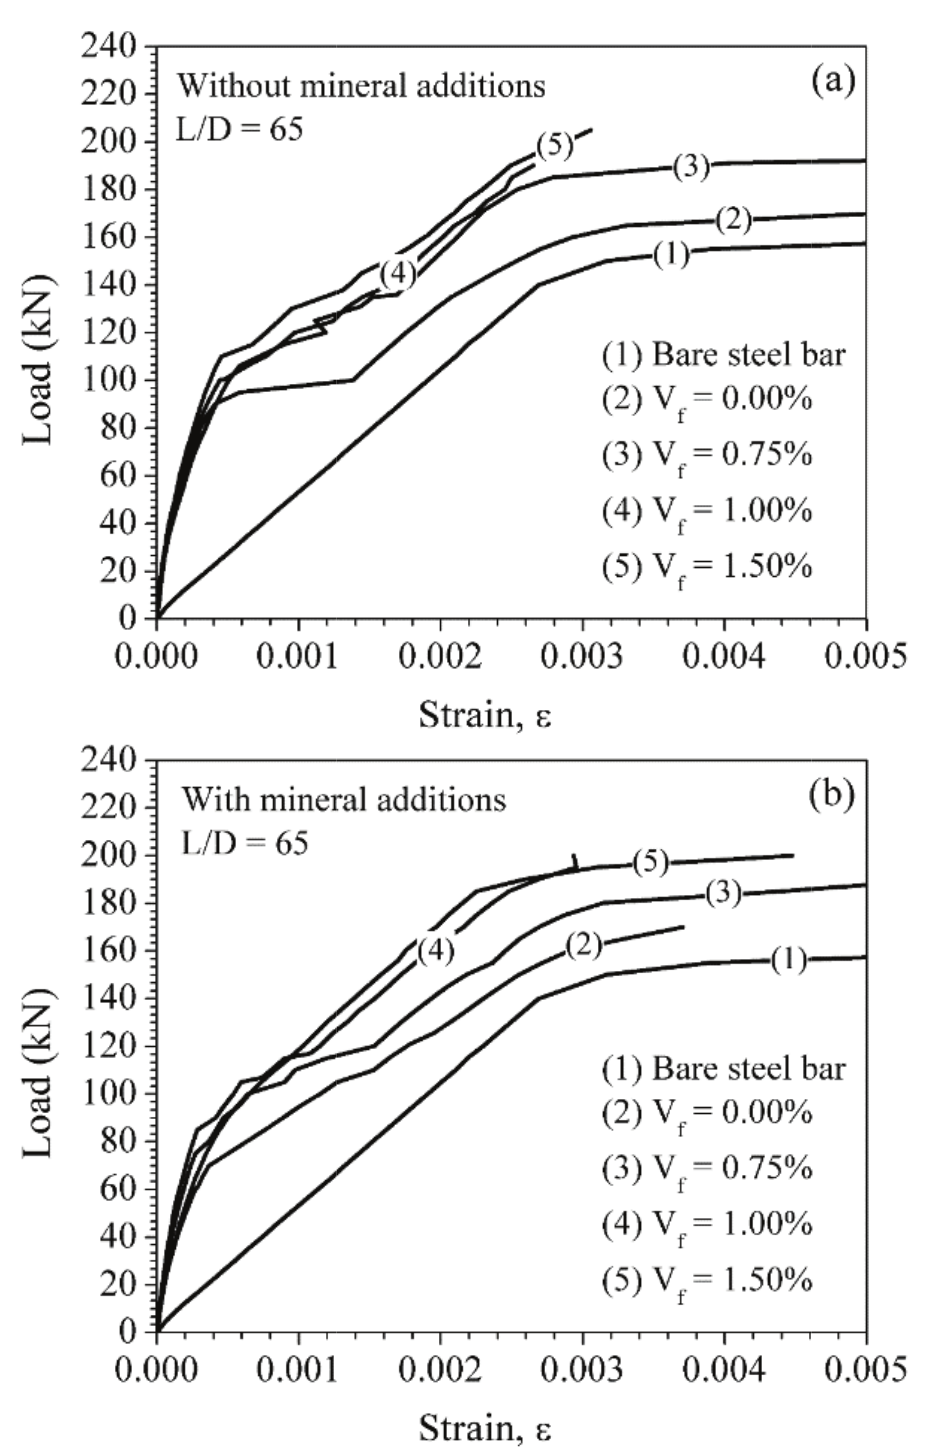
Figure 5
Influence of the F65 fiber content on the load–strain relation of a tension specimen
Tension stiffening
The tension stiffening coefficient of the reinforced concrete () can be determined from the load–strain relationship of the tension specimen by applying Equation 1. In this equation, is the difference between the strain of the bare steel bar and the strain of the bar in the tension specimen at the same load, and is the same difference between strains, but measured in the first crack (Figure 1a), according Equation 1.
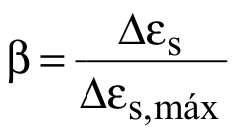 (1)
(1)where:
 - Tension stiffening coefficient (dimensionless);
 - Difference in strain between reinforcement steel and the tension specimen;
 - Difference between strains of steel bar and tension specimens when the first crack appears.
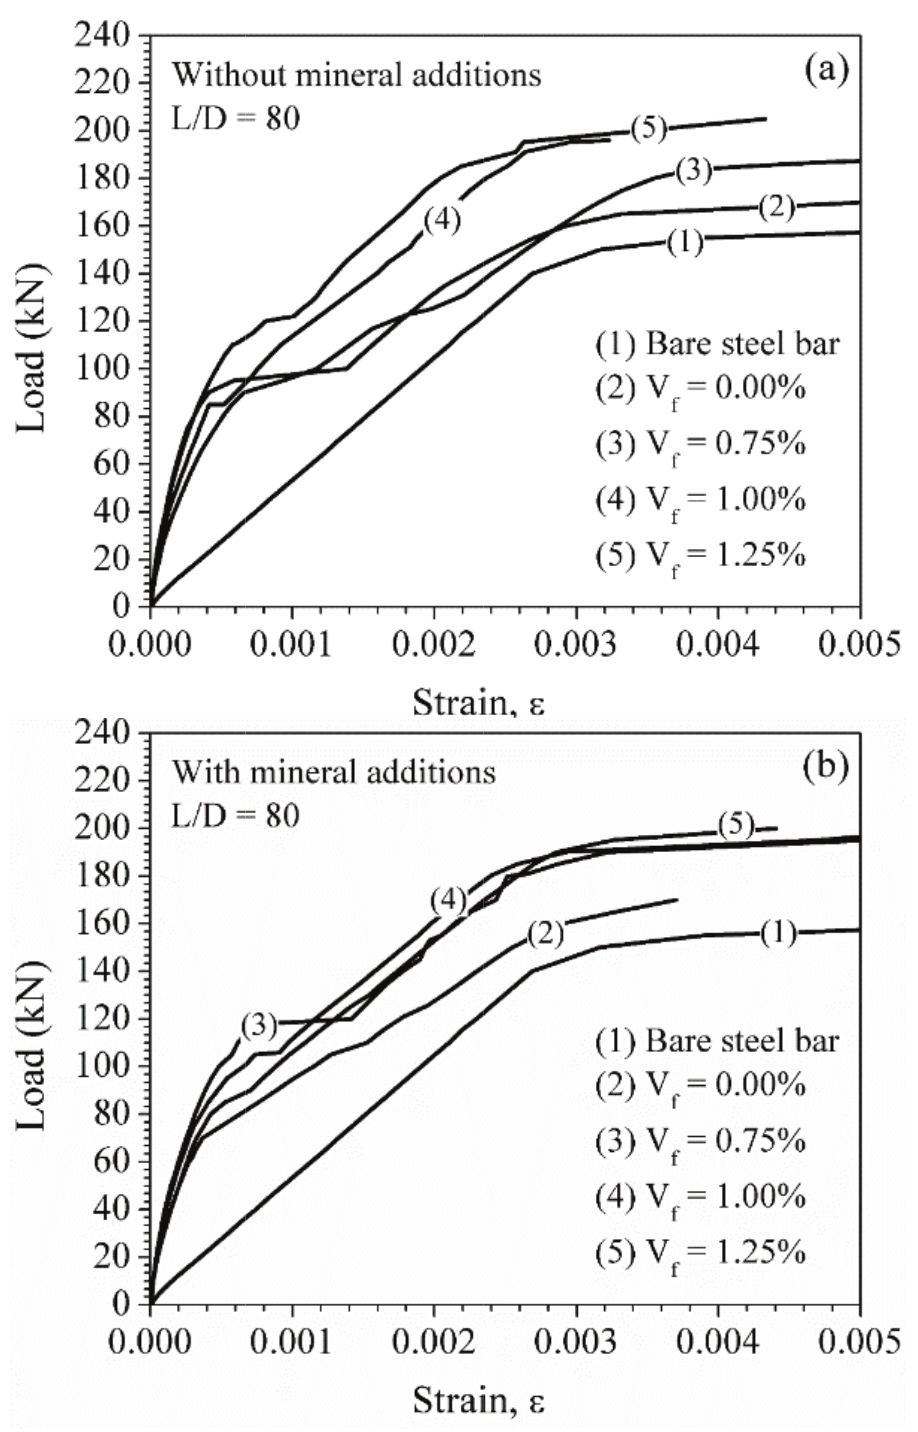
Figure 6
Influence of the F80 fiber content on the load–strain relation of a tension specimen
The strain along the length of the steel bar embedded in the concrete prism was assumed to have uniform distribution, and it was obtained from the averaged value of the three strain gages glued to the bar. Although this was a simplification, the errors generated were not significant (Fischer & Li, 2002; Fantilli, Mihashi, & Vallini, 2005). This methodology was initially applied to tension specimens made of plain concrete (Figure 7), and its viability was evaluated by comparing these results with the analytical equations available in the literature to evaluate tension stiffening, that is: Belarbi and Hsu (1994) [1], Collins and Mitchell (1991) [2], Architectural Institute of Japan (AIJ, 1986) [3], Fédération Internationale du Béton (FIB, 2012) [4], and Fields and Bischoff (2004) [5] for a stabilized cracking stage with long-term loading. This
comparison showed that the values of tension stiffening obtained from both tension specimens with and without mineral additions were in agreement with the values generated by the analytical equations mentioned.
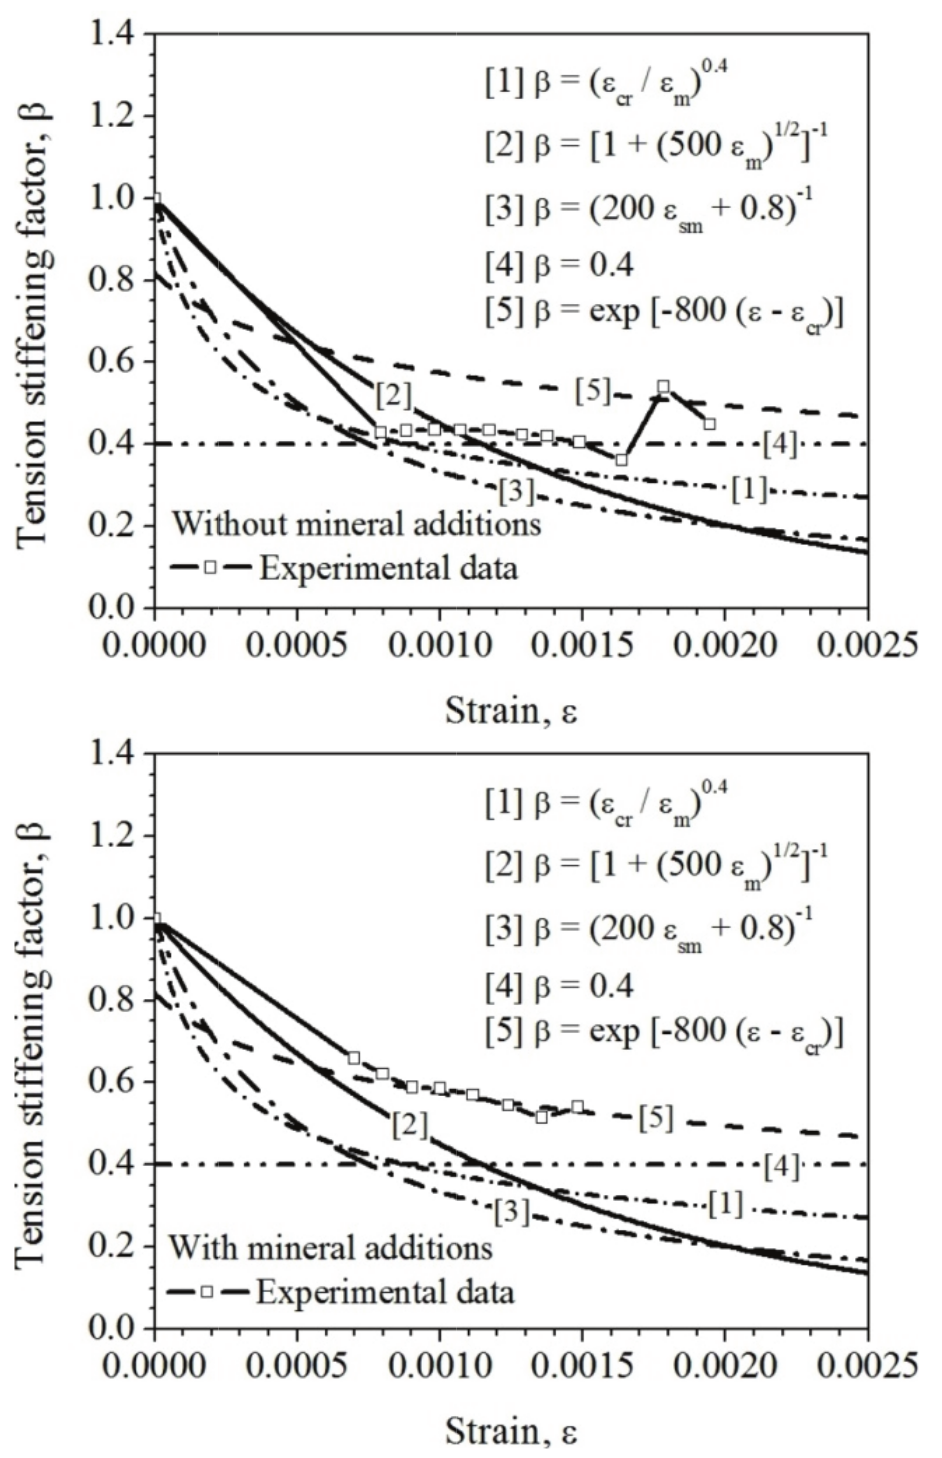
Figure 7
Comparison of the tension stiffening coefficients of plain concrete obtained from the tests with the analytical equations presented in the literature
Proposed empirical model to estimate the tension stiffening coefficient for SFRC
To estimate the tension stiffening coefficient for SFRC, an empiric model based on regression analysis was proposed using the following parameters: strains () and the reinforcement index () obtained by multiplying the fiber aspect ratio () by the fiber content (). For an overview of the tension stiffening parameters and modeling approaches, refer to Fields and Bischoff (2004). The average curves of the tension stiffening coefficient versus the strain bar obtained from the tests were used without making any distinction regarding the presence of mineral additions because they did not significantly change the tension stiffening of the concrete. Linear regressions were performed over individual average curves obtained from the tests to obtain the coefficients of the linear model that best describes the experimental behavior. For SFRC, the reinforcement index should be included in the
regression model to account for the influence of the steel fibers on tension stiffening.
Figure 8 shows the proposed model for plain concrete and compares it to the average curves obtained from the tests. This comparison shows good agreement between the average curve and the proposed model, which is given by Equation 2.
 (2)
(2)
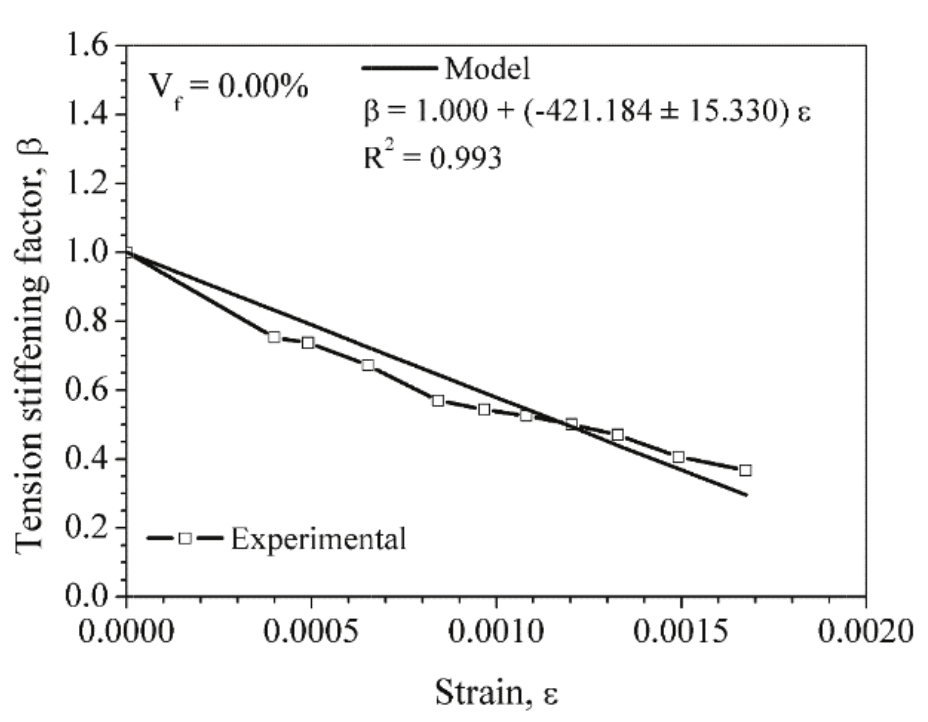
Figure 8
Proposed model to estimate the tension stiffening coefficient for plain concrete
Figure 9 shows the correlation between the slopes of the linear regression models for SFRC and the fiber reinforcement index, which results in Equation 3, which represents the model for estimating the tension stiffening coefficient for SFRC. In this case, the maximum tension stiffening coefficient is also limited to 1.00.
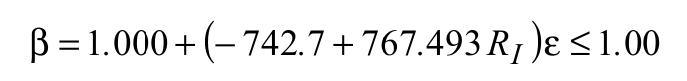 (3)
(3)
Figure 9
Correlation between tension stiffening and fiber reinforcement index
Figure 10 shows a comparison between the proposed model and the experimental average tension stiffening for concretes reinforced with F65 fibers. A good agreement between the experimental data and the proposed model was observed. As the fiber content increases, the tension stiffening coefficient also increases. Moreover, for concretes with fiber contents of 1.50%, the tension stiffening coefficient does not show any decrease. On the other hand, it increases suddenly as the strain increases. Thus, with this fiber content, the SFRC shows an elastic-plastic behavior in tension. For fiber contents of less than 1.50%, a decrease in the tension stiffening coefficient with an increase of the concrete strain was observed, but this decrease was much less than that observed for plain concrete.
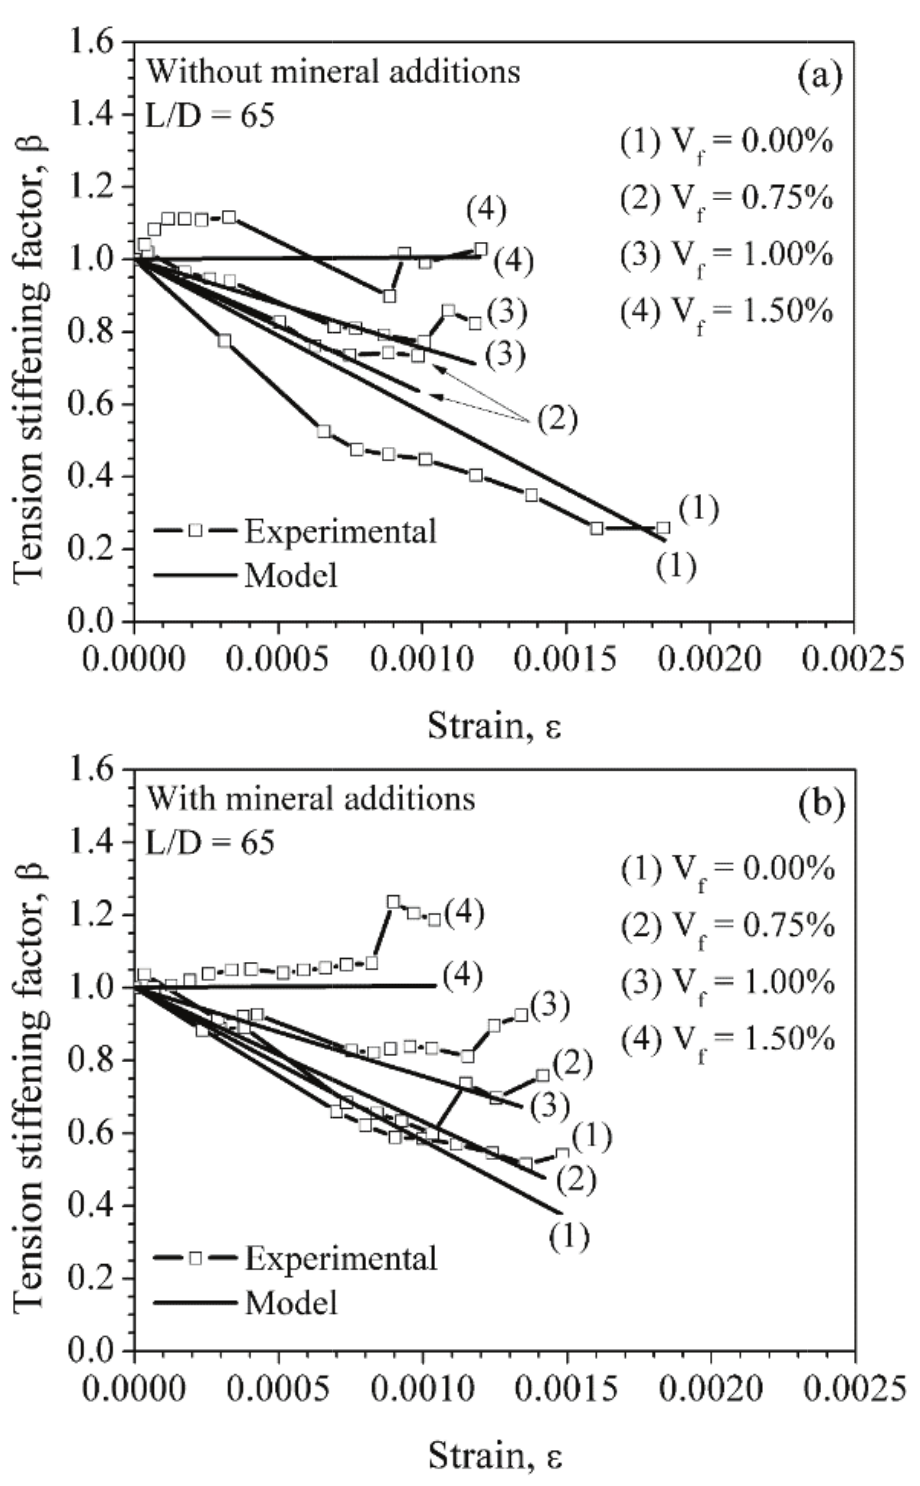
Figure 10
Influence of the F65 fiber content on the average tension stiffening coefficient
Figure 11 shows a comparison between the proposed model and an experimental average tension stiffening for concretes reinforced with F80 fibers. A good agreement between the experimental data and the proposed model was found. Like the concrete reinforced with an F65 fiber content of 1.50%, the SFRC with an F80 content of 1.25% also showed an increase in the tension stiffening coefficient with increasing concrete strain. Thus, the SFRC also shows an elastic-plastic behavior in tension. For fiber contents of less than 1.25%, a decrease in the tension stiffening coefficient with increasing concrete strain was found, but this decrease was also much less than that observed for plain concrete.
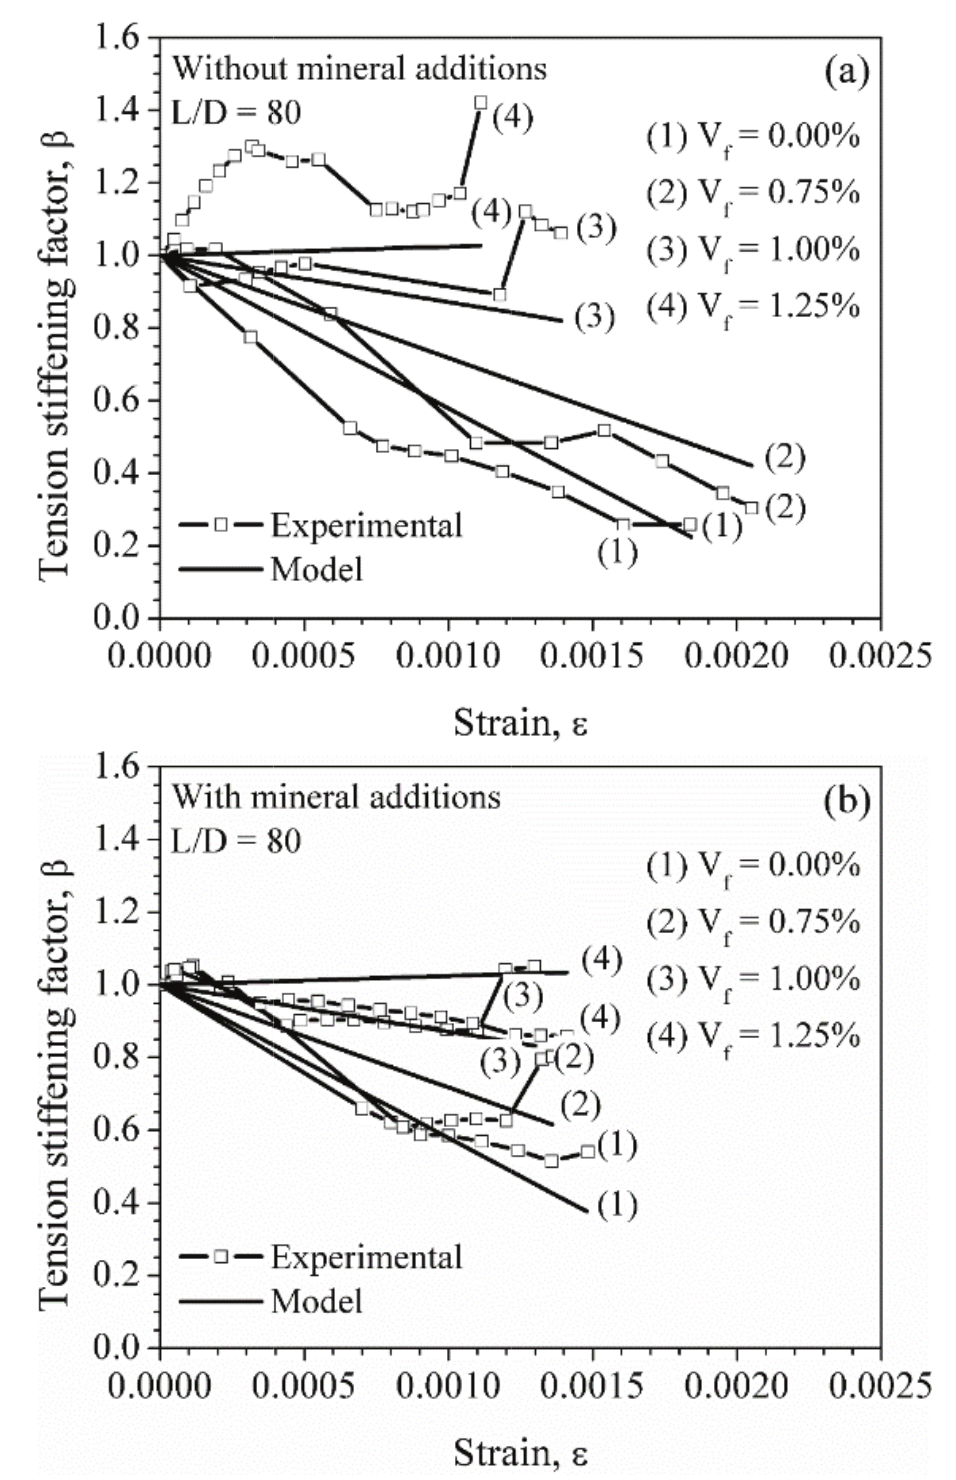
Figure 11
Influence of the F80 fiber content on the average tension stiffening coefficient
Comparing the results obtained for both types of fibers, a similar behavior in the tension stiffening for concretes reinforced with the same reinforcement index of the fibers is observed. Thus, if steel fibers with a greater aspect ratio are used, it is possible to use a lower fiber content because the reinforcement index remains constant. In addition, SFRCs with a reinforcement index greater than 0.60 show elastic-plastic behavior in tension.
The hardening after the first crack of the matrix occurred for the specimens with the largest fiber contents, that is, 1.50% F65 fibers and 1.25% F80 fibers. In both cases, the reinforcement index of the fibers was approximately the same (RI = 1.00). It was also observed that the mineral additions did not significantly change the tension stiffening of the SFRC, which suggests the possibility of a partial substitution of the cement by fly ash.
Conclusion
The following conclusions can be obtained from the experimental tests conducted in this paper:
1. The crack widths showed a noticeable reduction due to the addition of fibers, with a greater reduction for greater fiber contents. In some cases, this reduction reached 75% compared to the average crack widths in tension specimens made of plain concrete.
2. SFRC shows an increase in tension stiffening compared to plain concrete, confirming the ability of fibers to carry tension through cracks and to improve the stiffness of the reinforced concrete members. For SFRCs with a fiber reinforcement index greater than 0.60, an elastic-plastic behavior in tension was observed.
3. No influence on the tension stiffening of SFRC was observed due to the mineral additions. It is suggested that the replacement of 30% of the cement by fly ash is possible without reducing the tensile behavior of SFRC. Other mechanical properties were only slightly influenced by the addition of fly ash.
4. There is little information about the calculation of crack width in reinforced concrete members subjected to axial tension with steel fibers. Thus, the empirical model of the tension stiffening coefficient shown in this paper, in conjunction with the FIB (2012) model to predict crack width in plain concrete, can be useful to predict the design crack width for the serviceability state of concrete structures reinforced with steel fibers.
Acknowledgements
The authors would like to thank Higher Education Personnel Improvement Coordination (Capes – Brasil) for their financial support of this research and the Brazilian company Furnas Centrais Elétricas S.A. for making available their laboratories and technicians to carry out this research.
References
Abrishami, H. H., & Mitchell, D. (1997). Influence of steel fibers on tension stiffening. ACI Structural Journal, 94(6), 769-776.
American Concrete Institute. (2005). ACI 224.2R-92 – Cracking of concrete members in direct tension. Detroit, MI: ACI.
Architectural Institute of Japan. (1986). Recommendations for design and construction of partially prestressed concrete (class II) structures. Tokyo, JP: AIJ.
Belarbi, A., & Hsu, T. T. C. (1994). Constitutive laws of concrete in tension and reinforcing bars stiffened by concrete. ACI Structural Journal, 91(4), 465-474.
Bischoff, P. H. (2001). Effects of shrinkage on tension stiffening and cracking in reinforced concrete. Canadian Journal of Civil Engineering, 28(3), 363-374.
Choi, C.-K., & Cheung, S.-H. (1996). Tension stiffening model for planar reinforced concrete members. Computers and Structures, 59(1), 179-190.
Collins, M. P., & Mitchell, D. (1991). Prestressed concrete structures. Englewood Cliffs, NJ: Prentice-Hall.
Deluce, J. R., & Vecchio, F. J. (2013). Cracking behavior of steel fiber-reinforced concrete members containing conventional reinforcement. ACI Structural Journal, 110(3), 481-490.
Elfgren, L., & Noghabai, K. (2002). Tension of reinforced concrete prisms, Bond properties of reinforcement bars embedded in concrete tie elements, Summary of a RILEM round-robin investigation arranged by TC 147-FMB “Fracture Mechanics to Anchorage and Bond”. Materials and Structures, 35(6), 318-325.
Fantilli, A. P., Mihashi, H., & Vallini, P. (2005). Strain compatibility between HPFRCC and steel reinforcement. Materials and Structures, 38(4), 495-503.
Fédération Internationale du Béton. (2012). Model code 2010: final draft. Switzerland, CH: International Federation for Structural Concrete.
Fields, K., & Bischoff, P. H. (2004). Tension stiffening and cracking of high strength reinforced concrete tension members. ACI Structural Journal, 101(4), 447-456.
Fischer, G., & Li, V. C. (2002). Influence of matrix ductility on tension-stiffening behavior of steel fiber reinforced engineered cementitious composites (ECC). ACI Structural Journal, 99(1), 104-111.
Floegl, H., & Mang, H. A. (1982). Tension stiffening concept based on bond slip. Journal of the Structural Division, 108(12), 2681-2701.
Gupta, A. K., & Maestrini, S. R. (1990). Tension-stiffness model for reinforced concrete bars. Journal of Structural Engineering, 116(3), 769-790.
Japan Society of Civil Engineers. (1984). JSCE-SF4 – Method of tests for flexural strength and flexural toughness of steel fiber reinforced concrete. Tokyo, JP: JSCE.
Lee, S., Cho, J., & Vecchio, F. J. (2013). Tension-stiffening model for steel fiber-reinforced concrete containing conventional reinforcement. ACI Structural Journal, 110(4), 639-648.
Lorrain, M., Maurel, O., & Seffo, M. (1998). Cracking behavior of reinforced high-strength concrete tension ties. ACI Structural Journal, 95(5), 626-635.
Wu, Z., Yoshikawa, H., & Tanabe, T. (1991). Tension stiffness model for cracked reinforced concrete. Journal of Structural Engineering, 117(3), 715-732.
Yang, Y., Walraven, J. C., & Den Uijl, J. A. (2009). Combined effect of fibers and steel rebars in high performance concrete. Heron, 54(2-3), 205-224.
Zhang, J., & Li, V. C. (2001). Influences of fibers on drying shrinkage of fiber-reinforced cementitious composite. Journal of Engineering Mechanics, 127(1), 37-44.
Author notes
dlaraujo@ufg.br