Estatística
Comparisons of multivariate GR&R methods using bootstrap confidence interval
Comparações de métodos GR&R multivariados usando intervalo de confiança bootstrap
Comparisons of multivariate GR&R methods using bootstrap confidence interval
Acta Scientiarum. Technology, vol. 38, no. 4, pp. 489-496, 2016
Universidade Estadual de Maringá

This work is licensed under Creative Commons Attribution-NonCommercial-NoDerivs 3.0 International.
Received: 26 September 2015
Accepted: 17 March 2016
Abstract: This paper aimed to compare the performance of multivariate GR&R (gage repeatability and reproducibility) studies based on PCA (principal component analysis) and Manova (multivariate analysis of variance) methods. To estimate the multivariate gauge index, geometric and arithmetic means have been implemented with and without weighting strategies. Bootstrap confidence interval based on BCa (bias-corrected and accelerated) method has been adopted to determine multivariate gauge index adequacy. This confidence interval was calculated for the mean of univariate gauge indices estimated from each quality characteristic. The result analyses have shown that weighted approaches provided the best estimates of gauge index in multivariate GR&R studies.
Keywords: measurement system analysis, repeatability and reproducibility, multivariate analysis of variance, principal component analysis.
Resumo: Este artigo teve objetivo de comparar o desempenho de estudos GR&R (gage repeatability and reproducibility) multivariados baseados nos métodos PCA (principal component analysis) e Manova (multivariate analysis of variance). As médias aritmética e geométrica com e sem ponderação foram implementadas para estimar os índices de medição multivariados. Para determinar a adequação dos índices de medição multivariados, foi adotado o intervalo de confiança bootstrap BCa (bias-corrected and accelerated). Esse intervalo de confiança foi calculado para a média dos índices de medição univariados estimados de cada característica da qualidade. As análises dos resultados mostraram que as abordagens ponderadas apresentaram melhores estimativas dos índices de avaliação em estudos GR&R com múltiplas variáveis.
Palavras-chave: análise de sistemas de medição, repetitividade e reprodutividade, análise multivariada de variância, análise de componentes principais.
Introduction
In any measurement process, at least part of the variation is due to the measurement system. It is unlikely that repeated measurements of any measurand results in exactly the same value (Senol, 2004; Majeske, 2008; Woodal & Borror, 2008; Automotive Industry Action Group [AIAG], 2010; Al-Refaie & Bata, 2010; Wang & Chien, 2010; Peruchi, Balestrassi, Paiva, Ferreira, & Carmelossi, 2013). Measurement system analysis (MSA) is a set of statistical techniques for ensuring that the measurement system variability is not significant in relation to manufacturing process variation. GR&R (gage repeatability and reproducibility) is the most common study in MSA to assess the precision of measurement systems ( Peruchi, Paiva, Balestrassi, Ferreira, & Sawhney, 2014; Pereira, Peruchi, Paiva, Costa, & Ferreira, 2016). Repeatability is the variation of the measuring instrument or equipment assessing the same unit (operator or with the same setup and the same period of time). Reproducibility determines the variability arising from different operators, set-ups or period of time (Burdick, Borror, & Montgomery, 2003; Polini & Turchetta, 2004; Awad, Erdmann, Shanshal, & Barth, 2009; Wu, Pearn, & Kotz, 2009; Erdmann, Does, & Bisgaard 2009; Kaija et al., 2010; Weaver, Hamada, Vardeman, & Wilson, 2012; Peruchi et al., 2013). A measurement system is deemed adequate for monitoring a particular application, if R&R variation is relatively smaller than manufacturing process variation (Majeske, 2012; Pereira et al., 2016).
In GR&R studies two methods are usually utilized: (i) analysis of variance (ANOVA); and (ii) the and R chart (Burdick et al., 2003; Wang & Chien, 2010). ANOVA is preferred due to its capacity of estimating the component of reproducibility from interaction between parts and operators. These methods are commonly applied to univariate cases; however, analysts often use more than one characteristic of the product to discriminate among different units (Burdick, Borror, & Montgomery, 2005). The analyst must consider the correlation structure among the characteristics to properly estimate the evaluation indices in these multivariate GR&R studies.
It is never possible to predict the exact values of variance components due to manufacturing and measurement variation in GR&R studies. Confidence intervals are used to quantify the uncertainty associated with the point estimation for each gauge variance component (Burdick et al., 2005). Wang and Li (2003) used Bootstrap method to obtain the confidence intervals of gauge variability when the control chart is used to find the point estimates. Wang and Chern (2012) evaluated the accuracy of the confidence interval for the circle-diameter with circular tolerances by using the Bootstrap method. In this particular research, the Bootstrap method has been applied upon univariate gauge capability indices in order to build confidence intervals. These confidence intervals were used as comparison criterion for evaluating performance of multivariate GR&R methods.
This article deals with repeatability and reproducibility studies applied to multivariate processes. Principal component analysis (PCA) and multivariate analysis of variance (Manova) are the most common multivariate methods used in such complex systems (Wang, 2013). The aim of this paper is to compare PCA and Manova methods with their variations to determine directions for practitioner conducting multivariate GR&R studies. The comparison criterion adopted in this research was the confidence intervals for the mean by BCa (bias-corrected and accelerated) bootstrap procedure of univariate evaluation indices of the measurement system. The results have shown that weighted approaches were the most effective strategies to calculate the evaluation index in multivariate GR&R studies.
Material and methods
In order to achieve the objective of this research, this section presents an overview of multivariate GR&R methods (Manova and PCA) and the bootstrap procedure to calculate the confidence interval. This was the criterion used to evaluate the performance of the multivariate evaluation indices of the measurement system. In the next section, three illustrative examples were assessed and some concerns about multivariate index estimates were provided. Last section addressed the main findings of this research.
GR&R based on multivariate analysis of variance
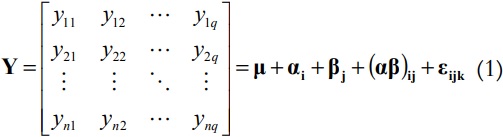
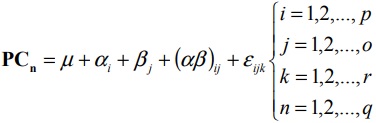
For GR&R studies considering two factors with interaction for q multiple quality characteristics, the model is given by Equation 1 (Majeske, 2008; Peruchi et al., 2014):
 (1)
(1)where:
Y = (Y1, Y2, …, Yq) and μ = (μ1, μ2, …, μq) are constant vectors;
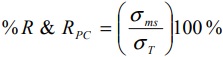
αi~N (0, Σα), βj~N (0, Σβ), αβij~N (0, Σαβ), and εijk~N (0, Σε) are random vectors statistically independent of each other. Variance components in Equation 1 can be estimated using the Manova method proposed by Majeske (2008). These variance components are estimated for obtaining an index that evaluates acceptance of the measurement system, called %R&Rm (variation percentage due to repeatability and reproducibility). The index %R&Rm, or G index for this Manova method, can be calculated by Equation 2:
 (2)
(2)where:
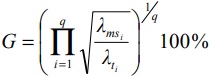
λms and λt are eigenvalues extracted from the variance-covariance matrices for measurement system () and total variation (), respectively. %R&Rm less than 10% requires that the measurement system is deemed acceptable. If the index lies in a marginal region between 10 and 30%, the measurement system may be acceptable depending on the application, the measuring device cost, repair cost, or other factors. Moreover, the measurement system is considered unacceptable if the index exceeds 30% (Li & Al-Refaie, 2008; Woodall & Borror, 2008; AIAG, 2010).
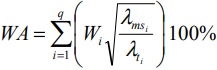
To estimate the evaluation index of the measurement system, Equation 2 applies geometric mean on ratio. This strategy does not determine the utmost importance for the most significant pairs of eigenvalues extracted from the variance-covariance matrices. Thus, Peruchi, Paiva, Balestrassi, Ferreira, and Sawhney (2014) adopted a weighted approach on to propose four new evaluation indices for multivariate measurement systems (%R&Rm). The new indices WAt, WAms, WGt and WGms can be estimated using Equations 3 and 4.
 (3)
(3)
 (4)
(4)where:
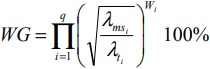
Wi ∀i=1,…,q determines the explanation percentage of the eigenvalues extracted from either or . The WAt and WAms indices are calculated by the weighted arithmetic mean in Equation 3. On the other hand, the WGt and WGms indices are estimated using weighted geometric mean according to Equation 4.
GR&R based on principal component analysis
According to Wang and Chien (2010) and Peruchi, Balestrassi, Paiva, Ferreira, and Carmelossi (2013), to deal with q multiple quality characteristics in GR&R studies, PCA is an alternative method to Manova. The model that represents a multivariate GR&R study using PCA is given by Equation 5:
 (5)
(5)where:
PCn are scores of principal components PC1, PC2, ..., PCq;
μ is a constant;
αi, βj, αβij and εijk are independent normal random variables with zero means and variances σα2, σβ2, σαβ2 and σε2 respectively. The %R&Rm evaluation index of the measurement system is obtained by Equation 6 through the PCA method. More details on how to obtain the scores of principal components and how to evaluate the measurement system using the PCA method, see Wang (2013) and Wang and Chien (2010). The measurement system acceptance criteria are the same as described in the previous subsection.
 (6)
(6)Wang and Chien (2010) compared the PCA method with two other methods for analyzing the measurement system. However, these authors performed individual analysis for each principal component. This methodology may not be appropriate since the individual analysis might provide different interpretations. When responses are highly correlated (e.g., %PC1 > 95%), the first principal component explains reasonably well measurement system’s variability. However, when the correlations between the responses are medium or low, additional principal components must be assessed, since the first principal component is incapable of explaining the entire variation of the original responses. Consequently, Peruchi et al. (2013) proposed a method for multivariate GR&R studies using weighted principal components (WPC). In this case, the model in Equation 5 is modified by weighting the scores of principal components based on their respective eigenvalues. The response vector to be analyzed in Equation 5 should be Equation 7:
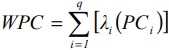 (7)
(7)or using the explanation percentage of each principal component as such, according Equation 8:
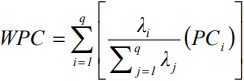 (8)
(8)The measurement system evaluation index using WPC method follows Equation 6, however, all computations are based on weighted scores of principal components.
Comparison criterion based on Bootstrap confidence interval
Bootstrap is a computational method for assigning accuracy measures of statistical estimates (Efron & Tibshirani, 1993). Confidence intervals is one of the areas that the bootstrap procedure has achieved greater success (Wehrens, Putter, & Buydens, 2000). According to Wang and Chern (2012), the standard method assumes μY(i) and SY(i) be the mean and standard deviation of the Y(i), with i = 1, 2, ..., B, where Y(i) is the ith Bootstrap sample data set and B is the number of Bootstrap samples. The bootstrap mean and standard deviation are calculated as such, according Equations 9 and 10:
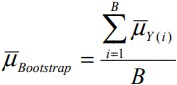 (9)
(9)
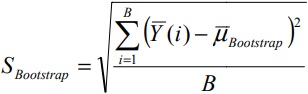 (10)
(10)Hence, a 100 (1-α)% confidence interval for μY(i) is Equation 11:
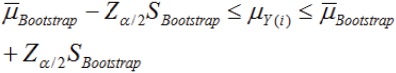 (11)
(11)where:
Zα/2 is the upper α/2 quartile of the standard normal distribution.
The bootstrap confidence interval (BCI) should not only reproduce results quite similar to statistical theoretical calculation but also provide adequate coverage probability. Bootstrap-t method presents reasonable theoretical coverage, but it tends to be unstable in practical situations. The percentile method is more stable, however it determines poor coverage properties. The BCa (bias-corrected and accelerated) method is an improved version of the previously mentioned ones. BCa considers both lack of symmetry in data distribution and adaptative shape when the statistics of interest varies (Efron & Tibshirani, 1993). The first two steps of BCa method are identical to the bias-corrected percentile method. In the third step, accelerated corrected percentile endpoints of the standard normal distribution are obtained by Equations 12 and 13 (Wang & Chern, 2012):
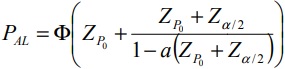 (12)
(12)
 (13)
(13)where:
, is calculated from the original sample with ith point deleted, and . Thus, a 100 (1-α)% confidence interval for μY using the BCa method is Equation 14:
 (14)
(14)As mentioned previously, BCa confidence interval of univariate gauge indices was the criterion for multivariate GR&R method adequacy. The algorithm to estimating these confidence intervals is given as follows:
I. Select parts, operators, number of replicates and, then collect the dataset;
II. Perform univariate GR&R study and estimate %R&R index for each response;
III. Using BCa method, generate a Bootstrap resample (B = 2000) from the univariate %R&R indices;
IV. Compute the confidence interval for the mean of %R&R index at the 95% confidence level using BCa method.
A multivariate GR&R method was deemed adequate if its gauge index, using either Equations 2 at 4 and 6, was estimated within the bootstrap confidence interval.
Results and discussion
Case 1: automotive body stamped-panel measurement system
Majeske (2008) presented an application of the automobile industry in which an analyst built a machine to measure four Y characteristics in a sheet steel panel. This study consisted of p = 5 parts, the operators o = 2, and r = 3 replicates. Adjusting the data to an ANOVA model, variance components for manufacturing process (part-to-part), measurement system, total variation, and the univariate index %R&R were estimated and stored in Table 1. More details on how to calculate %R&R using ANOVA method can be seen in Automotive Industry Action Group (AIAG, 2010).
Applying the proposed procedure for estimating the BCa confidence interval of %R&R indices, the first two steps have already been performed, as can be seen in Table 1. Then, 2000 bootstrap sample was generated from the %R&R indices as suggested by Wang and Chern (2012) and Efron and Tibshirani (1993). After that, the bootstrap confidence interval [10.86 and 20.42%] based on BCa method was built using Equations 12 at 14. These BCa confidence intervals have been estimated by using Matlab® software. Eventually, variance-covariance matrices (Manova method) and standard deviation based on scores of principal components (PCA method) for manufacturing process (part-to-part), measurement system, and total variation were estimated and stored in Table 2.
| Source | Y1 | Y2 | Y3 | Y4 | BLCL | BUCL |
| Part-to-part | 0.018 | 0.252 | 0.208 | 0.986 | ||
| Measurement System | 0.001 | 0.006 | 0.005 | 0.008 | ||
| Total Variation | 0.019 | 0.258 | 0.213 | 0.995 | ||
| %R&R | 22.20 | 15.66 | 15.09 | 9.26 | 10.86 | 20.42 |
%R&Rm indices based on Manova were calculated by extracting eigenvalues from variance-covariance matrices, in Table 2, using Equatons 2 at 4. %R&Rm indices using PCA method were obtained by standard deviation related to either scores or weighted scores of principal components, according to Equation 6. Additionally, Figure 1 illustrates the multivariate evaluation indices and the BCa confidence intervals estimated from case 1. The multivariate indices calculated by Manova presented estimates within the bootstrap confidence interval [10.86; 20.42], using both simple geometric mean (G index) and weighted approaches for arithmetic and geometric means (WAt, WGt, WAms and WGms indices). Through the PCA method, the principal components PC1, PC2 and PC3 together account for 99% explanation of the original variables. PC1 and PC2 estimated within the BCI, but PC3 (%R&Rm = 9.6%) was estimated outside BCI. Wang and Chien (2010) recommended evaluating components representing at least 95% of explanation, so this approach was deemed failed. Through the weighted arithmetic mean of the principal component scores, WPC adequately estimated the multivariate index of the measurement system.
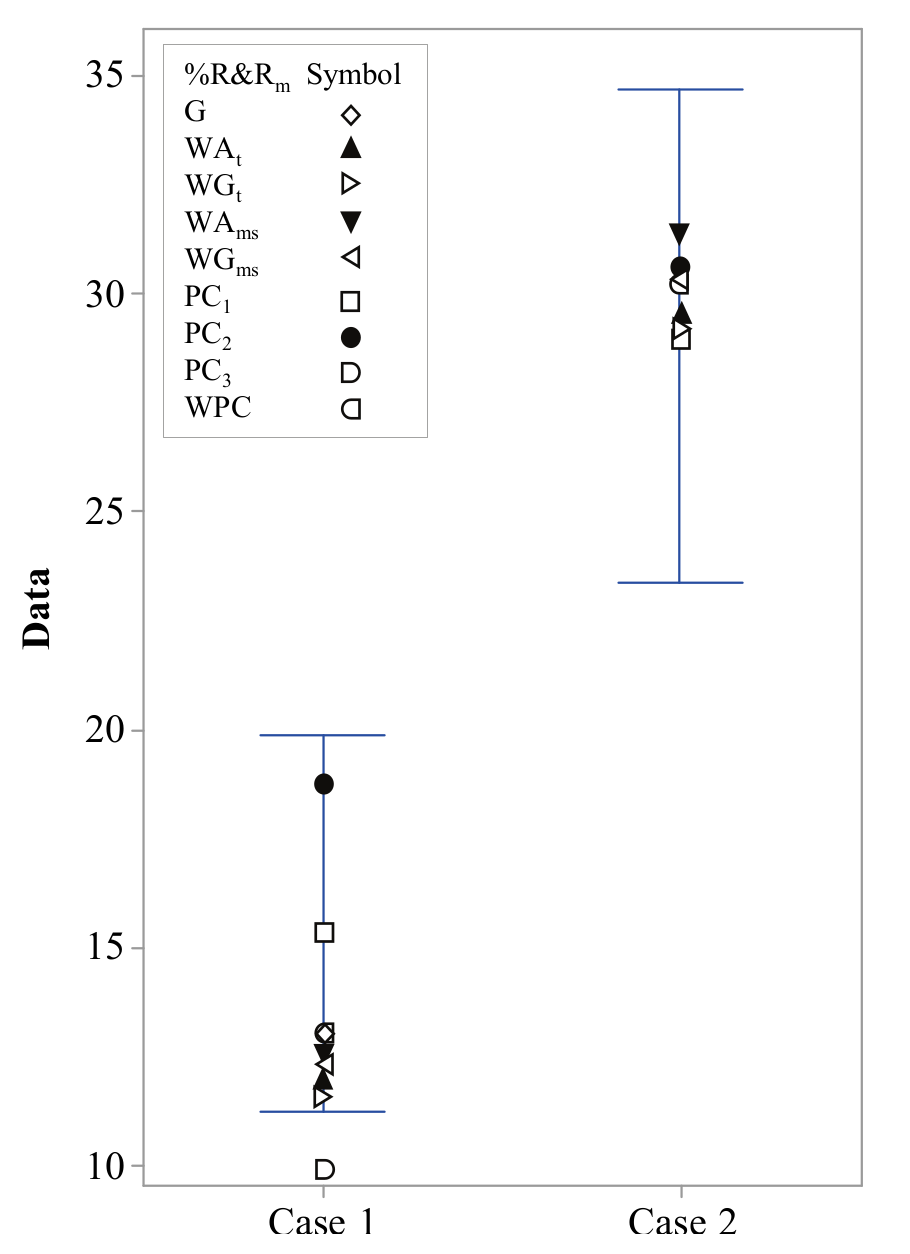
Figure 1
Multivariate gauge indices and bootstrap confidence intervals for cases 1 and 2; Source: the authors
| Source | Manova | PCA | |||||||
| G | WAt | WGt | WAms | WGms | PC1 | PC2 | PC3 | WPC | |
| Part-to-part | 3.040 | 1.194 | 0.413 | 21.880 | |||||
| Measurement system | 0.077 | 0.042 | 0.004 | 0.335 | |||||
| Total variation | 3.117 | 1.236 | 0.417 | 22.215 | |||||
| %R&Rm | 12.28a | 11.73a | 11.66a | 12.00a | 11.92a | 15.70b | 18.36b | 9.60 | 12.28b |
Case 2: turning process measurement system
A recent study by Peruchi et al. (2014) analyzed roughness measurements of work pieces made up of AISI 12L14 steel from a turning process. Five roughness parameters were evaluated in a multivariate GR&R study with p = 12 parts, o = 3 operators and r = 4 replicates. Similarly to the case 1, variance components for manufacturing process (part-to-part), measurement system, total variation, and the univariate index %R&R were estimated and presented in Table 3.
| Source | Ra | Ry | Rz | Rq | Rt | BLCL | BUCL |
| Part-to-part | 0.444 | 1.564 | 1.383 | 0.456 | 1.696 | ||
| Measurement system | 0.082 | 0.646 | 0.428 | 0.111 | 0.643 | ||
| Total Variation | 0.452 | 1.693 | 1.448 | 0.470 | 1.813 | ||
| %R&R | 18.22 | 38.18 | 29.52 | 23.66 | 35.47 | 22.66 | 35.36 |
The first two steps of the proposed procedure of bootstrap confidence intervals have already been conducted, as seen in Table 3. Then, 2000 bootstrap samples were generated from the %R&R indices. After that, the bootstrap confidence interval [22.66 and 35.36%] based on BCa method was built using Equations 12 at 14. Finally, variance-covariance matrices and standard deviation based on scores of principal components for manufacturing process (part-to-part), measurement system, and total variation were estimated and stored in Table 4.
| Source | Manova | PCA | ||||||
| G | WAt | WGt | WAms | WGms | PC1 | PC2 | WPC | |
| P | 2.045 | 0.822 | 8.656 | |||||
| MS | 0.619 | 0.262 | 2.743 | |||||
| T | 2.137 | 0.863 | 9.080 | |||||
| %R&Rm | 44.64 | 29.30a | 29.12a | 30.92a | 30.23a | 28.97b | 30.31b | 30.21b |
%R&Rm indices based on Manova were calculated by extracting eigenvalues from variance-covariance matrices, in Table 4, using Equations 2 at 4. %R&Rm indices using PCA method were obtained by standard deviation related to either scores or weighted scores of principal components, according to Equation 6. Figure 1 also shows the multivariate evaluation indices and the BCa confidence intervals estimated from case 2. Based on Manova method, the result using G index (%R&Rm = 44.64%) showed that simple geometric mean was unable to estimate the multivariate index within the bootstrap confidence interval [22.66 and 35.36%]. Nevertheless, the weighted approaches (WAt, WGt, WAms and WGms indices) presented satisfactory results to classify the measurement system. Using PCA method, similar performance was observed for estimating the multivariate evaluation indices. PC1 and PC2 represented 98.6% explanation of the original variables and estimated the multivariate index within the confidence interval. As seen in Table 4, WPC index has also been effective classifying the measurement system.
Case 3: simulated data analysis
Peruchi et al. (2013) presented a simulation study for multivariate GR&R using the same setup in Majeske (2008). The authors simulated 15 scenarios considering several correlation structures for Ys and different types of measurement systems. Assessing this dataset using ANOVA method, univariate indices were estimated to four quality characteristics at each scenario. Table 5 shows the %R&R indices and the bootstrap confidence interval obtained by the proposed procedure.
| Scenario | Univariate (%R&R) | BCI | ||||||
| S | MS | Corr. | Y1 | Y2 | Y3 | Y4 | BLCL | BUCL |
| S1 | UN | VL | 49.9 | 39.3 | 38.3 | 34.1 | 36.20 | 47.25 |
| S2 | UN | L | 42.2 | 55.5 | 44.3 | 39.8 | 41.00 | 52.70 |
| S3 | UN | M | 40.8 | 52.4 | 42.6 | 36.9 | 38.85 | 49.95 |
| S4 | UN | H | 45.3 | 33.2 | 41.2 | 47.8 | 35.20 | 46.15 |
| S5 | UN | VH | 31.1 | 34.9 | 37.8 | 41.1 | 32.78 | 39.55 |
| S6 | MA | VL | 15.8 | 14.1 | 13.7 | 10.2 | 11.08 | 14.95 |
| S7 | MA | L | 18.6 | 27.2 | 21.3 | 24.1 | 19.95 | 25.72 |
| S8 | MA | M | 15.5 | 23.7 | 17.0 | 14.6 | 15.20 | 22.02 |
| S9 | MA | H | 13.2 | 10.3 | 13.6 | 16.9 | 11.12 | 16.08 |
| S10 | MA | VH | 15.2 | 19.0 | 19.7 | 20.9 | 16.15 | 20.42 |
| S11 | AC | VL | 8.4 | 6.3 | 4.9 | 5.3 | 5.25 | 7.88 |
| S12 | AC | L | 5.6 | 4.6 | 6.7 | 5.4 | 4.85 | 6.38 |
| S13 | AC | M | 6.2 | 9.6 | 6.6 | 5.9 | 6.08 | 8.85 |
| S14 | AC | H | 5.7 | 4.5 | 5.9 | 7.3 | 4.85 | 6.95 |
| S15 | AC | VH | 6.5 | 7.6 | 8.6 | 9.2 | 6.78 | 8.90 |
Using Equations 2 at 4 and 6, multivariate gauge indices were also estimated for each scenario. Table 6 presents these indices obtained by Manova and PCA methods.
| Scenarios | Manova | PCA | |||||||
| S | G | WAt | WGt | WAms | WGms | PC1 | PC2 | PC3 | WPC |
| S1 | 10.78 | 31.62 | 18.28 | 48.84 | 48.51 | 52.24 | 19.55 | 15.32 | 39.71b |
| S2 | 13.30 | 36.50 | 30.28 | 45.42a | 44.94a | 53.84 | 10.48 | 20.91 | 52.84 |
| S3 | 11.32 | 38.27 | 31.45 | 45.76a | 45.51a | 47.79b | 11.21 | 17.65 | 47.87b |
| S4 | 28.15 | 42.95a | 42.20a | 44.33a | 44.14a | 44.38b | 8.94 | 44.03b | |
| S5 | 64.09 | 35.81a | 35.79a | 36.05a | 35.94a | 36.10b | 36.11b | ||
| S6 | 4.97 | 9.62 | 6.48 | 15.67 | 15.38 | 18.46 | 6.92 | 2.79 | 12.65b |
| S7 | 10.04 | 19.86 | 14.68 | 27.15 | 26.87 | 24.97b | 2.77 | 8.37 | 26.98 |
| S8 | 5.40 | 15.38a | 13.24 | 18.02a | 17.90a | 19.71b | 6.01 | 11.78 | 19.86b |
| S9 | 14.31a | 14.37a | 14.35a | 14.44a | 14.43a | 14.17b | 6.01 | 14.00b | |
| S10 | 47.23 | 16.95a | 16.94a | 17.33a | 17.12a | 18.63b | 18.63b | ||
| S11 | 4.08 | 5.00 | 4.41 | 6.75a | 6.49a | 6.41b | 6.39b | 4.59 | 4.10 |
| S12 | 2.01 | 4.70 | 3.53 | 6.18a | 6.13a | 6.69 | 1.15 | 2.25 | 6.89 |
| S13 | 2.28 | 6.07 | 5.32 | 7.05a | 7.00a | 7.87b | 1.95 | 5.75 | 8.04b |
| S14 | 7.22 | 6.58a | 6.56a | 6.65a | 6.63a | 5.99b | 3.34 | 5.91b | |
| S15 | 39.35 | 7.78a | 7.78a | 8.18a | 7.89a | 7.92b | 7.92b | ||
Figure 2 presents the multivariate evaluation indices and BCa confidence intervals of simulated scenarios with unacceptable measurement systems. Indices obtained by both Manova with simple geometric mean (G index) and PCA with individual analysis of principal components (PC1, PC2 and/or PC3 indices) have represented the worst estimates. Effectiveness was observed only in one (S9) and three (S5, S10 and S15) scenarios, respectively. Weighted Manova using eigenvalues extracted from total variation matrix determined moderate effectiveness. WAt and WGt estimated the multivariate evaluation index within BCI in seven (S4, S5, S8, S9, S10, S14 and S15) and six (S4, S5, S9, S10, S14 and S15) scenarios, respectively.
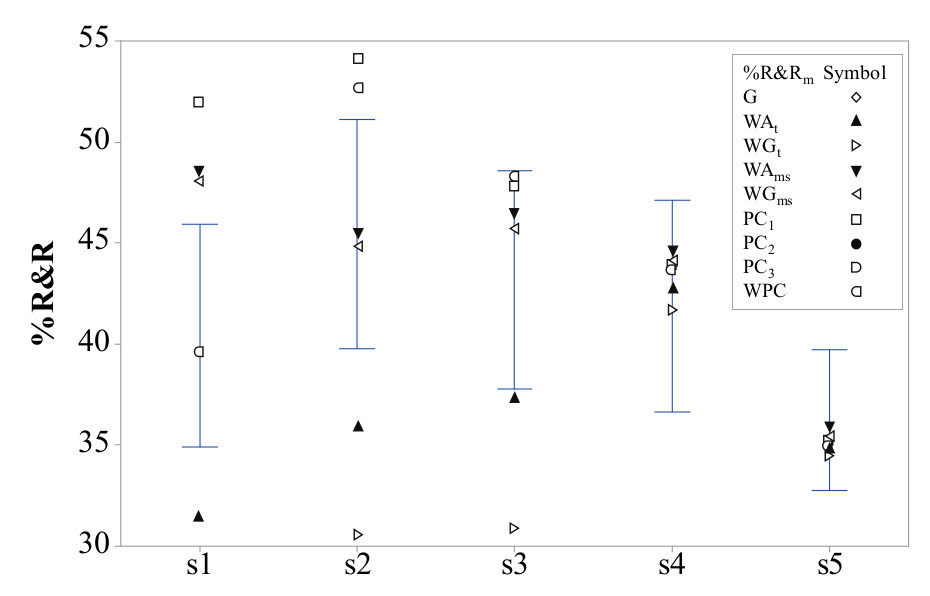
Figure 2
Multivariate gauge indices and bootstrap confidence intervals for S1-S5 scenarios; Source: the author
In this simulation study, the most effective approaches, in estimating the evaluation index of the measurement system, were weighted Manova based on eigenvalues extracted from measurement system matrix (WAms and WGms indices) and weighted principal components (WPC). According to 95% bootstrap confidence interval, WAms, WGms and WPC have failed only on three (S1, S6 and S7), three (S1, S6 and S7) and four (S2, S7, S11 and S12) scenarios, respectively.
Results and discussion
Taking into account the aforementioned results, Table 7 summarizes the performance of multivariate methods for distinct types of measurement systems and several correlation structures among quality characteristics. Comparing the multivariate indices to the bootstrap confidence interval, weighted approaches based on WAms, WGms and WPC have presented the best performances. WAms and WGms weight the ratio with the explanation percentage of the eigenvalues extracted from measurement system matrix (), using Equations 3 and 4. As seen in Table 7, this strategy showed better estimates than G, WAt and WGt indices. Accordingly, WPC weights each principal component with their respective eigenvalues using Equation 7. Table 7 determines that evaluating each principal component individually is inadequate.
| Cases 1, 2 and 3 | Manova | PCA | |||||||
| MS | Corr. | Evidence | G | WAt | WGt | WAms | WGms | PCi | WPC |
| UN | VL | S1 | a | ||||||
| L | S2 | a | a | ||||||
| M | S3 | a | a | a | |||||
| H | S4 and Case 2 | a | a | a | a | a | |||
| VH | S5 | a | a | a | a | a | a | ||
| MA | VL | S6 and Case 1 | a | ||||||
| L | S7 | ||||||||
| M | S8 | a | a | a | a | ||||
| H | S9 and Case 2 | a | a | a | a | a | |||
| VH | S10 | a | a | a | a | a | a | ||
| AC | VL | S11 | a | a | |||||
| L | S12 | a | a | ||||||
| M | S13 | a | a | a | |||||
| H | S14 | a | a | a | a | a | |||
| VH | S15 | a | a | a | a | a | a | ||
Nevertheless, it is essential to highlight that low or very low correlation structures among characteristics deserve special attention. In such multivariate scenario, even weighted approaches had presented poor performance. Therefore, practitioners should estimate the multivariate index carefully by using both Manova and PCA methods in order to ensure that the measurement system was properly classified. Furthermore, additional indices such as ‘ndc’ (number of distinct categories) and %P/T (percentage of precision-to-tolerance) may be calculated with the aim of determining properly the contribution of variation due to repeatability and reproducibility.
Conclusion
This article has investigated the multivariate analysis of measurement systems through repeatability and reproducibility studies. The main
contribution of this research was to develop an extensive comparison of multivariate GR&R studies using Manova and PCA methods. Differently from previous works (Peruchi et al., 2013; 2014), better estimates for confidence intervals were provided by bias-corrected and accelerated bootstrap procedure (BCa). The result analyses have shown that weighted approaches were the most effective strategies for estimating the evaluation index in multivariate measurement systems. As seen in Table 7, multivariate gauge indices using WAms, WGms and WPC obtained success in 13, 13 and 12 scenarios, respectively. Even though in few scenarios these strategies have failed, the estimates were quite close to the bootstrap confidence limits. Further study can be extended to other multivariate indices such as ‘ndc’ and %P/T. Moreover, expanded GR&R and nested GR&R applied to multivariate processes deserve special attention in future researches.
Acknowledgements
For their support in this research, the authors would like to thank the Brazilian agencies: Fapemig, Fapeg, CNPq and Capes.
References
Al-Refaie, A., & Bata, N. (2010). Evaluating measurement and process capabilities by GR&R with four quality measures. Measurement, 43(6), 842-851.
Automotive Industry Action Group. (2010). Measurement systems analysis: reference manual (4th ed.). Southfield, MI: Chrysler.
Awad, M., Erdmann, T. P., Shanshal, Y., & Barth, B. (2009). A measurement system analysis approach for hard-to-repeat events. Quality Engineering, 21(3), 300-305.
Burdick, R. K., Borror, C. M., & Montgomery, D. C. (2003). A review of methods for measurement systems capability analysis. Journal of Quality Technology, 35(4), 342-354.
Burdick, R. K., Borror, C. M., & Montgomery, D. C. (2005). Design and analysis of gauge R&R studies: Making decisions with confidence intervals in random and mixed ANOVA models. Alexandria, EG: ASA-SIAM Series on Statistics and Applied Probability.
Efron, B., & Tibshirani, R. J. (1993). An introduction to the bootstrap. New York City, NY: Chapman & Hall.
Erdmann, T. P., Does, R. J., & Bisgaard, S. (2009). Quality quandaries*: A gage R&R study in a hospital. Quality Engineering, 22(1), 46-53.
Kaija, K., Pekkanen, V., Mäntysalo, M., Koskinen, S., Niittynen, J., Halonen, E., & Mansikkamäki, P. (2010). Inkjetting dielectric layer for electronic applications. Microelectronic Engineering, 87(10), 1984-1991.
Li, M. H. C., & Al-Refaie, A. (2008). Improving wooden parts' quality by adopting DMAIC procedure. Quality and Reliability Engineering International, 24(3), 351-360.
Majeske, K. D. (2008). Approval criteria for multivariate measurement systems. Journal of Quality Technology, 40(2), 140-153.
Majeske, K. D. (2012). Two-sample tests for comparing measurement systems. Quality Engineering, 24(4), 501-513.
Pereira, R. B. D., Peruchi, R. S., Paiva, A. P., Costa, S. C., & Ferreira, J. R. (2016). Combining Scott-Knott and GR&R methods to identify special causes of variation. Measurement, 82, 135-144.
Peruchi, R. S., Balestrassi, P. P., Paiva, A. P., Ferreira, J. R., & Carmelossi, M. S. (2013). A new multivariate gage R&R method for correlated characteristics. International Journal of Production Economics, 144(1), 301-315.
Peruchi, R. S., Paiva, A. P., Balestrassi, P. P., Ferreira, J. R., & Sawhney, R. (2014). Weighted approach for multivariate analysis of variance in measurement system analysis. Precision Engineering, 38(3), 651-658.
Polini, W., & Turchetta, S. (2004). Test protocol for micro-geometric wear of sintered diamond tools. Wear, 257(3), 246-256.
Senol, S. (2004). Measurement system analysis using designed experiments with minimum α–β Risks and n. Measurement, 36(2), 131-141.
Wang, F. K. (2013). An assessment of gauge repeatability and reproducibility with multiple characteristics. Journal of Testing and Evaluation, 41(4), 651-658.
Wang, F. K., & Chern, H. L. (2012). Confidence intervals for two-dimensional data with circular tolerances in a gauge R&R study. Quality & Quantity, 46(1), 55-69.
Wang, F. K., & Chien, T. W. (2010). Process-oriented basis representation for a multivariate gauge study. Computers & Industrial Engineering, 58(1), 143-150.
Wang, F. K., & Li, E. Y. (2003). Confidence intervals in repeatability and reproducibility using bootstrap method. Total Quality Management, 14(3), 341-354.
Weaver, B. P., Hamada, M. S., Vardeman, S. B., & Wilson, A. G. (2012). A bayesian approach to the analysis of gauge R&R data. Quality Engineering, 24(4), 486-500.
Wehrens, R., Putter, H., & Buydens, L. M. (2000). The bootstrap: a tutorial. Chemometrics and Intelligent Laboratory Systems, 54(1), 35-52.
Woodall, W. H., & Borror, C. M. (2008). Some relationships between gage R&R criteria. Quality and Reliability Engineering International, 24(1), 99-106.
Wu, C. W., Pearn, W. L., & Kotz, S. (2009). An overview of theory and practice on process capability indices for quality assurance. International Journal of Production Economics, 117(2), 338-359.
Author notes
rogerioperuchi@ufg.br