Ciência, Tecnologia de Alimentos e Engenharia de Alimentos
Cake formation and the decreased performance of whey ultrafiltration
Formação de torta e redução de desempenho da ultrafiltração de soro de leite
Cake formation and the decreased performance of whey ultrafiltration
Acta Scientiarum. Technology, vol. 39, 05, pp. 517-524, 2017
Universidade Estadual de Maringá

This work is licensed under Creative Commons Attribution 4.0 International.
Received: 28 April 2015
Accepted: 26 January 2016
Abstract: Fouling in whey ultrafiltration is still a problem to be solved and modelling the permeate flux is still a challenge. A set of experiments of whey ultrafiltration was performed and it was demonstrated that the cake filtration model accurately represents the permeate flux over time despite exist more complex models to describe the phenomenon. In less than 10 s an irreversible resistance is established, and the cake starts to build up. It was observed changes in protein rejection in a range of 98 and 94% when a higher cake layer was set up, but it was not noticed strong evidences that the layer deposited on the membrane surface drives this change.
Keywords: flux modelling, membrane, dairy, pore blocking, membrane rejection.
Resumo: A colmatação da membrana durante a ultrafiltração de soro de leite ainda é um problema a ser resolvido e a modelagem do fluxo permeado permanece como um desafio. Uma série de experimentos de ultrafiltração de soro foi realizada e foi demonstrado que o modelo de torta de filtração pode representar o fluxo permeado com precisão, apesar de existirem modelos mais complexos para descrever o fenômeno. Em menos de 10 s, uma resistência irreversível é estabelecida e a torta começa a se formar. Foram observadas variações na rejeição de proteína de 98 a 94% quando uma espessa camada de torta foi depositada, mas não foram observadas fortes evidências de que essa camada de torta é a causa dessa variação na rejeição de proteína.
Palavras-chave: modelagem de fluxo, membrana, laticínios, bloqueio de poros, rejeição da membrana.
Introduction
Whey is the by-product of the cheese making process (Yee, Wiley, & Bao, 2007). Worldwide whey production is estimated at around 180 to 190 million tons year-1, but only 50% of this amount is processed (Baldasso, Barros, & Tessaro, 2011).
Flux decline with time is a major problem in ultrafiltration in the dairy industry (Rao, Grandison, & Lewis, 2006), including in whey processing. Ultrafiltration (UF) of whey is used to recover proteins from the by-products of cheese processing (Yee, Wiley, & Bao, 2009, El-Sayed & Chase, 2011).
Two points are essential for the success of any membrane separation process, and, thus, for recovery of proteins from whey by UF. The first point is related to the permeate flux because permeate flux is directly related to the production rate, and the filtration area required is estimated based on it. The second point rests on the selectivity of the membrane. In the UF of whey, the membrane must have high rejection of proteins, allowing the passage of water, salts and lactose to provide an effective separation. Thus, membrane rejection has a direct effect on protein recovery and is therefore economically important as well.
These two key points for the success of UF may be affected by membrane fouling used in the UF of whey. The fouling increases the filtration resistance, and thus reduces the permeate flux. This additional filtration resistance in UF is formed quickly due to the polarization concentration (Yee et al., 2009), causing a rapid decrease in permeate flux during the early period of filtration followed by a long and gradual flux decline towards a steady or nearly-steady-state limit value (Barros, Andrade, Mendes, & Peres, 2003). After polarization, the flux decline occurs when membrane pores are blocked by a rapid adsorption/deposition, whereas the long gradual flux decline is due to the accumulation of the retained particles over the membrane surface (Corbatón-Báguena, Vincent-Vela, Álvarez-Blanco, & Lóra-Garcia, 2013).
This layer of deposits can lead to a high concentration of solutes on the membrane surface and can change the permeation of solutes through the membrane and the membrane selectivity (Fane & Fell, 1987). Knowing the fouling mechanism is a key factor in avoiding fouling, which improves the commercial viability of the UF (Corbatón-Báguena et al., 2013) and membrane life (Nourbakhsh, Emam-Djomeh, Mirsaeedghazi, Omid, & Moieni, 2013).
The fouling could and also producing changes in selectivity (Chuang, Wu, & Wu, 2008) and improve the membrane rejection (Obermeyer, Kulozic, & Kessler, 1993, Tracey & Davis, 1994). On the other hand, this layer of deposits can lead to a high concentration of solutes on the membrane surface and can produce a higher permeation of solutes through the membrane, decreasing the membrane selectivity (Fane & Fell, 1987), but intense fouling in whey ultrafiltration could help the protein rejection?
Thus, understanding how the fouling phenomenon takes place helps to predict permeate flux and, consequently, in assessing the economic value of the process, this study evaluated the cake formation in ultrafiltration of whey and the relationship between this cake layer and the membrane rejection.
Material and methods
Whey
The feed solution was whey supplied by Relat S.A. (Brazil). The protein, lactose, ash and fat concentrations were 9.1, 59.1, 0.2 and 0.4 g L-1, respectively.
Strategy research
Different fouling rates were obtained when the whey was ultrafiltered under different operating conditions. A 22 experimental design with a central point was applied varying transmembrane pressure and cross-flow velocity. In sequence, it was evaluated the pore blocking models and membrane rejection associated with the filtration resistances.
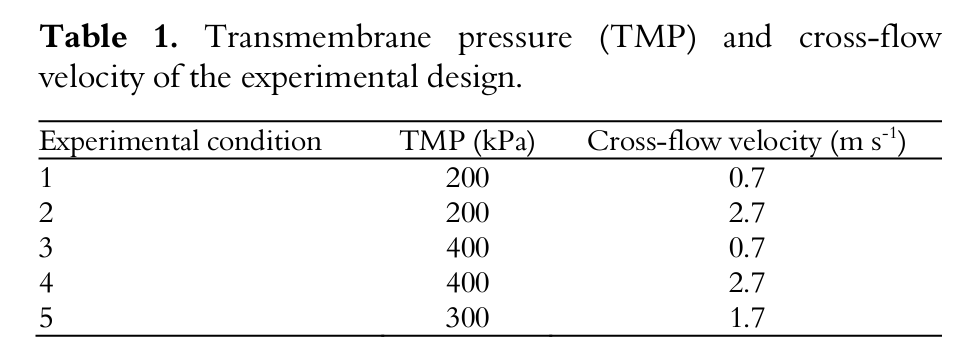
Experimental design
Table 1 shows the experimental design matrix with the pressures and cross-flow velocities applied. The experiments were conducted in duplicate on lateral points, and the central point was replicated three times, totaling 11 experimental assays. The experiments were performed in random order.
Experimental procedure
A commercial UF membrane (Koch Membrane Systems – 3838 - HFK 131) for the production of whey protein concentrate was used. The membrane has a 3.8-inch spiral-wound configuration, with an effective filtration area of 5.4 m2 and a semipermeable polyethersulfone (PES) layer on a polyester backing material. The molecular weight cutoff of the membrane was 10 kDa.
The experiment was carried out in a pilot module provided by WGM Systems (São Paulo State-Brazil). Figure 1 illustrates the ultrafiltration apparatus. The pilot module consisted of a stainless steel tank with capacity of 150 L from into which the whey was fed and driven by a multi-stage centrifugal pump through the membrane, separating the permeate from the retentate. Permeate and retentate were recirculated back to the feed tank to keep a constant feed concentration. The equipment had a tubular heat exchanger in the feed line and cold water (0 to 4ºC) was recirculated with the aid of a thermostat bath with a capacity of 100 L (Multi-Pão, Porto Alegre State/Brazil) to minimize the heat generated by the reject stream due to recirculation during the batch operation in order to maintain a temperature of 25 ± 1°C.
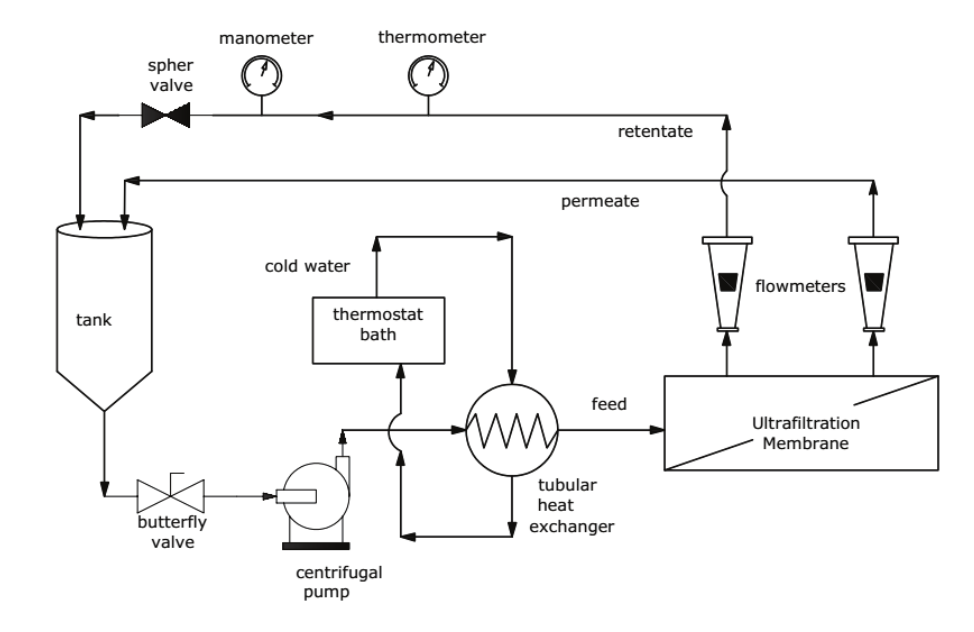
Figure 1.
Schematic diagram of pilot ultrafiltration equipment.
The transmembrane pressure was obtained by adjusting the pump flow rate and by closing the sphere valve located on the retentate pipeline. The cross-flow velocities were obtained by adjusting the retentate flow rates to 4, 2.5 and 1 m3 h-1. The flow rates recommended by the pilot-scale equipment manufacturer for 4 in diameter UF elements range between 1 and 5 m3 h-1. The cross-flow velocities were calculated dividing the flow rate by the free transversal area in the channel of the spiral membrane. The different cross-flow velocities resulted in Reynolds numbers of 1500, 3800 and 6100 and thus different turbulence levels in the retentate channel.
Analysis of the cake formation
To identify the fouling mechanism during whey ultrafiltration, the equations of Field, Wu, Howell, and Gupta (1995) (Table 2, Equation 1 through 4) were tested by a nonlinear regression optimization procedure using MATLAB® software (version R14). The constants of each pore blocking mechanism were estimated according to the four optimization runs performed sequentially for each operating condition (using the set J x t ). Details can be found in Brião and Tavares (2012).
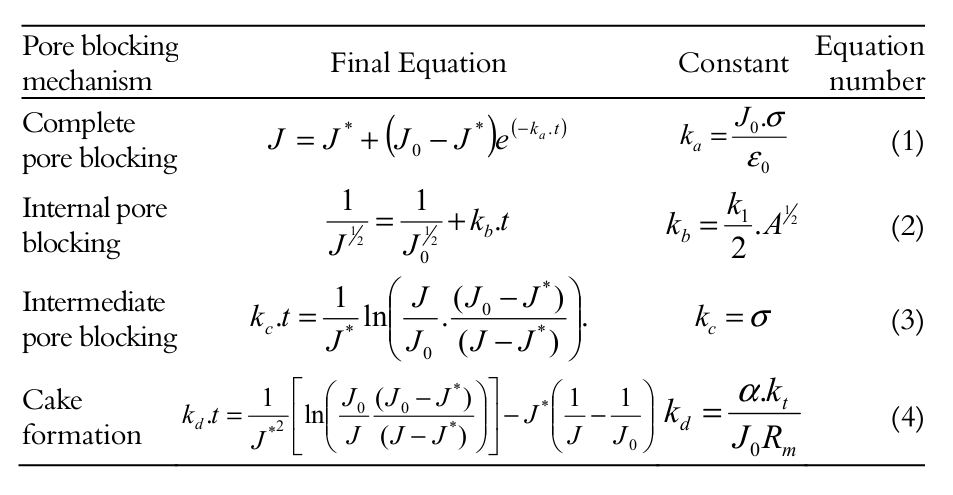
The term J * can be considered to be a critical flux which should not be exceeded if fouling is to be avoided. Where , , and are constants of the models. J and J0 are the permeate flux and the initial permeate flux (t = 0), respectively; 0 is the membrane surface porosity (cleaned membrane); is the constant of intermediate blocking model; A is the membrane surface area; is the blocked membrane area per unit permeate volume; is a parameter characterizing the fouling potential of the solution for the cake filtration model; is the cake filtration constant relating mass to volume; Rm is the cleaned membrane resistance.
In addition, it was calculated the filtration resistance according the Darcy’s Law (Equation 5) for laminar flow in the membrane pores as found elsewhere (Aydiner, Kaya, Gönder, & Vergili, 2010, Brião & Tavares, 2012, Baklouti, Kamoun, Ellouze-Ghorbel, & Chaabouni, 2013). The permeate viscosity was estimated as the water viscosity (0.001 Pa s).
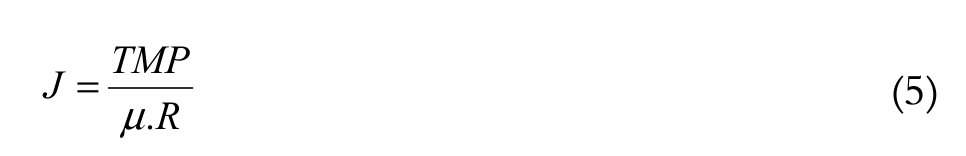 [Equation 5]
J is the permeate flux, TMP is the transmembrane pressure, is the viscosity of the permeate, and R is the total resistance. The total filtration resistance can be expressed by three variables: a) Rm (hydraulic resistance of the clean membrane); b) Rir (irreversible fouling or deposition onto the membrane, such as adsorption); c) Rr (the hydraulic resistance due to reversible phenomena, such as concentration polarization and/or reversible deposition).
Analytical
Whey, permeate, and retentate were characterized by their protein, lactose, ash, and fat concentrations. Protein was measured by Lowry’s method and lactose was determined by the 3,5 dinitrosalicylic acid (DNS) method as made by Brião and Tavares (2012). Ash was measured by the gravimetric method, and a Gerber butyrometer was used to measure fat concentration (Instituto Adolfo Lutz [IAL], 2008).
Data analysis
For the pore-blocking study, the sum of the squares of the residuals between numerical predictions and experimental data was the criterion used to establish the dominant fouling mechanism (Barros et al., 2003, Brião & Tavares, 2012).
Membrane rejection was compared using analysis of variance at a 5% significance level with a 95% confidence interval to show if the cake layer could make the protein rejection worse. Other statistical tests followed the same procedure.
Results
Figure 2 shows the permeate flux decline with time for several operating conditions. Figure 2 reveals three levels of steady-state permeate flux: approximately 7, 12 and 20 L m-2 h-1. These three levels correspond to the three cross-velocities used, showing, at first, that the increase in cross-velocity augmented the steady-state permeate flux.
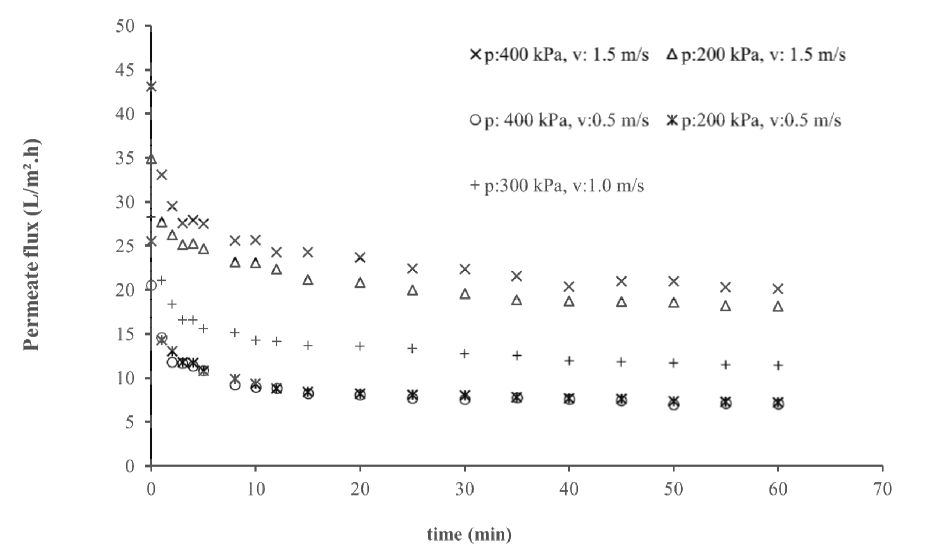
Figure 2.
Flux decline in whey ultrafiltration at different TMP and cross-flow velocities.
To observe the transience of the resistance in two replicate experiments, it was prepared a sample of whey and filtered it for only 10 s at 2.7 m s-1 and 200 kPa (the operating condition with the lowest resistance in Table 3). After that, the membrane was washed to remove reversible resistance and a new pure water permeate flux was measured. The filtration resistances were calculated as shown in Figure 3.
Table 3 shows the filtration resistances. The ratio Rr/ Riris higher than 2 for all transmembrane pressure and cross-flow velocities. For the lowest cross-flow velocity (0.7 m s-1), this ratio was higher than 5.0.
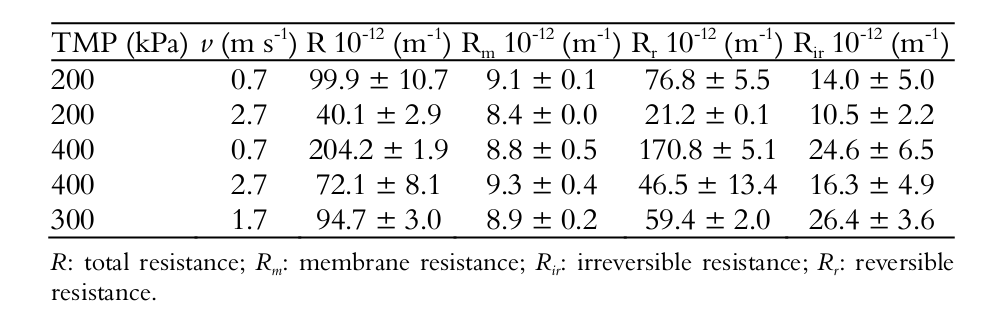
Figure 3 shows the resistances after just 10 s and after 60 min of filtration. It reveals a strong increase of reversible resistance over time. In the beginning (after 10 s of filtration), the sum of Rr + Rir was approximately 10 exp 12 m-1, and after 60 min of filtration, this amount was approximately 21 exp 12 m-1. It can be seen that the increase in the additional filtration resistance was primarily due to the growth of the Rr , leading one to think that a cake layer builds up in the first s of filtration. The irreversible resistance showed little growth, keeping a value near 10 exp 12 m-1. Note that Rirrepresents the lowest resistance, and this behavior could be expanded for all experimental conditions.
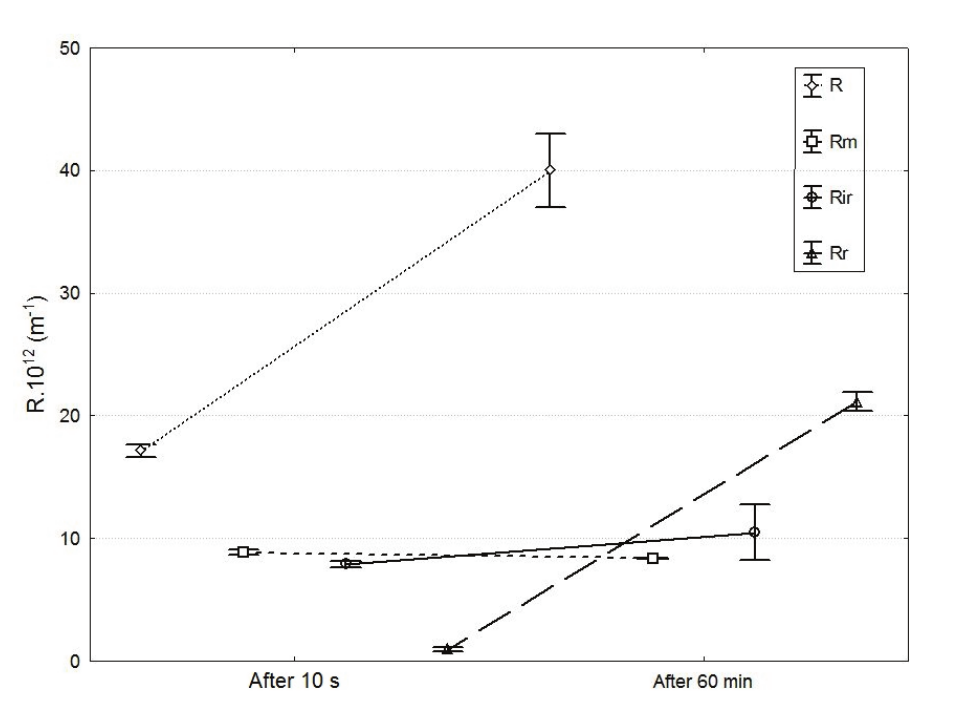
Figure 3.
Resistances after 10 s and 60 min of whey ultrafiltration. TMP = 200 kPa; v = 2.7 m s-1. R: total resistance; Rm: membrane resistance; Rir: Irreversible resistance; Rr: Reversible resistance.
Figure 4 shows the fit of data for all of the four pore blocking mechanisms at 400 kPa and 0.7 m s-1. Note that this is the operating condition (higher pressure and lower cross-flow velocity) with higher filtration resistance. It is observed good agreement between the experimental points and the cake layer model. After 10 min of filtration, this model was very close to the experimental data, and the permeate flux was only approximately 55% of the initial flux. After 60 min this value was only 35%.
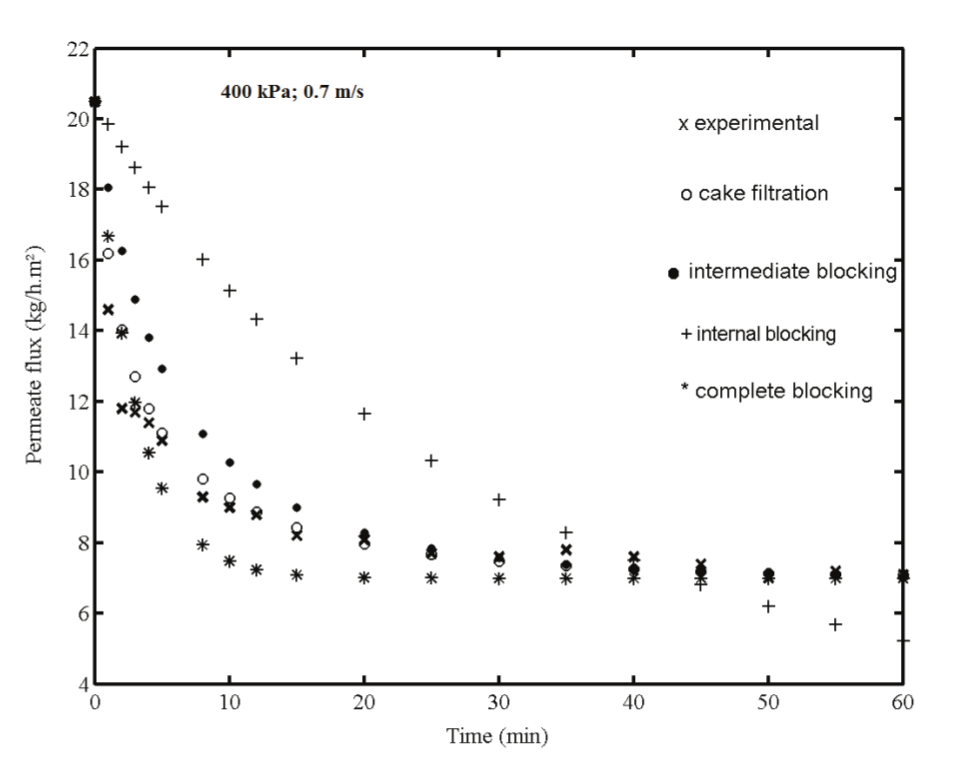
Figure 4.
Fitted data for membrane fouling mechanism at 400 kPa and v = 0.7 m s-1.
Figure 5a and b show the fit of the data for 200 kPa and two cross-flow velocities: 0.7 and 2.7 m s-1, respectively. The drag effect and convective forces induce a shear stress and a higher turbulence, and the initial permeate flux (J0 ) was approximately 30% higher for higher ‘’ (Figure 5b). These balance forces near the membrane perform the essential function of raising the permeate flux in the steady-state (J* ) in such a way that this value was 2.5-fold for = 2.7 m s-1. Furthermore, it can be seen in Figure 5 the proximity of the experimental data to the ‘cake filtration’ model, and this is explored in Table 4.
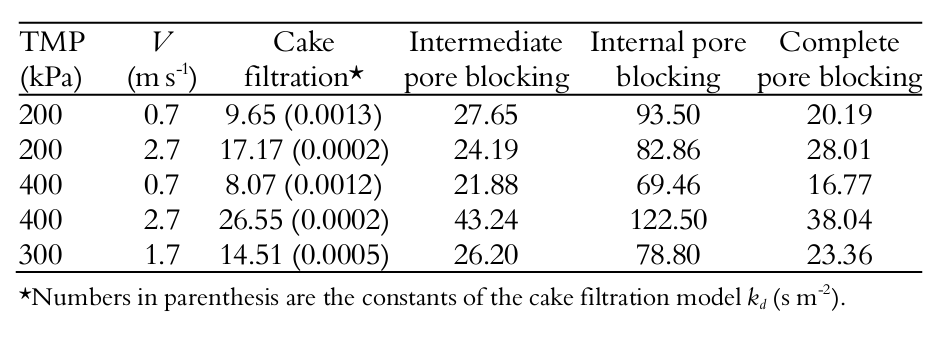
Table 4 shows the sum of squares for the nonlinear regression of each pore blocking model (Equation 3 through 6) for the whey ultrafiltration tests with spiral-wound membrane. It was observed the same behavior under all of the tested pressure and cross-flow velocity conditions, and ‘cake formation’ was the mathematical model that best represented the process (lowest sum of squares).
When the different pressures are observed (at same ''), it is possible to note that TMP did not change the constant , and in practive, increasing the pressure did not produce highger permate flux. On the other hand, the effect of the cross-flow velocity on cake filtration resistance could be observed in Table 4: the higher the , the lower the constant . Furthermore, the cake formation model was better represented at lower cross-flow velocities (sums of the squares were the minimum values observed). This shows that lower produce rapid cake formation, and thus this model has better accuracy at lower .
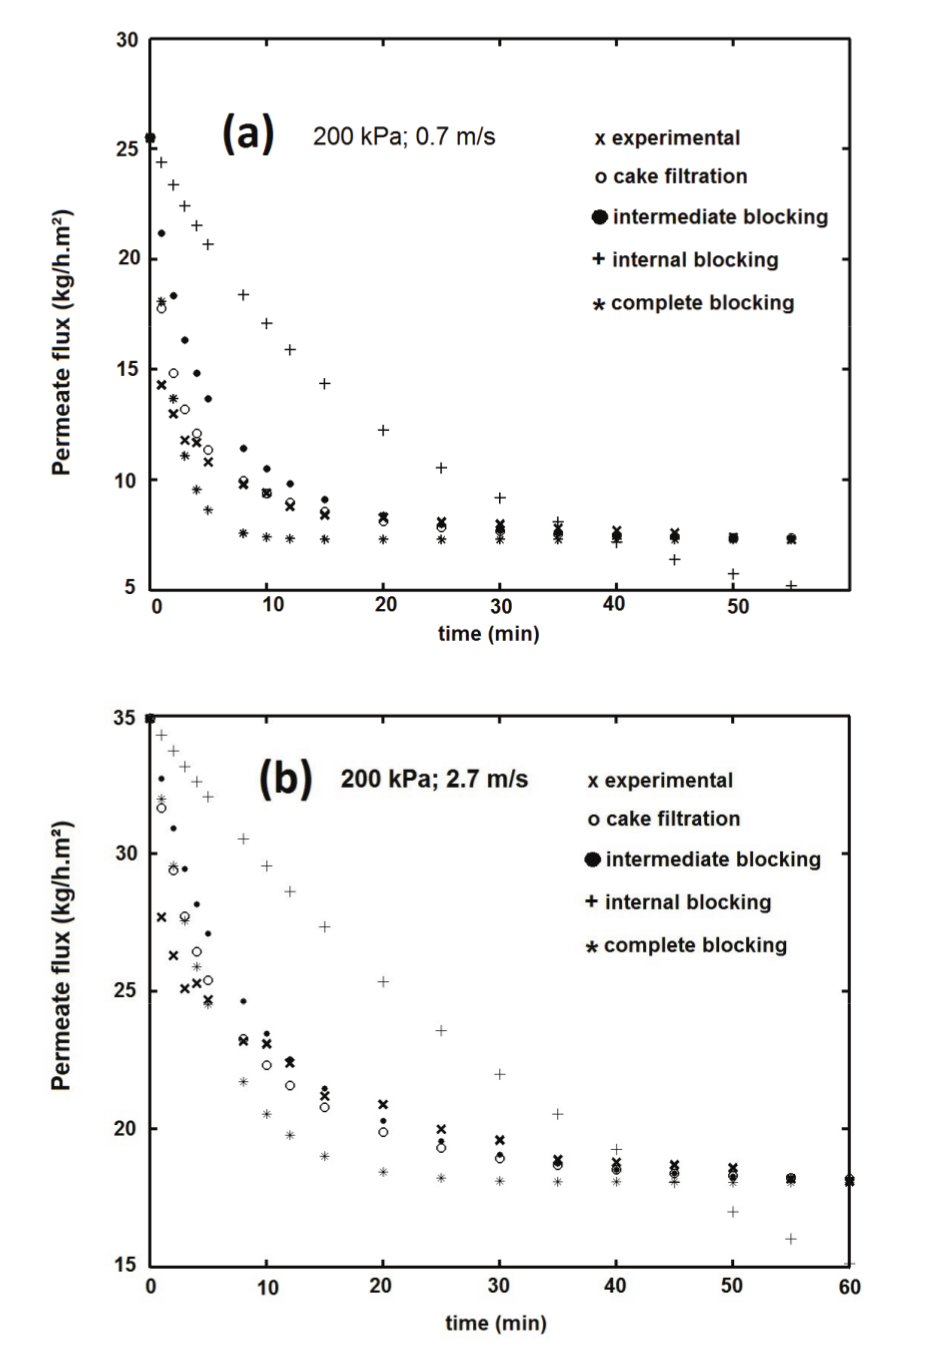
Figure 5.
Fitted data for membrane fouling mechanism at (a) 200 kPa and v = 0.7 m s-1; (b) 200 kPa and v = 2.7 m s-1.
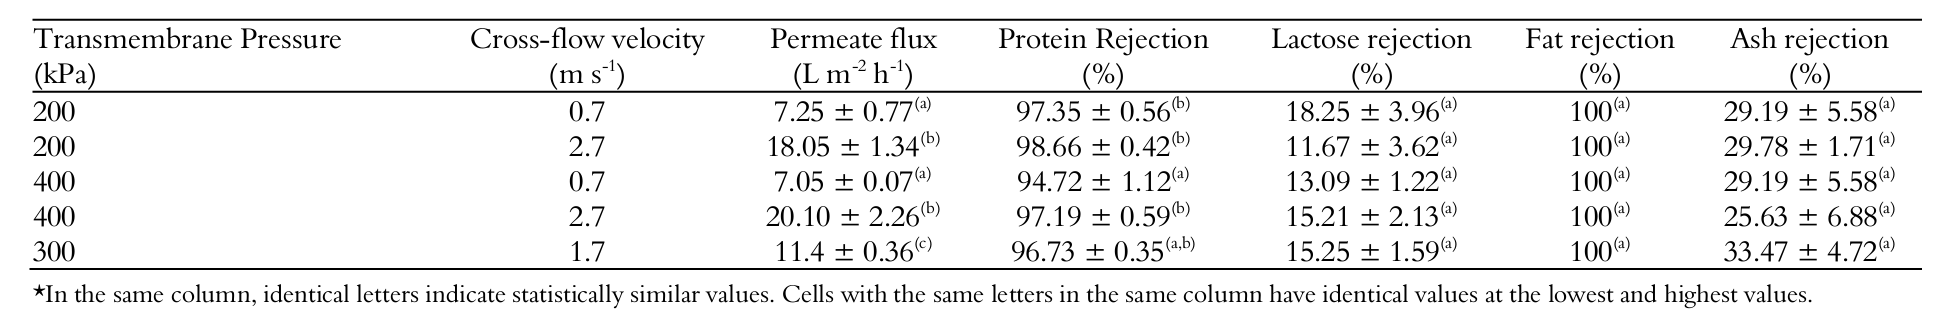
Table 5 shows the permeate flux and membrane rejection for all operating conditions tested. Regarding the permeate flux, it is observed three groups with a direct relationship with the three cross-flow velocities.
The UF membrane promoted a full rejection of fat. As expected, lactose and ashes were rejected in small proportions, and the operating conditions did not interfere with lactose and ash rejection. However, regarded protein rejection, two groups were identified with rates between 94 and 98%. Basically, the worst rejection (94.7%) was that in which a TMP of 400 kPa and a cross-flow velocity of 0.7 m s-1 were used (drastic condition to be avoided). Note that in this operating condition we established the higher cake layer (reversible resistance).
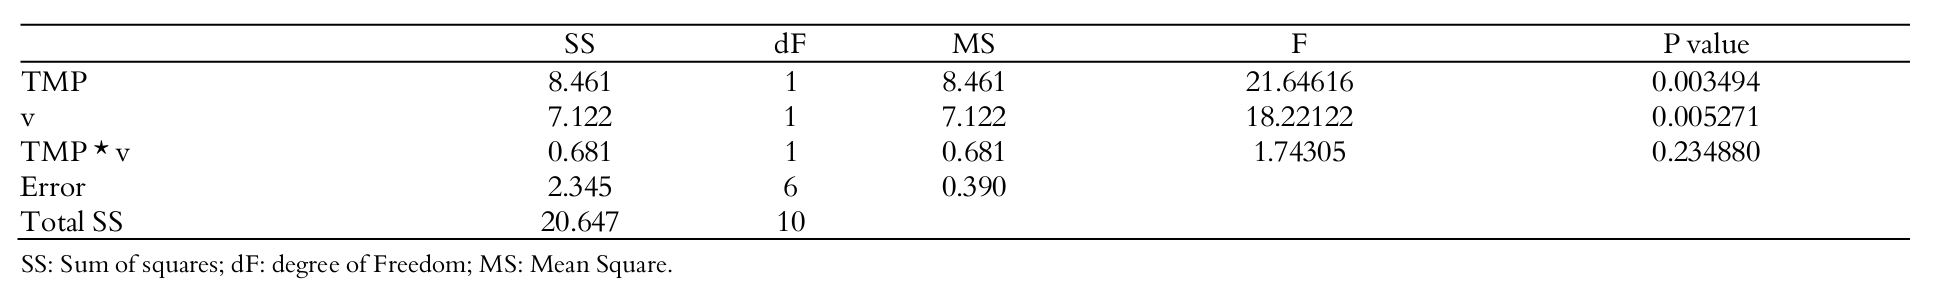
The ANOVA table of effects of pressure and cross flow velocity on protein rejection is shown in Table 6.
Pressure and cross flow velocity have taken effect on protein rejection. A linear model was adjusted to data (curvature was not significant) and a correlation was established as shown in Equation 6 with a correlation (R2) of 0.8746. However, it can be seen in Equation 6 that ‘’ have a positive effect on protein rejection whilst the contrary was observed in regard to ‘’. This fact will be discussed in sequence.
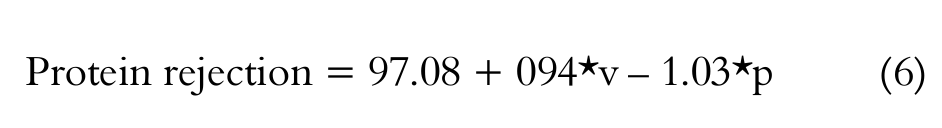 [Equation 6 ]
It was established a relationship between reversible resistance (and thus, the cake layer) and protein rejection (Figure 6) in seeking to investigate the hypothesis that the cake layer could help in membrane rejection, as suggested by Obermeyer et al. (1993). Unlike that hypothesis, it was found an inverted relation between reversible resistance and protein rejection, but this condition was achieved only in higher TMP and lower tangential velocity. The poor correlation (R2 = 0.682) was not highlighted the hypothesis of Obermeyer et al. (1993) with a real evidence. We will discuss this in sequence. Note in Figure 6 that the higher resistance (approximately 1.7 exp 14 m-1) promoted lower rejection, and this condition was achieved in higher TMP and lower tangential velocity. With respect to lactose and salt, no relationship was found, and poor regression coefficients were obtained.
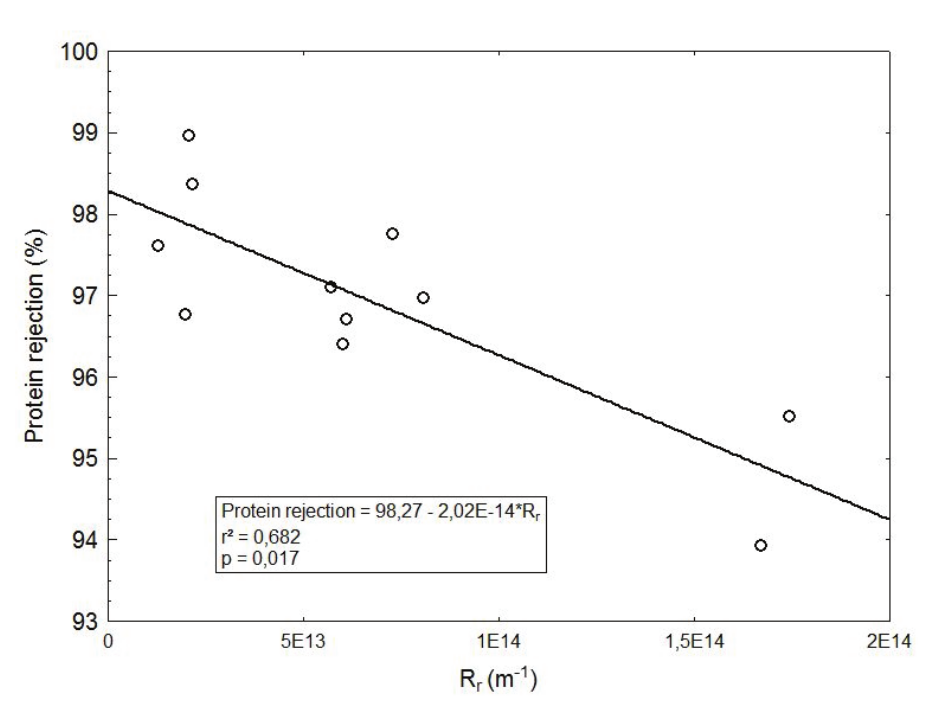
Figure 6.
Effect of reversible resistance on protein rejection in whey ultrafiltration.
Discussion
Rezaei, Ashtiani, and Fouladitajar (2011) microfiltered whey and achieved similar data to those of the flux curves shown in Figure 2. The authors found that higher pressures did not increase the flux. On the other hand, a significant effect was observed when higher cross-flow velocities were applied, indicating the flux is controlled by the mass transfer instead the transmembrane pressure. Rezaei et al. (2011) also demonstrated that the effect of cross-flow velocity in whey MF is related to cake resistance instead of the concentration polarization. This fact leads one to think that the pressure can make the cake layer more compact (and less permeable) while the shear stress carries solutes, thereby avoiding allowing them to make up the cake layer.
Table 3 shows smaller resistances in the first row and second row (lower TMP). In general, all resistances (Rr and Rir ) were increased at higher TMP. As a result, there was no effective increase in permeate flux. The seed of the additional resistance is the polarization concentration (Yee et al., 2009), which is part of the Rr. Thus, the reversible phenomenon initiates the filtration resistance, promoting a rapid increase in solute concentration near the membrane. This polarization takes the solutes for adsorption on the membrane surface, and this irreversible resistance constitutes the higher part of the filtration resistance at the beginning of filtration, as suggested by Kanani, Xinghua, and Raja (2008). Although the irreversible resistance is the minor part of the total resistance after 60 min, its participation in the formation of the cake layer is essential because the initial pore blockage was caused by this physical-chemical phenomenon. Whey proteins are known as fouling agents (Kelly & Zydney, 1997) and, actually, the protein solution causes a progressive deposition of proteins on and/or within the membrane leading to pore constriction, pore blocking and/or cake/gel layer formation (Tung, Li, Hwang, & Lu, 2008). As a result, the solutes deposit on this irreversible layer and the growth of the cake is started. It is generally agreed that whey protein aggregates formed by heat treatment or shear stress contributes in the acceleration of gel layer formation (Steinhauer, Schwing, Kraub, & Kulozik, 2015). It is assumed that deposited protein aggregates serve as reactive sites for the aggregation of other protein molecules on the fouling layer due to the exposure of free sulfhydryl groups (Kelly & Zydney, 1997). However, the convective effect is higher than the formation of aggregates and higher crossflow velocities reduced the cake layer.
With a TMP of 350 kPa, Yee’s et al. (2009) model indicated that concentration polarization is responsible for initial fouling on a time interval shorter than 370 s and is followed by protein deposition. However, the irreversible protein deposition in the second stage of the model of Yee et al. (2009) was virtually instantaneous in the present research, as this resistance was practically set before 10 s (Figure 3). Thus, the first and second fouling stages suggested by Yee et al. (2009) were very short in this study, and the rapid cake formation explains why this model is the best for representing the flux in ultrafiltration of whey.
In this way, as predicted by Yee’s model, long-term fouling is the highest reversible filtration resistance, but this rapid transition through the stages makes it difficult to model the membrane fouling. However, the rapid cake formation (as seen in Figure 3) and the good fit of the data for the cake filtration model (Table 4) allow one to conclude that cake filtration is a good model to represent the permeate flux in whey UF.
The model of Ho and Zydney (2000) combines pore blockage in the initial filtration followed by cake formation. Some studies (Muthukumaran, Kentish, Ashokkumar, & Stevens, 2005, Karasu et al., 2010) have tested this model in whey ultrafiltration but the tangential velocities were very low (between 3 exp-4 and 0.18 m s-1) and thus accelerating the occurrence of the two stages of the model. However, the initial adsorption (the first step of the Ho and Zydney’s model) was very short in this study, and the growth of the cake initiated in a few s. Thus, the pore blocking occurred so rapidly that the cake formation model is build up in the first s, and this explains the good accuracy of this model to fit the data. In some cases, high cross-flow velocities promote the drag of solutes in such a way to avoid cake formation and the complete blocking is the best model to represent the permeate flux (Brião & Tavares, 2012). However, this fact did not occur in this research and the cake filtration was the best model for all cross-flow velocities.
The cake layer formed during UF of milk products is constituted by monomers and/or aggregate protein (Ho & Zydney, 2000, James, Jyng, & Cheng, 2003, Kanani et al., 2008), but all milk components (lactose, salts, proteins) can be present in the cake. The protein is responsible for the initial adsorption on the membrane surface, but lactose and ashes can make up the formed cake (Rabiller-Baudry, Le Maux, Chaufer, & Begoin, 2002). All milk components are therefore present in high concentration on the retentate side of the membrane despite the tangential drag and, thus, the layer can cause losses of all compounds through the membrane.
The literature (Fane & Fell, 1987, Cheryan, 1998) brings general theoretical information on the harm to membrane rejection caused by cake layer, but numerical values are scarce. On the other hand, the gel layer can improve membrane rejection of salts and lactose when a very compact layer of whey is formed on the membranes (Obermeyer et al., 1993), acting as a secondary membrane. In addition, protein rejection can be improved when a protein layer is formed over the surface of MF membranes (Tracey & Davis, 1994). However, in the experiments carried out in this research, this behavior was not observed, and lactose and salts were rejected by the UF membrane in the same order for all operating conditions. In fact, what does matter in the transfer of these compounds is their small size in relation to the size of the membrane pores, and experimental conditions (not even the cake layer) have no effect on permeation.
As to protein, a reduction from approximately 98 to 94% (Table 5, Figure 6) was observed when higher resistances were settled. The cake layer (represented by reversible resistance) has shown an inverse relationship with protein rejection. However, this negative effect was observed only in the highest membrane fouling condition. Table 5 shows that all rejections around 97-98% are the same statistically, but 94% is a lower value. Figure 6 amend this information, and it can be noted that reversible resistances around 1.7 exp 14 promoted a lower protein rejection than others values. However, the poor correlation between Rrand protein rejection (Figure 6) do not allow one to conclude with a strong argument that the cake layer can help/harm the protein rejection in whey ultrafiltration. Atra, Vatai, Bekassy-Molnar, and Balint (2005) found a reduction in the protein rejection of approximately 94 to 90% when TMP was augmented from 1 bar (100 kPa) to 5 bar (500 kPa) in whey UF, but the authors did not link this fact with the formation of the cake layer. However, the positive effects were not enough to produce an effective improve in the rejection and a stronger evidence was not found in this study, because the small change in protein rejection (98-94%) was not confirmed by a high R2, as can be seen in Figure 6.
Conclusion
Fouling is the major problem to be solved in the membrane separation process of dairy products. The formation of the cake occurs so quickly in whey ultrafiltration such that this model can represent the permeate flux over time. The reversible resistance represents the greatest part of total resistance filtration so that this layer deposited on the membrane surface rules the blocking against the permeation. This cake does not influence the rejection of lactose and salts, but can reduce protein rejection in drastic operating conditions (higher pressure and low tangential velocity).
Acknowledgements
The corresponding author (VBB) would like to thank the Secretaria da Ciência e Tecnologia do Rio Grande do Sul (State Bureau of Science and Technology) for financial support (process number 465-25.00/13-0).
References
Atra, R., Vatai, G., Bekassy-Molnar, E., & Balint, A. (2005). Investigation of ultra-nanofiltration for utilization of whey protein and lactose. Journal of Food Engineering, 67(3), 325-332.
Aydiner, C., Kaya, Y., Gönder, Z. B., & Vergili, I. (2010). Evaluation of membrane fouling and flux decline related with mass transport in nanofiltration of tartrazine solution. Journal of Chemical Technology and Biotechnology, 85(9), 1229-1240.
Baklouti, S., Kamoun, A., Ellouze-Ghorbel, R., & Chaabouni, S. (2013). Optimising operating conditions in ultrafiltration fouling of pomegranate juice by response surface methodology. International Journal of Food Science and Technology, 48(6), 1519-1525.
Baldasso, C., Barros, T. C., & Tessaro, I. C. (2011). Concentration and purification of whey proteins by ultrafiltration. Desalination, 278(1-3), 381-386.
Barros, S. T. D., Andrade, C. M. G., Mendes, E. S., & Peres, L. (2003). Study of fouling mechanism in pineapple juice clarification by ultrafiltration. Journal of Membrane Science, 215(1-2), 213-224.
Brião, V. B., & Tavares, C. R. G. (2012). Pore blocking mechanism for the recovery of milk solids from dairy wastewater by ultrafiltration. Brazilian Journal of Chemical Engineering, 29(2), 393-407.
Cheryan, M. (1998). Ultrafiltration and microfiltration handbook (2nd ed.). Boca Raton, FL: CRC Press.
Chuang, C.-J., Wu, C.-Y., & Wu, C.-C. (2008). Combination of crossflow and electric field for microfiltration of protein/microbial cell suspensions. Desalination, 233(1-3), 295-302.
Corbatón-Báguena, M.-J., Vincent-Vela, M.-C., Álvarez-Blanco, S., & Lóra-Garcia, J. (2013). Analysis of two ultrafiltration fouling models and estimation of model parameters as a function of operational conditions. Transport in Porous Media, 99(2), 391-411.
El-Sayed, M. M. H., & Chase, H. A. (2011). Trends in whey protein fractionation. Biotechnology Letters, 33 (8), 1501-1511.
Fane, A. G., & Fell, C. J. D. (1987). A review of fouling and fouling control in ultrafiltration. Desalination, 62(1), 117-136.
Field, R. W., Wu, D., Howell, J. A., & Gupta, B. B. (1995). Critical flux concept for microfiltration fouling. Journal of Membrane Science, 100(3), 259-272.
Ho, C.-C., & Zydney, A. L. (2000). A combined pore blockage and cake filtration model for protein fouling during microfiltration. Journal of Colloid and Interface Science, 232(2), 389-399.
Instituto Adolfo Lutz. (2008). Métodos físico-químicos para análise de alimentos (4th ed.). São Paulo, SP: IAL.
James, B. J., Jyng, Y., & Cheng, X. D. (2003). Membrane Fouling during filtration of milk: A microstructural study. Journal of Food Engineering, 60(4), 431-437.
Kanani, D. M., Xinghua, S., & Raja, G. (2008). Reversible and irreversible membrane fouling during in-line microfiltration of concentrated protein solutions. Journal of Membrane Science, 315(1-2), 1-10.
Karasu, K., Yoshikawa, S., Ookawara, S., Ogawa, K., Kentish, S. E., & Stevens, G. W. (2010). A combined model for the prediction of the permeation flux during the cross-flow ultrafiltration of a whey suspension. Journal of Membrane Science, 361(1-2), 71-77.
Kelly, S. T., & Zydney, A. L. (1997). Protein fouling during microfiltration: comparative behavior of different model proteins. Biotechnology and Bioengineering, 55(1), 91-100.
Muthukumaran, S., Kentish, S. E., Ashokkumar, M., & Stevens, G. W. (2005). Mechanisms for the ultrasonic enhancement of dairy whey ultrafiltration. Journal of Membrane Science, 258( 1-2), 106-114.
Nourbakhsh, H., Emam-Djomeh, Z., Mirsaeedghazi, H., Omid, M., & Moieni, S. (2013). Study of different fouling mechanisms during membrane clarification of red plum juice. International Journal of Food Science and Technology, 48(6), 1-7.
Obermeyer, H. D., Kulozic, U., & Kessler, H. G. (1993). Controlled deposit formation to influence the retention of solutes in reverse osmosis and ultrafiltration. Desalination, 90(1-3), 161-172.
Rabiller-Baudry, M., Le Maux, M., Chaufer, B., & Begoin, L. (2002). Characterization of cleaned and fouled membrane by ATR-FTIR and EDX analysis coupled with SEM: Application to UF of skimmed milk with a PES membrane. Desalination, 146(1-3), 123-128.
Rao, H. G. R., Grandison, A. S., & Lewis, M. J. (2006). Flux pattern and fouling of membranes during ultrafiltration of some dairy products. Journal of the Science of Food and Agriculture, 66(4), 563-571.
Rezaei, H., Ashtiani, F. Z., & Fouladitajar, A. (2011). Effects of operating parameters on fouling mechanism and membrane flux in cross-flow microfiltration of whey. Desalination, 274(1-3), 262-271.
Steinhauer, T., Schwing, J., Kraub, S., & Kulozik, U. (2015). Enhancement of ultrafiltration-performance and improvement of hygienic quality during the production of whey concentrates. International Dairy Journal, 45(1), 8-14.
Tracey, E., & Davis, R. H. (1994). Protein fouling of track-etched polycarbonate microfiltration membranes. Journal of Colloid and Interface Science, 167(1), 104-116.
Tung, K.-L., Li, Y.-L., Hwang, K.-J., & Lu, W.-M. (2008). Analysis and prediction of fouling layer structure in microfiltration. Desalination, 234(1-3), 99-106.
Yee, K. W. K., Wiley, D. E., & Bao, J. A. (2007). Whey protein concentrate production by continuous ultrafiltration: Operability under constant operating conditions. Journal of Membrane Science, 290(n. 1-2), 125-137.
Yee, K. W. K., Wiley, D. E., & Bao, J. A. (2009). Unified model of the time dependence of flux decline for the long-term ultrafiltration of whey. Journal of Membrane Science, 332(1-2), 69-80.
Author notes
vandre@upf.br