Ciência, Tecnologia de Alimentos e Engenharia de Alimentos
Investigation of the effect of temperature and pretreatment on the rehydration capacities of dried nectarine slices
Investigação do efeito da temperatura e do pré-tratamento na capacidade de reidratação das fatias secas da nectarina
Investigation of the effect of temperature and pretreatment on the rehydration capacities of dried nectarine slices
Acta Scientiarum. Technology, vol. 39, 05, pp. 551-558, 2017
Universidade Estadual de Maringá

This work is licensed under Creative Commons Attribution 4.0 International.
Received: 25 December 2015
Accepted: 28 September 2016
Abstract: In this study, the effect of temperature and pretreatment on the rehydration capacity of nectarine slices dried either with pretreatment and under ambient conditions (‘natural’) at 50°C in a cabinet dryer was investigated. Rehydration proceeded with distilled water at three different rehydration temperatures (25, 50, and 75°C). Initial rehydration rates increased with rehydration temperature for all samples and were highest for the potassium carbonate (potas)-pretreated samples. At all rehydration temperatures, the equilibrium moisture content was highest for those pretreated with potas solution. The values of Deff varied from 2.79 to 4.32x10⁻¹⁰, 1.72 to 2.34x10⁻¹⁰, and 1.86 to 2.58x10⁻¹⁰ m2 s-1 for potassium carbonate, citric acid, and natural samples, respectively. The activation energy values were 5.65, 6.06, and 8.29 kJmol-1 for citric acid, natural, and potassium carbonate nectarine slices, respectively. The rehydration data were fitted to Peleg and first-order kinetic models: the first order kinetic model was found to be the most appropriate model for rehydration of nectarine slices.
Keywords: rehydration curves, pretreatment, effective diffusivity, mathematical models.
Resumo: Neste estudo, investigou-se o efeito da temperatura e do pré-tratamento na capacidade de reidratação das fatias secas da nectarina. Com o pré-tratamento e sob condições ambientais (natural) a 50ºC em uma cabine secadora. A reidratação procedeu com água destilada em três temperaturas de reidratação diferentes (25, 50 e 75ºC). Os índices iniciais da reidratação aumentou com a temperatura para todas as amostras, e foram maiores quando pré-tratadas com carbonato de potássio (potas). Em todas as temperaturas de reidratação, o teor de humidade foi maior para aquelas pré-tratadas com a solução de carbonato de potássio. Os valores de Deff variaram de 2,79 para 4,32x10⁻¹⁰; 1,.72 para 2,34x10⁻¹⁰; e 1,86 para 2,58x10⁻¹⁰ m2/s para carbonato de potassio, ácido cítrico e amostras naturais, respectivamente. Os valores de energia de ativação foram 5,65; 6,06 e 8,29 kJmol-1 para as fatias de nectarina, de ácido cítrico, natural, e carbonato de potássio, respectivamente. Os dados da reidratação foram adaptados para o modelo cinético de primeira ordem e para o modelo de Peleg. O modelo cinético de primeira ordem foi reconhecido por ser o modelo mais apropriado para a reidratação das fatias da nectarina.
Palavras-chave: Curvas de reidratação, pré-tratamento, difusividade efetiva, modelos matemáticos.
Introduction
The nectarine (Prunus persica var. nectarina maxim) and peach (Prunus persica) are summer fruits of the rosaceae family. Their native country was China, and they migrated from China to West Asia, and from there were carried throughout Europe. The nectarine is a peach with recessive genes sometimes referred to as a ‘shaved peach’ or ‘fuzzless peach’, due to its lack of fuzz or short hairs (Ginat, Gado, & Rizk, 2012).
The Food and Agriculture Organization of the United Nations (Faostat) statistical data showed that the yield of peaches and nectarines world-wide is about 21 million tons. The major producers are China, Italy, USA, Greece, Spain, and Turkey; in Turkey, the production was 575,730 tons in 2012 (Food and Agriculture Organization [FAO], 2014).
As a result of their high moisture content and the seasonal nature of their production, fresh nectarines are highly perishable; for that reason, nectarines are processed into various products using drying (Krokida & Marinos-Kouris, 2003). Simply put, drying can be defined as removal of the water from a moist/wet material, but the drying process is actually a complicated heat transfer realized between moist material and its surroundings, and also is a mass transfer process realized with moisture import-export (Kumar, Tiwari, & Belorkar, 2015).
To increase the drying rate, pretreatment is applied. In recent years, the addition of chemical components and blanching have been used as pretreatments for vegetables before the drying procedure. In addition, drying conditions such as temperature, air flow rate, relative humidity of ambient air; structural properties such as density and porosity; optical properties such as color and appearance; and sensory properties such as aroma, taste, and smell of the dried vegetables effect the rehydration properties and rate of drying of the product (Maldonado, Arnau, & Bertuzzi, 2010, Prajapati, Prabhat, & Rathore, 2011, Osidacz & Ambrosio-Ugri, 2013, Garba & Kaur, 2014).
Proteins are denatured when heat is applied during drying and are concentrated by the salt in the cells as a result of the drying procedure. The denatured proteins largely lose the ability to reabsorb and bind residual water. Starchy and gummy materials also gain a less hydrophilic quality for the same reasons, and also because the cell wall loses flexibility. In addition, passing the salt and sugar to the rehydration water from the cell causes a loss of the turgor property of the cell (Noshad, Mohebbi, Shahidi, & Mortazavi, 2012).
Rehydration is applied to provide moisture to dried products. Reduction of moisture to a very low level could result in fruits being too difficult to eat for some consumers and may necessitate rehydration (Rastogi, Nayak, & Raghavarao, 2004). For that reason, dehydrated products are usually rehydrated prior to use. Rehydration is a complex process: it involves reversing physical and chemical changes resulting from the drying process such as pretreatment; the drying method and conditions; physical structure; chemical composition; density of the samples; and salt content in the water (Lucas, Le Ray, & Mariette, 2007, Ulloa et al., 2013).
The rate of water absorption in rehydration is important in the foods. The rehydration capability of a dried product is measured by the amount of water obtained as a result of the soaking under a range of conditions. If a dried product reabsorbs the containing water when it is fresh, it is accepted as a quality product. Rehydration of dried plant tissues comprises three simultaneous processes: absorption of water into the dried material, swelling, and leaching of solubles (Hizaji, Maghsoudlou, & Jafari, 2011). The rehydration capacity is affected by the various factors such as the drying conditions, product type, temperature degree, ratio of the rehydration water to that in the dried product. Therefore, when stating the quantitative value regarding the rehydration capability of a product, it is necessary to identify in detail the methods and conditions under which the value was determined (Okpala & Ekechi, 2014).
The rehydration kinetics of foods after drying have recently been studied, including potatoes (Markowski, Bondaruk, & Blaszczak, 2009), chick peas (Yildirim, Öner, & Bayram, 2010), beans (Piergiovanni, 2011, Ulloa et al., 2013), and green bell peppers (Doymaz & Ismail, 2013). Many theoretical, empirical, and semi-empirical models have been employed for modeling, with the objectives of relating experimental results to physical laws and studying the water absorption behavior of agricultural products during soaking. The Peleg, Weibull, first-order kinetic model, and diffusion coefficient are the best and most often used models for modelling the rehydration or absorption of water by agricultural products (Yildirim, Öner, & Bayram, 2011).
However, to date, there has been no study published about nectarine rehydration. The present study focused on the rehydration characteristics and kinetics of nectarine slices dried in a cabine dryer at 50oC. The effects of pretreatment and rehydration temperature on the rehydration process were also investigated. Further, we aimed to develop suitable mathematical models namely, the Peleg and first-order kinetic models, to describe the rehydration properties.
Material and methods
Materials
Fresh nectarines (Prunus persica var. nectarina maxim) were purchased from a local market in İstanbul, Turkey and kept at 4°C prior to experiments. The initial moisture content of the fresh nectarines was determined using the Association of Official Analytical Chemists method (AOAC, 2005). To determine the initial moisture content of the samples, 10-g samples of were dried in a Selecta oven (Digiheat; Abrera, Barcelona, Spain) at 110oC for 24 hours; this experiment was repeated four times. The average initial moisture content of the nectarines was s 84% (w.b.).
Pretreatment
The nectarine samples were selected by visual inspection with reference to homogeneity in size, shape, and ripeness. Before pretreatment, nectarine samples were washed and cut into slices of thickness 1.5±0.2 mm using a knife. The nectarine samples were pretreated with different solutions for inactivation of enzymes as follows (chemicals used for dipping solution were technical grade):
- Potas: Traditional potassium carbonate solution: This solution is prepared by dissolving 5 g K2CO3 in 100 mL water with 0.05 g olive oil added;
- Citric acid: Dipping for 3 min in solution of 5% citric acid at room temperature;
- Natural: No treatment.
Drying procedure and experimental apparatus
Samples were dehydrated as slices in a cabinet dryer (APV & PASILAC Limited, Carlisle, Cumbria, UK) with air flow at 50oC and 2 ms-1. In each experiment (natural and pretreatment), 100±2 g nectarine slices were used. Moisture loss in the nectarine slices was measured with a digital balance (Mettler-Toledo AG, Grefensee, Switzerland, model BB3000) and recorded at 30 min intervals. Drying was considered complete when the moisture content of the samples was about 0.085 g water g-1 dry matter (dry basis) at an air temperature 50oC.
Rehydration procedure
Rehydration and diffusion are two important parameters in the characterization of the dried foods. Dried raw material was stored in low-density polyethylene bags after dehydration and kept refrigerated until used in the rehydration experiments. Nectarine slice samples were rehydrated by immersion in distilled water at a controlled temperature: 10 g nectarine slices was placed in a net basket and immersed into a 250 mL glass jar with lid containing 150 mL distilled water, which had previously been heated to the required soaking temperature (25, 50, and 70oC) by placement in a water bath (Raypa, RFG-10, R.Espinar S.L., Terrassa (Barcelona), Spain) thermostatically controlled at the required temperature. At every 30 min interval, nectarine slices were removed from the water, drained, and weighed using an electronic digital balance having a sensitivity of 0.001 g (Precisa XB220A; Precisa Instruments AG, Switzerland). The weight change was observed at specific intervals until the equilibrium moisture content was reached. The experiments were carried out in duplicate, and their average values were recorded.
Mathematical modelling of rehydration process
In rehydration studies, the rehydration content (R ) was expressed as percentage water gain, and estimated from the sample weight difference before and after the rehydration as in the following Equation 1:
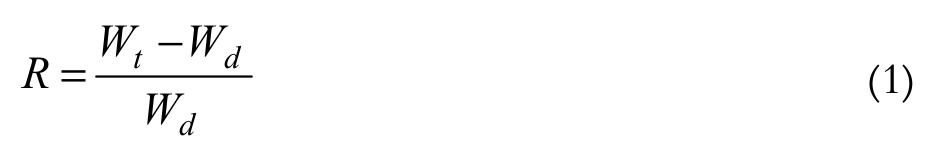 (1)
(1)where:
Wt is the weight of rehydrated sample (g) when constant weight was obtained and Wd is the weight of the dried sample.
To ensure saturation, the samples were then kept in water until no further change in weight was observed.
The Fick’s second law of diffusion is often used to describe a moisture diffusion process (Crank, 1975; Equation 2):
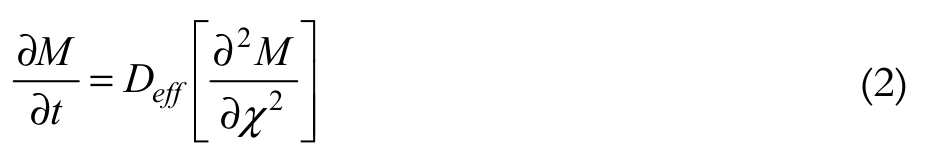 (2)
(2)The assumptions involved in the diffusion analysis are: uniform initial moisture content, internal moisture movement as the main resistance, negligible external resistance to heat and mass transfer, a constant effective diffusion coefficient (Cunningham, Mcminn, Magee, & Richardson, 2008). The average concentration of a diffusing substance is given by a series type Equation 3:
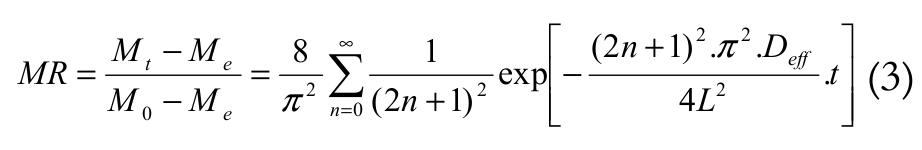 (3)
(3)where:
MR is the moisture ratio, Mt, Mo and Me are the moisture content (g water g-1 dry matter) on the dry basis at any time, initial and equilibrium, respectively. Deff is the effective moisture diffusivity (m2 s-1), t is the time (s), L is the half-thickness of the slab (m) and n is the positive integer. For the sake of mathematical simplicity we restrict Equation 3 at the first term, resulting Equation 4:
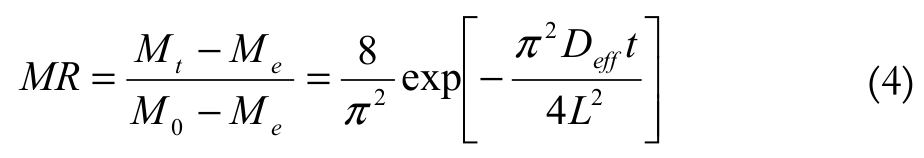 (4)
(4)Equation 4 can be rewritten as Equation 5 and 6:
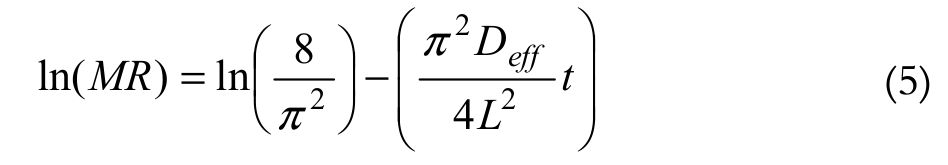 (5)
(5)
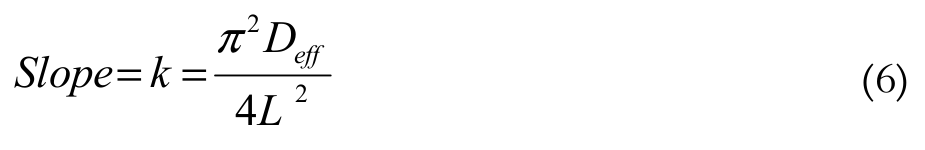 (6)
(6)where:
k (s-1) is the constant rate of diffusion.
The temperature affinity of the effective diffusivity may be portrayed by an Arrhenius-type relationship in Equation 7. Considering isothermal conditions it was assumed that the effective diffusivity varied as a function of water temperature (Doymaz, 2016).
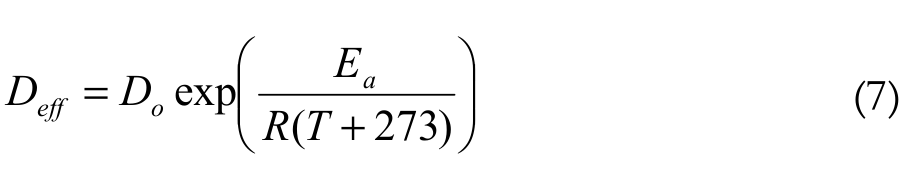 (7)
(7)where:
D0 is the diffusivity for an infinite temperature (m2 s-1), Ea is the activation energy for moisture diffusion (Jmol-1), R is the universal gas constant [R = (8.31 J) (mol K)-1] and T is the temperature (expressed in oC). From the slope of the straight line of ln Deff versus reciprocal of T, described by the Arrhenius equation, the activation energy, Ea, could be calculated.
Although several mechanisms have been proposed to describe rehydration process based on different mass transports such as diffusion and capillary flow, it is not clear which is the predominant mechanism. Among the various models thus far proposed, empirical models are the most widely employed because of its mathematical simplicity and utility.
In the present study, in order to determine the moisture content uptake as a function of rehydration time, Peleg’s model in Equation 8 and first-order kinetic model in Equation 10 were used.
In an attempt to simplify the mode of water sorption by food materials, a two parameter, nonexponential, empirical equation was proposed by Peleg (1988). Peleg’s Equation 8:
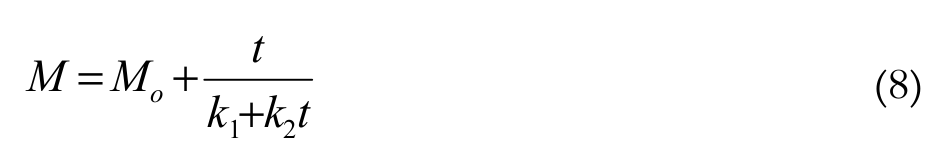 (8)
(8)where:
1 is a kinetic constant of the model [s (g dry matter) (g)-1] and 2 is a characteristic constant of the model (g dry matter g-1) (Pavelkić et al., 2015).
If the time of rehydration is long enough, the equilibrium moisture content (Me ) is given by Equation 9:
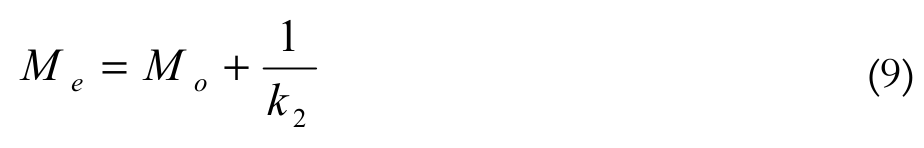 (9)
(9)Unlike the drying process, in the rehydration process, the equilibrium moisture content (Me) cannot be determined separately because many changes can occur at long soaking times, it is difficult to establish when equilibrium is attained. In the first-order kinetic model in Equation 10, the equilibrium moisture content (Me) is considered as an additional parameter to be calculated.
The first-order kinetic model is based on the diffusion model of Fick’s second law for different geometrics and is expressed in Equation 10 (Cox, Gupta, & Abu-Ghannam, 2012):
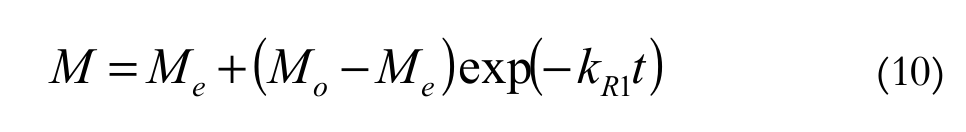 (10)
(10)where:
R1 is the rehydration kinetic constant (s-1).
Statistical analysis
The statistical analysis of experimental data was determined using Statistica 6.0 software (Statsoft Inc., Tulsa, OK), which is based on the Levenberg–Marquardt algorithm. The goodness of fit of the tested mathematical models are the coefficient of determination (R2 ), reduced chi-square ( 2) and root-mean-square error (RMSE). These parameters can be calculated as Equation 11 and 12:
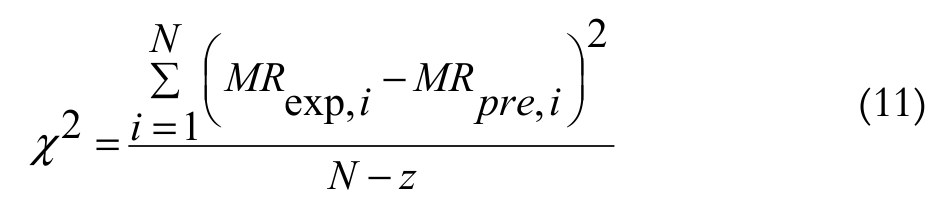 (11)
(11)
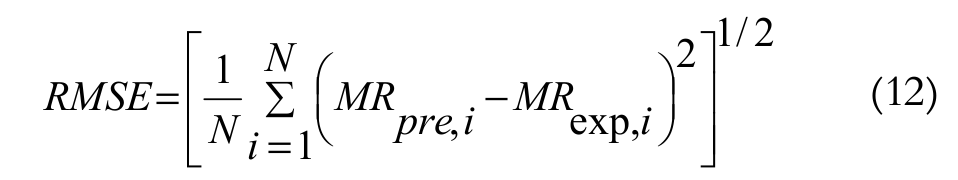 (12)
(12)where:
Mexp,i and Mpre,i are the experimental and predicted dimensionless M, respectively, N is the number of data values, and is the number of constants of the models. The equation giving the highest R2 and the smallest 2 and RMSE value was considered to be the best fitted equation (Menezes et al., 2013).
Results and discussion
Rehydration content curves
Rehydration and diffusion are the main factors in the characterization of dried food materials. The rehydration characteristics indicate the physical and chemical changes during the drying that are influenced by processing conditions, pretreatment, and composition of samples (Maldonado et al., 2010). The natural and pretreated nectarine slices were dried at 50oC and the experiments were carried at 25, 50, and 75°C, then examined. The rehydration kinetics of food products can be described using changes in moisture content versus rehydration time. The rehydration isotherms at the various temperatures (25, 50, and 70°C) are given in Figure 1.
An important influence of water temperature on rehydration curves can be observed in all figures, mainly at the initial and final stages of the process. The moisture content at 70oC changed more rapidly than at 25 and 50°C in all cases. Therefore, rehydration capacity of the samples increased with increasing rehydration temperature. This result might be explained by the more rapid diffusion of water into the material as the temperature of steeping water is increased. It is clear that the moisture content increases continuously with rehydration time. The rehydration content increased significantly within the initial period, but the rate slowed down gradually. Such curves are characteristic of a diffusion-controlled process, according to the reports of Gaware, Sutar, and Thorat (2010) and Markowski and Zielinska (2011).
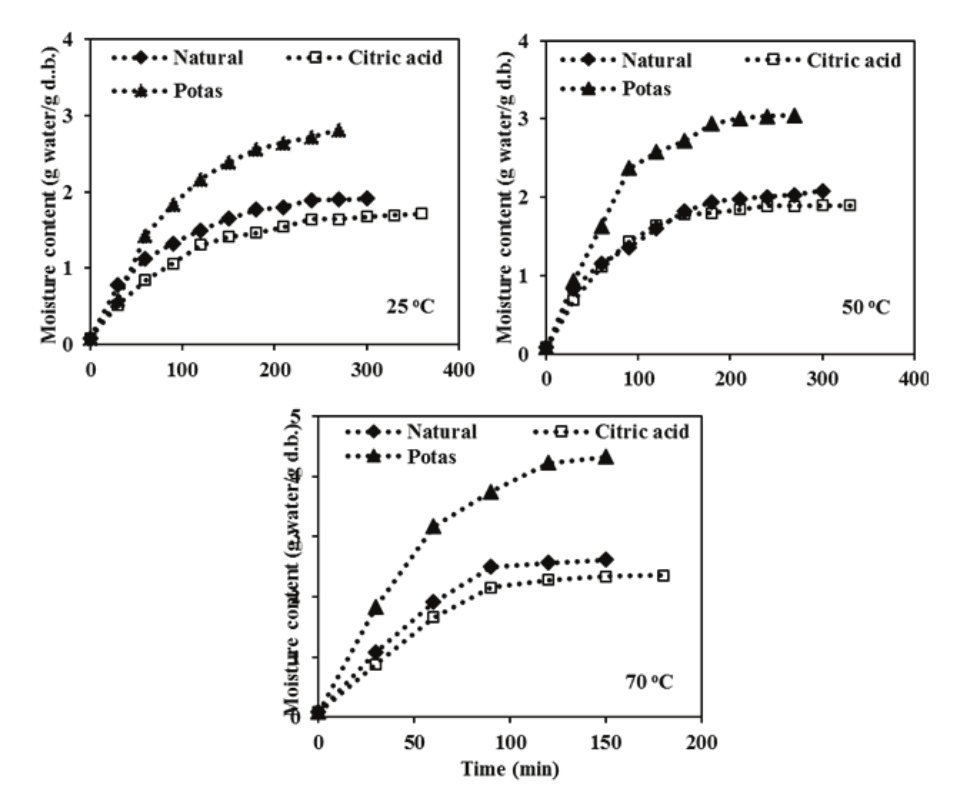
Figure 1.
Rehydration curves at 25, 50, and 70oC for nectarine slices.
The citric acid and natural nectarine slices exhibited an initial high rate of moisture absorption followed by slower absorption in the later stages, a characteristic moisture absorption behavior, as previously described. At all the three temperatures, the moisture content values show a relatively higher increase with increasing temperature in the naturally dried and nectarine slices pre-treated with citric acid (Figure 1). in addition, the rehydration content of potas samples resulted in the highest rehydration (4.33 g water g-1 dry matter), compared with those pretreated with citric acid and the control (natural) samples. To summarize, nectarine slices pretreated with potas had the highest rehydration content due to large-sized, open pores, which were easily penetrated by water. Hence, it was determined that the pretreatment in the drying had an effect on the rehydration.
Diffusion coefficient
The Fick laws are the common laws used to explain water diffusion into the dried nectarine slices and its diffusion type. Equation 5 and 6 were used for calculating the diffusion coefficients, important parameters that should be calculated when doing rehydration characterization of dried nectarine slices..
To determine the moisture diffusion coefficient during rehydration at the different temperatures of the nectarine slices dried at 50oC degrees by pretreatment and without pretreatment, t versus (ln W) figures were plotted. The diffusion coefficients were calculated from the slopes of the straight line equations. The effective diffusion coefficients were identified for different temperatures used and according to the process parameters applied. The results of effective moisture diffusivity are shown in the Table 1
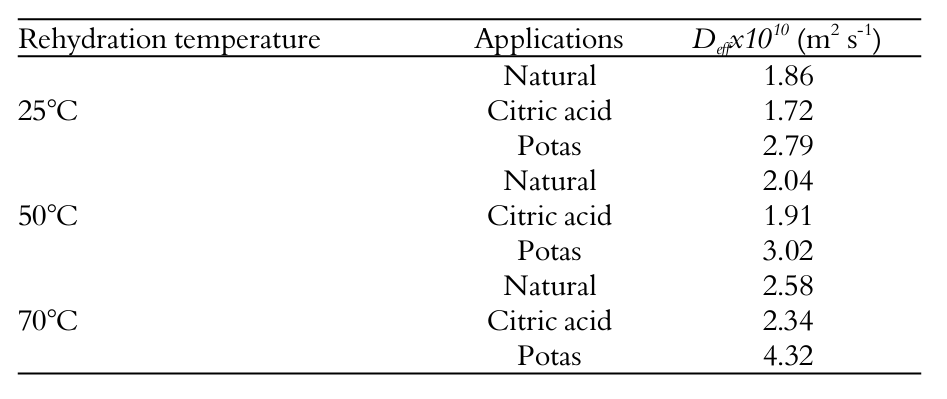
The effective moisture diffusivity values of pretreated and untreated (natural) samples were found to range between 4.32 and 1.72x10⁻¹⁰ m2 s-1. According to the these results, effective moisture diffusivity increased with increasing temperature. Also, the values of Deff increased greatly with pretreatment (except for pretreatment with citric acid). As a result, pretreated nectarine slices resulted in higher effective moisture diffusivity than the untreated (natural) samples. A relatively higher diffusion coefficient is obtained with the dried nectarine slices pretreated with potas solution; these values were 2.79, 3.02, and 4.32x10⁻¹⁰ m2 s-1 at 25, 50, and 70°C, respectively. The influence of the pretreatment solution on the internal mass transfer of nectarine slices during the rehydration yielded pretreated samples with higher effective moisture diffusivity values. Nectarine slices pretreated in potas solution showed higher effective moisture diffusivity in comparison with those pretreated in a citric acid solution. This result is similar to the result for navy beans (Ghafoor, Misra, Mahadevan, & Tiwari, 2014). The obtained values of Defffrom this study lie whitin the general range 10-8 to 10-10 m2 s-1 for rehydration of food materials
Activation energy
The activation energy values were 5.65, 6.06, and 8.29 kJ mol-1 for citric acid-pretreated, natural, and potassium carbonate pretreated nectarine slices, respectively. Similar results were observed for the other fruits (Garcia-Pascual, Sanjuan, Melis, & Mulet, 2006).
Rehydration modelling
The moisture content values obtained during the rehydration of the nectarine slices dried at 50°C in ambient air and by different pretreatments by time for the process were investigated. Empirical models available in the literature, the Peleg and first-order kinetics, were used to describe the ongoing process during the rehydration of nectarine slices. Using the Statistica 6.0 software program, coefficients of each model that was included in the study were determined. The suitability of calculated values from the models with experimental data was determined by R2, RMSE, and 2 statistical data. The results for rehydrated nectarine slices at different temperatures are given in the Table 2.
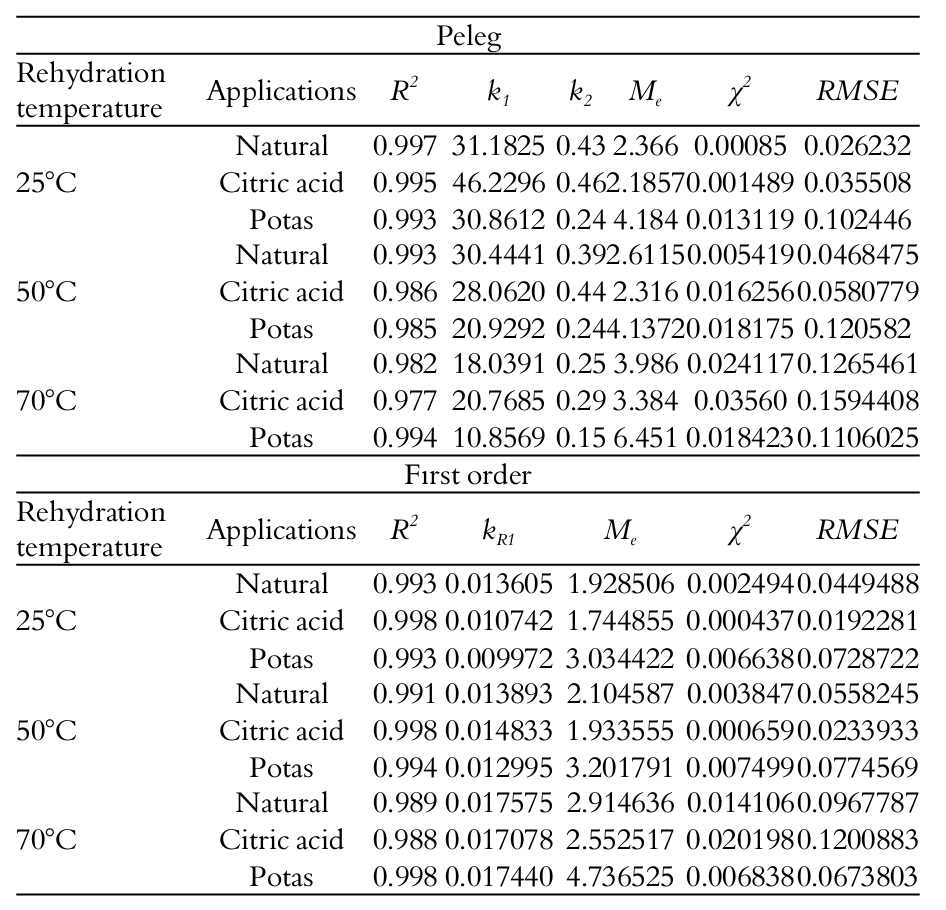
Table 2 shows the mean values for the parameters of the models at three working temperatures. The kinetic rate constant k1 and the characteristic constant 2 of the Peleg’s model change inversely proportional to the temperature. The high 1, 2, and Me values observed for pretreated samples (potas) indicate the increased water absorption rate of samples compared with the natural and citric acid samples. Decreasing 1 and 2 parameter values with increasing temperature indicates a high water absorption rate. This result is similar to the observations of other authors, such as Solomon (2007) with lupin and Noshad et al. (2012) with quinces. On the other hand, the kinetic constant of the first order model ( R1) increased with the increasing temperature. Also, the kinetic constants of the first-order model for natural and citric acid samples are higher than the pretreated (potas) samples. Thereby, the models predict that water transfer (inversely proportional to the 1, directly proportional withkR1) is promoted by an increase in temperature. Moreover, Me values for all the three models increased as the temperature increased.
When the Table 2 was examined for the nectarine slice samples, the statistical data that were generated by the three models used to explain the absorption case that occured in the rehydration phase were examined one by one; the receivable moisture rate with the lowest error was provided by the first order model. Therefore, the first order model in which approximation data were closest to experimental data was defined as the optimal model. In the rehydration of the nectarine slices, standard error (RSME) and chi-square ( 2) values of committed estimation by this model ranged from 0.0192281-0.1200883 and 0.000437-0.020198, respectively, and thus were determined to be quite close to zero. Modelling adequacy was also found to be between 0.998 and 0.988.
Conclusion
In this study, rehydration kinetic of nectarine slices dried with naturally and pre-treated at 50°C was examined at three different temperatures; the following results were obtained.
First, the rehydration capacity of the sample increased with increasing rehydration temperature. Second, the pre-treatment in the drying had an effect on the rehydration. In the rehydration of the nectarine slices dried after potassium carbonates (potas) pretreatment, the rehydration temperature is higher and there was more higher rehydration capacity (433. g water g-1 dry matter). Third, the effective diffusion coefficient (4.32x10⁻¹⁰ m2 s-1) was reached according to the other samples (citric acid and natural). The activation energy values varied from 5.65 to 8.29 kJ mol-1. Finally, two different empirical rehydration models express the changing of the moisture content with time explained the rehydration behavior of dried nectarine slices. The first order kinetic model was seen that the best equation to express the rehydration behavior of all the dried nectarine slices based on the statistical calculations using R2, RMSE, and 2.
References
Association of Official Analytical Chemists [AOAC]. (2005). Official methods of analysis (18th ed.). Arlington, VA: AOAC.
Cox, S., Gupta, S., & Abu-Ghannam, N. (2012). Effect of different rehydration temperatures on the moisture, content of phenolic compounds, antioxidant capacity and textural properties of edible Irish brown seaweed. LWT- Food Science and Technology, 47(2), 300-307.
Crank, J. (1975). The mathematics of diffusion (2nd ed.). Oxford, UK: Clarendon Press.
Cunningham, S. E., Mcminn, W. A. M., Magee, T. R. A., & Richardson, P. S. (2008). Experimental study of rehydration kinetics of potato cylinders. Food and Bioproducts Processing, 86(1), 15-24.
Doymaz, I. (2016). Hot-air drying and rehydration characteristics of red kidney bean seed. Chemical Engineering Communications, 203(5), 599-608.
Doymaz, I., & Ismail, O. (2013). Modeling of rehydration kinetics of green bell peppers. Journal of Food Processing and Preservation, 37(5), 907-913.
Food and Agriculture Organization [FAO]. (2014). FaoStat: agriculture data. Retrieved from http://faostat3.fao.org/download/Q/QC/E
Garba, U., & Kaur, S. (2014). Effect of drying and pretreatment on anthocyanins, flavenoids and ascorbic acid content of black carrot (Daucus Carrota L.). Journal of Global Biosciences, 3(4), 772-777.
Garcia-Pascual, P., Sanjuan, N., Melis, R., & Mulet, A. (2006). Morchella esculenta (morel) rehydration process modelling. Journal of Food Engineering, 72(4), 346-353.
Gaware, T. J., Sutar, N., & Thorat, B. N. (2010). Drying of tomato using different methods: Comparison of dehydration and rehydration kinetics. Drying Technology, 28(5), 651-658.
Ghafoor, M., Misra, N. N., Mahadevan, K., & Tiwari, B. K. (2014). Ultrasound assisted hydration of navy beans (Phaseolus vulgaris). Ultrasonics Sonochemistry, 21(1), 409-414.
Ginat, E. S., Gado, G. B., & Rizk, E. M. (2012). Physiochemical properties of nectar prepared from nectarine juice with different ratios of date syrup. The Journal of American Science, 8(11), 139-143.
Hizaji, A. S., Maghsoudlou, Y., & Jafari, S. M. (2011). Effect of water temperature, variety and shelf life on rehydration kinetics of microwave dried potato cubes. Latin American Applied Research, 41(3), 249-254.
Krokida, M. K., & Marinos-Kouris, D. (2003). Rehydration kinetics of dehydrated products. Journal of Food Engineering, 57(1), 1-7.
Kumar, Y., Tiwari, S., & Belorkar, S. A. (2015). Drying: an excellent method for food preservation. International Journal of Engineering Studies and Technical Approach, 1(8), 1-17.
Lucas, T., Le Ray, D., & Mariette, F. (2007). Kinetics of water absorption and solute leaching during soaking of breakfast cereals. Journal of Food Engineering, 80(2), 377-384.
Maldonado, S., Arnau, E., & Bertuzzi, M. A. (2010). Effect of temperature and pretreatment on water diffusion during rehydration of dehydrated mangoes. Journal of Food Engineering, 96(3), 333-341.
Markowski, M., & Zielinska, M. (2011). Kinetics of water absorption and soluble-solid loss of hot-air-dried carrots during rehydration. International Journal of Food Science and Technology, 48(6), 1122-1128.
Markowski, M., Bondaruk, J., & Blaszczak, W. (2009). Rehydration behavior of vacuum-microwave-dried potato cubes. Drying Technology, 27(2), 296-305.
Menezes, M. L., Kunz, C. C., Perine, P., Pereira, N. C., Santos, O. A. A., & Barros, S. T. D. (2013). Analysis of convective drying kinetics of yellow passion fruit bagasse. Acta Scientiarum. Technology, 35(2), 291-298.
Noshad, M., Mohebbi, M., Shahidi, F., & Mortazavi, S. A. (2012). Kinetic modeling of rehydration in air-dried quinces pretreated with osmotic dehydration and ultrasonic. Journal of Food Processing and Preservation, 36(5), 383-392.
Okpala, L. C., & Ekechi, C. A. (2014). Rehydration characteristics of dehydrated West African pepper (Piper guineense) leaves. Food Science & Nutrition, 2(6), 664-668.
Osidacz, R. C., & Ambrosio-Ugri, C. B. (2013). Physicochemical quality of eggplant dehydrated with varied pretreatments. Acta Scientiarum. Technology, 35(1), 175-179.
Pavelkić, V. M., Brdarić, T. P., Petrovıć, M. P., Šekularac, G. M., Košević, M. G., Pezo, L. L., & Ilić, M. A. (2015). Application of Peleg model on mass transfer kinetics during osmotic dehydratation of pear cubes in sucrose solution. Chemical Industry & Chemical Engineering Quarterly, 21(4), 485-492.
Peleg, M. (1988). An empirical model for the description of moisture sorption curves. Food Science, 53(4), 1216-1217.
Piergiovanni, A. R. (2011). Kinetic of water adsorption in common bean: considerations on the suitability of Peleg’s model for describing bean hydration. Journal of Food Processing and Preservation, 35(4), 447-452.
Prajapati, V. K., Prabhat, K., & Rathore, S. S. (2011). Effect of pretreatment and drying methods on quality of value-added dried aonla (Emblica officinalis Gaertn) shreds. Journal of Food Science and Technology, 48(1), 45-52.
Rastogi, N. K., Nayak, C. A., & Raghavarao, K. S. M. S. (2004). Influence of osmoticpre-treatments on rehydration characteristics of carrots. Journal of Food Engineering, 65(2), 287-292.
Solomon, W. K. (2007). Hydration kinetics of lupin (lupinus albus) seeds. Journal of Food Process Engineering, 30(1), 119-130.
Ulloa, J. A., Bonilla-Sanchez, C. R., Ortiz-Jimenez, M. A., Rosas-Ulloa, P., Ramırez-Ramırez, J. C., & Ulloa-Rangel, B. E. (2013). Rehydration properties of precooked whole beans (Phaseolus vulgaris) dehydrated at room temperature. CyTA-Journal of Food, 11(1), 94-99.
Yildirim, A., Öner, M. D., & Bayram, M. (2010). Modeling of water absorption of ultrasound applied chickpeas (Cicer arietinum L.) using Peleg’s equation. Journal of Agricultural Sciences, 16(4), 278-286.
Yildirim, A., Öner, M. D., & Bayram, M. (2011). Fitting Fick’s model to analyze water diffusion into chickpeas during soaking with ultrasound treatment. Journal of Food Engineering, 104(1), 134-142.
Notes
Author notes
ismail@yildiz.edu.tr