Geografia
Sensitivity mapping of oil pollution incidents in land environments
Mapeamento de sensibilidade a incidente por poluição por óleo em ambientes terrestres
Sensitivity mapping of oil pollution incidents in land environments
Acta Scientiarum. Technology, vol. 40, 2018
Universidade Estadual de Maringá

This work is licensed under Creative Commons Attribution 4.0 International.
Received: 15 December 2015
Accepted: 05 December 2016
Abstract: The Environmental Sensitivity Index (ESI) Map is an element to guide the planning of contingency. Road transport is the main vectors in accidents which cause oil spilling in the environment. Since terrestrial environments do not have their environmental sensitivity index, as the marine environment have. Current analysis forwards a proposal for mapping environmental sensitivity to oil and oil derivatives spills in terrestrial environments. Four factors have been included in the Environmental Sensitivity Index Maps: (1) biological resources; (2) socioeconomic mosaic; (3) land cover; (4) Terrestrial Environmental Sensitivity Index (TESI). ESI maps were prepared in five pilot areas for the Rodovia dos Tamoios, state of São Paulo, Brazil, featuring intermediary class TESI, diversity in socio-economic activities, land cover and constant presence of fauna. Adequacy for sensitivity in terrestrial environments triggers the systematization of an efficient, fast and simple production index.
Keywords: road accidents, ESI Map, oil spill, petroleum.
Resumo: A Carta de sensibilidade ambiental para derrames de óleo (Carta SAO) constitui elemento norteador ao planejamento de ações de contingência. O transporte rodoviário é um dos principais vetores em acidentes que resultam em derramamento de óleo no ambiente. Os ambientes terrestres, entretanto, não possuem um índice de sensibilidade ambiental próprio, como ocorre com os ambientes marinhos. O presente estudo tem como objetivo apresentar uma proposta de mapeamento da sensibilidade ambiental para derramamento de óleo e derivados em ambiente terrestre. Quatro elementos foram adotados à elaboração da carta da sensibilidade ambiental: (1) recursos faunísticos; (2) mosaico socioeconômico; (3) cobertura da terra; e (4) Índice de Sensibilidade Ambiental Terrestre (TESI). Como aplicação da metodologia, foram elaboradas Cartas SAO em cinco áreas piloto na Rodovia dos Tamoios, estado de São Paulo, as quais foram caracterizadas por possuírem TESI de classe intermediária, diversidade nas atividades socioeconômicas e na cobertura da terra e constante presença de espécies faunística. A busca à adequação da sensibilidade para ambientes terrestres possibilitou a sistematização de um índice que se mostrou eficiente, de produção rápida e simples.
Palavras-chave: incidentes em rodovias, Carta SAO, derrames de óleo, petróleo.
Introduction
The Environmental Sensitivity Index (ESI) map is an essential cartographic document for contingency actions in pollution events by oil and oil derivatives. Currently, the most commonly employed model for elaborating ESI maps comprises three main components: (1) a 1 - 10 scale environmental sensitivity ranking system in which high indexes correspond to greater environmental sensitivity; (2) biological resources sensitive to oil; and (3) the human use of recreational, subsistence, or commercially valuable resources (Jensen, Halls, & Michel, 1998).
Although oil spill ESI maps were originally conceived for coastal and marine environments and only later they were incorporated to other aquatic environments such as rivers, lakes and swamps (National Oceanic and Atmospheric Administration [NOAA], 1995), they do not take into consideration other types of environments (especially land environments) that might be polluted by oil spill events. Current bias is evidenced by the consolidation of methodologies oriented for the elaboration of oil spill ESI maps for aquatic environments, whereas those directed for terrestrial areas are rarely analysed (Martins, Riedel, & Milanelli, 2014).
In Brazil, the Pipeline Environmental Risk Mapping (Mara) methodology is the exception. It was developed in 2002, adopted for pipeline licensing and considers the terrestrial scenario within a gradient of environmental sensitivity.
Since maritime transportation is the most used modality worldwide, especially in the transport of oil across long distances (O’Rourke & Connolly, 2003), and also the one which causes most oil spills, it is understandable that priority is given to the development of oil spill sensitivity maps for coastal zones.
Distribution logistics of petroleum and its derivatives is a complex matter since several and different transport modes are employed. In Brazil, national and imported crude oils are transported to storage terminals, oil refineries, petrochemical plants and primary bases by sea and through pipelines. On the other hand, oil derivatives are mainly transported by railway and road networks. This setting is given, because, even with a mesh of pipelines in Southeast, South and Midwest, the pipeline network is considered still fledgling throughout Brazil, with low-key source-target links.
According to data by the Instituto Brasileiro do Meio Ambiente e dos Recursos Naturais Renováveis (IBAMA), the Brazilian official environmental agency, Brazilian federal highways, mainly BR-381, BR-040, BR-116, BR-101, BR-262 and BR-365, have the highest rates in accidents involving the transportation of dangerous products that jeopardize natural resources or present pollution risks to the environment. Between 2006 and 2014, most environmental accidents (1,455, or approximately 31%) in Brazil occurred on highways. The number is three times as much the amount of accidents for the second (oil rig accidents, with 479 occurrences) and third (oil industry with 449 occurrences) accident sources. Fuel and oil derivatives involved, with the highest number of occurrences, were mainly inflammable (IBAMA, 2011, 2012, 2013, 2014, 2015).
The above tally is reflected in accident indicators involving road transportation. According to the Companhia Ambiental do Estado de São Paulo (CETESB), road transport is the main activity with chemical emergencies in the state of São Paulo, totaling 4,656 (44,7%) occurrences reported between 1978 and 2015 (Cetesb, 2016). Road accidents involving petroleum derivatives are historically the most relevant in the state. Some examples may be forwarded: a road occident in 2006 on the Rodovia Washington Luiz spilled 38,000 L of diesel oil (Pioli, Haddad, Gouveia, & Greif, 2007); 20,000 L of styrene were spilled in a road accident on the Rodovia Ayrton Senna da Silva in 2007 (Cetesb, 2008); the spillage of 23,000 L of maritime diesel oil on the Estrada dos Tamoios in 2009, after the capsizing of an oil tank truck (Greif, Pioli, Haddad, Gouveia, & Vasconcellos, 2010); two accidents in 2010 spilled into the environment some 400 L of solvent liquid on the São Paulo road girdle complex and some 28,000 L of butyl acrylate on the Rodovia Presidente Dutra (Greif, Pioli, Haddad, Gouveia, & Vasconcellos, 2011). The consequences of oil spilling include death of domestic and wild animals, damage to soil and vegetation (Pioli et al., 2007); contamination of water sources, such as rivers (Greif et al., 2010, 2011) and reservoirs, with interruption of water supply to more than 200,000 homes (Pioli et al., 2007), death of fish and air pollution causing terrible smells and irritation of the eyes (Greif et al., 2011).
Due to increase in oil reserves and recent oil discoveries, especially within the pre-salt zone (Parshall, 2010), coupled to future world and Brazilian oil production, the issue of oil transportation should be a source of concern and planning.
Roads seem to be the most likely mode of transportation of oil derivatives in Brazil during the coming decades, since they are already intensively used within an extensive and comprehensive network that covers most of the Brazilian territory (Martins, Riedel, Milanelli, & Sturaro, 2014).
Thus, environments adjacent to roads are to be regarded as important areas for pilot studies on sensitivity to oil spills. Current paper proposes an approach for mapping environmental sensitivity towards oil in terrestrial environments, associated to road transportation. The experiment is applied to a highway in the state of São Paulo, Brazil.
Terrestrial environmental sensitivity index map
The application of the National Oceanic and Atmospheric Administration (NOAA) system and its variations to environmental sensitivity to oil in several places of the world (e.g., Jensen et al., 1993, Krishnan, 1995, Weslawski, Wiktor, Zajaczkowski, Futsaeter, & Moe, 1997, Wotherspoon, Marks, Solsberg, & West, 1997, Moe et al., 2000, Ministério do Meio Ambiente [MMA], 2004, Adler & Inbar, 2007, Castanedo et al., 2009) establishes it as an efficient tool in oil spill events.
The mapping of terrestrial environment sensitivity to oil must, at least, contain the same factors as those required in the NOAA system to facilitate the integration of adjacent areas with a variety of environments comprising terrestrial, coastal and fresh waters. Two types of environments, namely, resources which are biologically sensitive to oil and the human use of commercial, recreational or subsistence resources, are replicable in any type of sensitivity mapping. Data collection and cartographic representation mode may be integrally applied to the mapping of terrestrial sensitivity to oil spills.
Although current theory is foregrounded on NOAA methodology, the Brazilian alternatives in mapping sensitivity to oil spills may be employed for the application of the two factors mentioned above. For instance, the Brazilian Ministry for the Environment provides technical specifications and norms for the elaboration of the maps (MMA, 2007) which take into consideration the Brazilian marine environment, the biological resources and socio-economic aspects.
ESI is the only one of the NOAA system components that may not be directly applied to terrestrial environments. This condition is due to the particular mode of how ESI has been conceived and evolved, with its range of applications to aquatic environments, especially marine and coastal ones, resulting in specific variables, such as exposure to waves, which are evidently not applicable to terrestrial environments.
Thus, a comprehensive adjustment of the index system based on parameters consistent with terrestrial environment and respective oil dynamics in these environments, has been necessary. Current proposal´s main contribution comprises such adaptations.
In current paper, the term ‘oil’ is used generically and denotes all liquid petroleum-derivatives, maintained as such under normal conditions of temperature and pressure, transported by road in Brazil, for instance, Liquefied Petroleum Gas (LPG). Since the transport sector consumes approximately one third of the country´s energy matrix, with more than 73% derived from diesel oil and petrol (Empresa de Pesquisas Energéticas [EPE], 2016), current analysis focuses on these derivatives.
Terrestrial Environment Sensitivity Index (TESI)
Based on studies that launched the basis for the elaboration of ESI (Gundlach & Hayes, 1978; Michel, Hayes, & Brown, 1978) and the currently preponderant NOAA (Petersen et al., 2002), the solution found to define the index has been based on the physical processes controlling oil deposition, persistence or longevity in the environment and the extension of the biological damage (Gundlach & Hayes, 1978). The methodology proposed by the above authors took into account geomorphological aspects and was highly relevant for the period. Several biological and socio-economic aspects were added to the studies by different countries throughout the years.
In short, ESI is defined according to the geomorphological characteristics of habitats, taking into consideration the natural persistence of oil and the conditions for removing it (MMA, 2007).
The geomorphological characterization of the littoral for classification according to environmental sensitivity to oil is achieved by the identification of segments of interest or sections of study areas with homogeneous characteristics (MMA, 2004). The composition of an Environmental Sensitivity Index for terrestrial environments or Terrestrial Environmental Sensitivity Index (TESI) follows a similar scheme.
The terrestrial environment segment, called a landscape unit or a landform unit, represents a terrain area with similar properties of the physical environment´s factors. Areas are represented as polygons corresponding to terrain areas consistent with the terrestrial environments, which, unlike most representations of coastal sensitivity, are zonal rather than linear.
Five key variables that control the dynamics of oil in terrestrial environments are proposed for TESI composition: (1) slope, (2) soil texture, (3) soil depth, (4) water table depth and (5) density of drainage.
Each variable is subdivided into three classes. A partial environmental sensitivity (low, intermediate, high) with a specific color is attributed for each class. TESI is defined by a set of five partial sensitivities, one for each key variable. The procedure´s systematization and its conceptual correlation are described below.
Slope
Although the properties inherent to each type of oil and oil derivatives, such as viscosity, surface tension, density, among others, interfere in the behavior of the oil spill (United State Department of Agriculture [USDA], 1993), the behavior of the oil on the ground will first depend on the kind of land cover it encounters (Onwurah, Ogugua, Onyike, Ochonogor, & Otitoju, 2007). If the soil is impermeable, the oil will flow according to the surface´s declivity (Baku-Tbilisi-Ceyhan [BTC], 2011).
Since oil displaces itself vertically towards the subsoil by gravity (Fussell et al., 1981) and taking the class of low slope as a reference, the oil, which depends on the hydraulic conductivity of the soil, moves in the direction of the subsoil. In areas with high slope terrain, the flow of oil derivatives will follow the soil topography due to its liquid status and to gravity, even though the terrain is subjected to the permeability of the surface layer.
Slopes may help in emergency response plans to tackle oil spills since the direction of the oil flow may be estimated at the time of the accident. Declivity may indicate the direction of the oil flow in slope areas (Fussell et al., 1981).
Even though the contaminated horizontal area will be larger on the impacted site, environments with high slopes imply lower environmental sensitivity. The above statement is based on the ease in cleaning and remediating the areas in which oil does not reach an acute vertical displacement, a situation in which the oil may reach the saturated zone, amplifying its polluting capacity (Ferreira & Zuquette, 1998).
Soil texture
Soil type also impacts the horizontal and vertical extension of the spill (BTC, 2011). Taking as reference two properties derived from soil texture, namely, retention capacity and permeability, both of which influence the dynamics of oil in the soil and subsoil, it is possible to correlate particle size with its respective intrinsic impact. Table 1 demonstrates that the permeability of the soil profile increases according to the size of the soil´s grains.
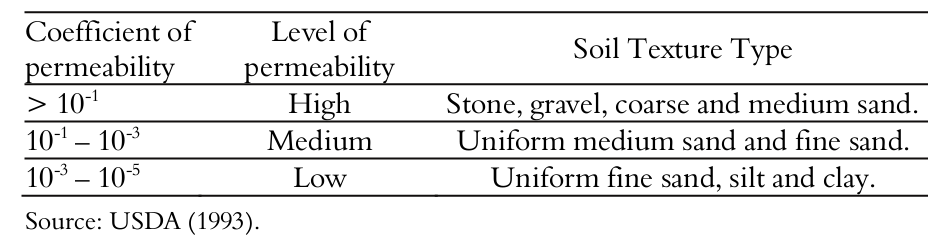
Inversely, materials composed of small grains have less permeability. In this case, there is a trend for hydraulic conductivity to worsen in the vertical direction and to improve in the horizontal one (Huling & Weaver, 1991; Newell, Acree, Ross, & Hulling, 1995). This condition reduces the probability of saturation, contaminating groundwater and decreasing the chances of oil reaching the fractured rocks.
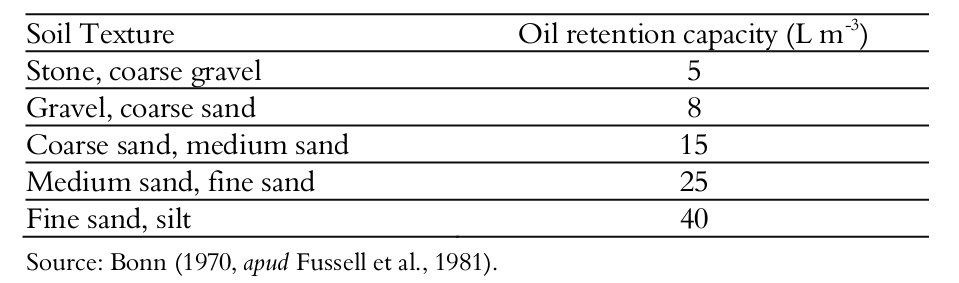
Table 2 demonstrates the correlation between grain size and oil retention capacity. In other words, fine granulometry of the soil material corresponds to a greater retention capacity of that soil.
The relationship between the soil´s retention capacity and environmental damage is similar to that for permeability, or rather, the greater the size of the grain, the bigger is the vertical dispersion, or rather, greater depths will be reached by the oil (Fussell et al., 1981) and the environment will be more sensitive. In fact, the difficulty to remove it increases, enhancing the possibility of other impacts, such as oil reaching the water table.
Therefore, it is very likely that the correlation between soil texture and environmental sensitivity to oil spills is direct: lowest sensitivity exists in areas where grains composing the soil profile are smallest.
Soil thickness (alteration profile depth)
Soil depth is perhaps one of the most complex aspects related to the environmental sensitivity to oil since it depends directly on other variables such as soil texture and depth of the water table.
The crucial problem when dealing with oil spills in an environment with thin soil profile is that the contaminant may reach a fractured rock. Retrieval of detailed information for a complete description of a fractured rock system is neither technically possible nor economically viable (Schmelling & Ross, 1989). Moreover, further complications in areas with thin soil profile may occur owing to the difficulty in removing soil by mechanical excavation to clean and recover the area. Although the excavation method may be the most economical method for the remediation of contaminated areas, it is not indicated for areas where rocky outcrops are present (Beynon et al., 1983). This condition denotes high sensitivity factors inherent to thin soil profiles. In fact, the shallower the soil layer is, the more complex is the remediation of the environments. On the other hand, it is possible to apply different methods in cleaning and remediation in deep soils and reduce the possibility of reaching a fractured rock layer.
Compounding the technical difficulty in cleaning and remediation, the oil may reach very quickly deeper and deeper regions of a fractured area, as the soil´s retention capacity tends to be extremely low (Mackay & Cherry, 1989). At this point, it is already possible to categorically establish the environmental sensitivity to oil by connecting the three variables mentioned above. A type of environment comprising low slope, sandy and shallow soil represents a scenario of high sensitivity to oil spills since it meets the feasible conditions for fast vertical displacement of the contaminant and combines a less favorable arrangements for natural containment and for procedures in oil removal.
Water table depth
The water table (WT) is probably the most studied variable when dealing with environmental sensitivity to oil spills. Most technical guides for oil removal in the (sub)soil focus on the WT, either as an asset to be protected or as a target vector of oil trajectory. This is particularly relevant if the oil runoff is directed towards rivers, lakes, sport-fishing areas, agricultural land, conservation units, water supply sources and others.
It is highly important to assess the correlation between WT depth and environmental sensitivity. The shallower the unsaturated zone, the easier will it be to reach the WT. If the spilled oil infiltrates the soil profile instead of being retained in the less permeable layer, it will critically reach the groundwater. Once it reaches subterranean waters, the oil may be carried off to other regions by the water current (Huling & Weaver, 1991, Newell et al., 1995). Even though dependent on the type of oil (can be light non-aqueous phase liquid - LNAPL; or dense non-aqueous phase liquid - DNAPL), it first floats close to the water level, following the hydraulic flux (Ferreira & Zuquette, 1998) or moves in other directions when oil monticules are formed (Newell et al., 1995), with a considerable increase in the sensitivity of the environment. In this case, the area impacted by the oil will increase due to the oil´s horizontal migration. Another situation that increases environmental sensitivity related to the WT occurs when soluble components are leached due to water percolation or to fluctuations of the groundwater (Huling & Weaver, 1991).
The importance of the water table depth in the environmental sensitivity to oil makes this variable a crucial factor in any type of environmental analysis involving petroleum and its derivatives.
Drainage density
Drainage density is the variable that completes the set of variables proposed for the composition of TESI. Drainage density has a close relationship with permeability, on a meso- and macro-scale.
Permeability in sedimentary areas is inversely proportional to drainage density, or rather, a high drainage density has low permeability since permeability depends on infiltration capacity. In crystalline areas, the correlation between drainage density and permeability is direct (Soares & Fiori, 1976). Thus, higher drainage density corresponds to higher permeability. The above correlation is correct because drainage in crystalline areas is very much conditioned by fracturing and oil tends to migrate between the fractures. Consequently, several fractures, which will condition the drainage, indicates high permeability of the environment. If the oil is spilled onto a solid crystalline area, such as granite or gneiss, with high density of drainage conditioned by fractures, there will be a great probability that the oil reaches great depths.
Tabulation of partial sensitivities and definition of TESI
The environmental index comprises five variables with three classes each. Since they form 243 different composites (Figure 1), a graphic analysis may be adopted to reduce this number to as close as possible to the 10 classes in the NOAA ranking. Different colors are attributed to each sensitivity level: green for low sensitivity; yellow for intermediate sensitivity; red for high sensitivity.
The method reduces the possible composites to 21 (Figure 2). Intervals of key variables used in Figure 2 are examples based on the application of five pilot areas employed for the Estrada dos Tamoios (Highway SP-099), eastern region of the state of São Paulo (see Application of the Proposal and Martins et al., 2014). Perhaps the employment of the graph for other highways may require adaptations to the local conditions.
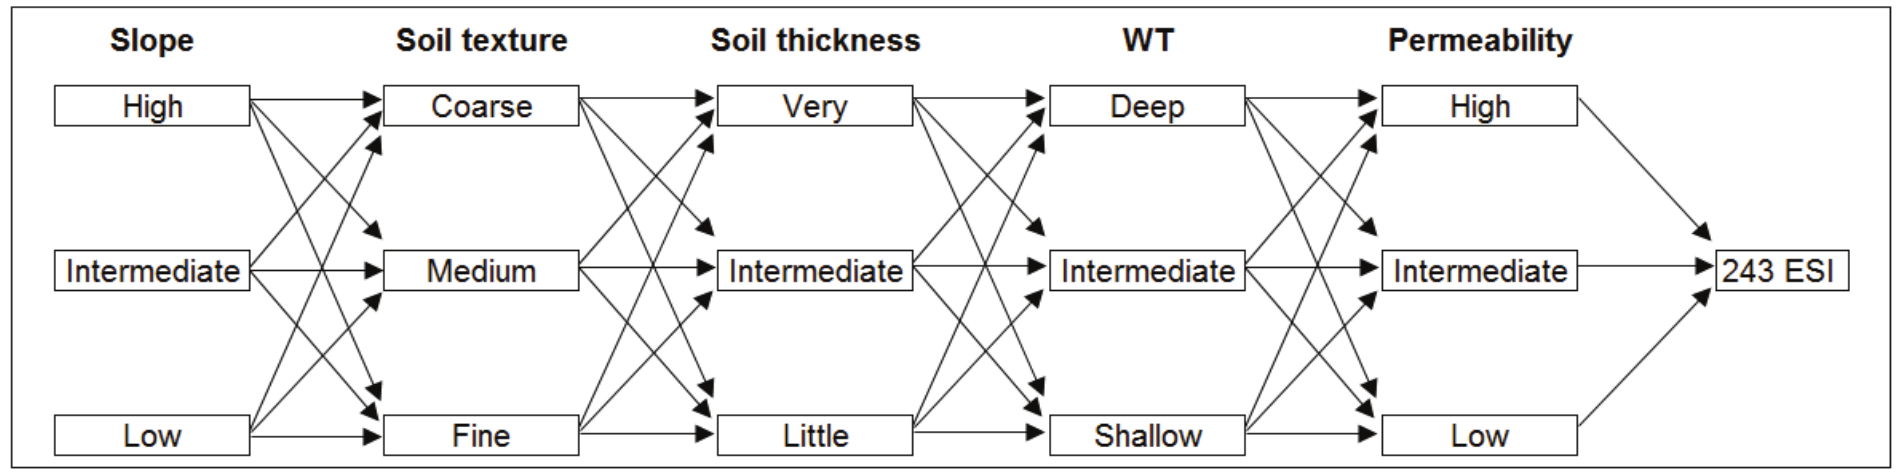
Figure 1.
Combinatory analysis of variable classes that compose TESI.
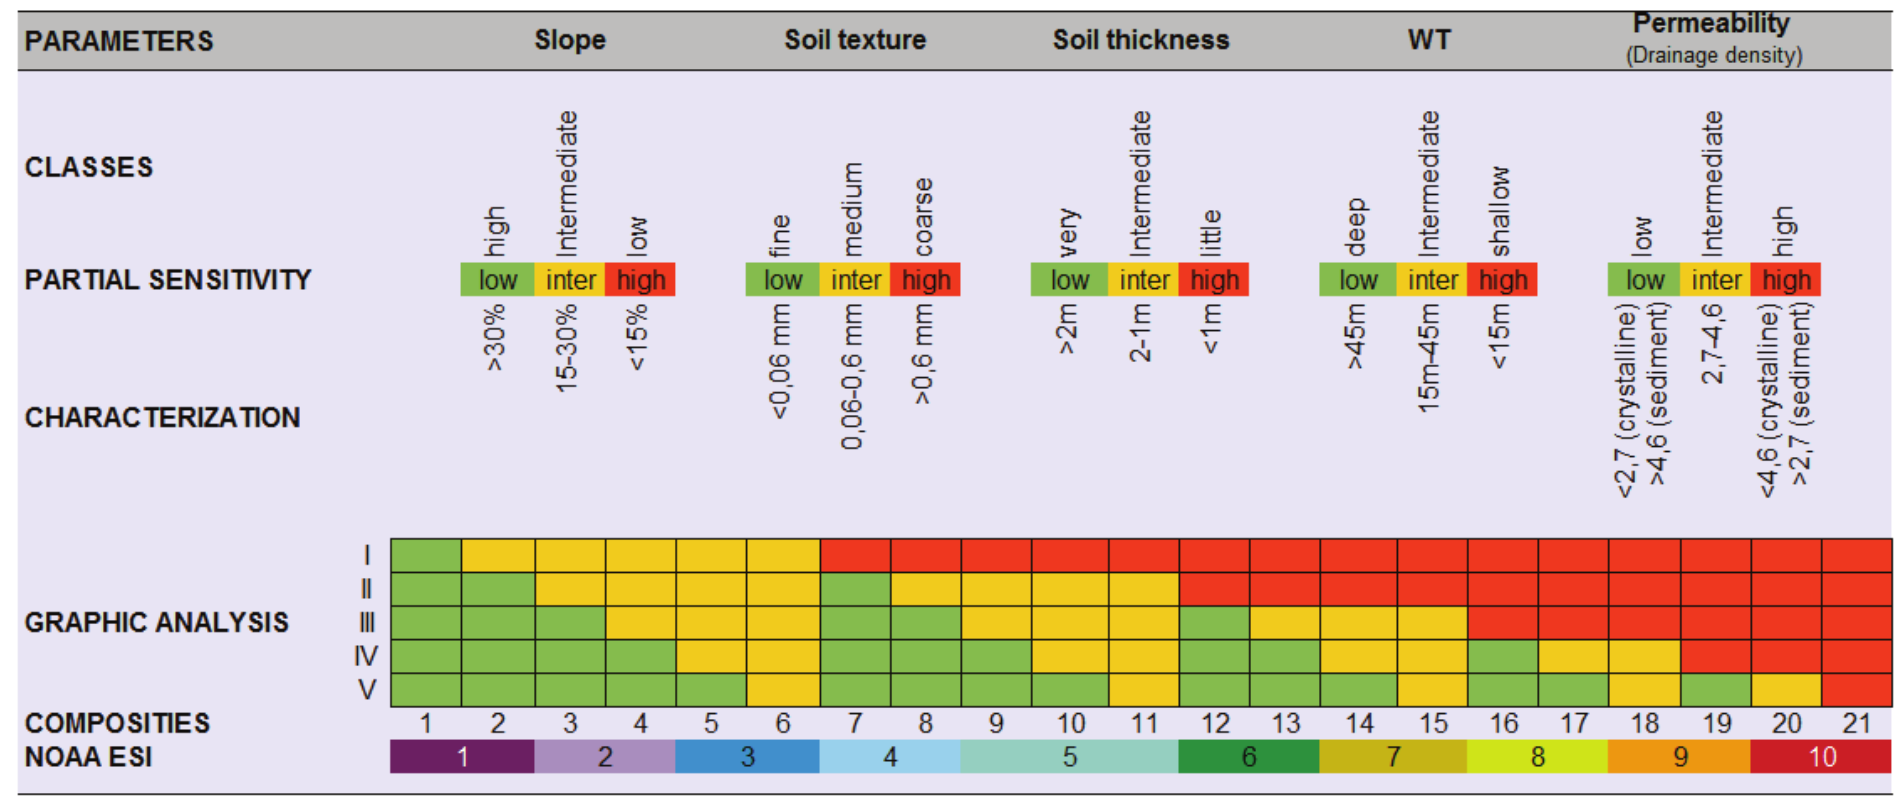
Figure 2.
Relative sensitivity attributed to each class of variables listed in the elaboration of TESI, graphic analysis and corresponding index.
Taking into consideration that all classes have the same environmental importance and are equivalent among themselves, if there are two classes of high sensitivity, one intermediate and two low, the final sensitivity will always be the same, regardless of the partial variables composing them.
Another aspect to be highlighted is the fact that, after codifying for the NOAA index, rate 5 is derived from three possible combinations (shown as numbers 9, 10 and 11). Thus, composites lacking high partial sensitivity are correlated to low sensitivity; composites with one or two high partial sensitivities are correlated to intermediate final sensitivity; and composites with three or more high partial sensitivities are related to high final sensitivity (Figure 2).
Other factors
Since data collection and the representation of biological resources and socio-economic activities may be applied as a whole, following norms for other environments (for instance NOAA and MMA, 2007, in the case of Brazil), the analyzed groups belong to the mapped area and, therefore, may be found in national handbooks. However, several symbols have been introduced to represent the occurrence of species and land uses more proper to terrestrial environments and not so representative of coastal ones. This applies to terrestrial mammals (primates, felines, rodents among others), with dense population in some parts of the world, several kind of birds, agricultural and cattle breeding activities, water supply stations or commerce and road administration services, common to road areas (Figure 3).
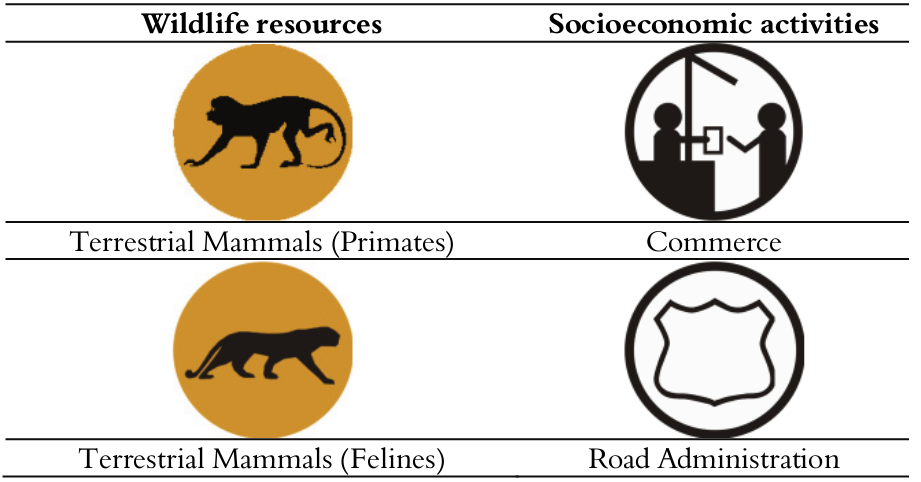
Figure 3.
Examples of representative groups of fauna and activities (Brazil).
It should be underscored that, in the mapping of coastal environments, biologically sensitive resources are only related to fauna (e.g., nesting sites, breeding, nursery, feeding areas), since vegetation is already intrinsically represented by ESI, both closely correlated factors (MMA, 2004).
Thus, land use and land cover mapping compose the terrestrial environmental sensitivity index. Land cover is a crucial element in oil spill events in terrestrial environments, since the oil may reach biological and socioeconomic components, depending on the type of land cover.
Impact on the biota is less likely in areas with established artificial land cover. Contrastingly, the socioeconomic environment is the most impacted factor. On the other hand, the biota will certainly be impacted in forest/woods areas. The adequacy of the land cover item to the map of environmental sensitivity to oil may be achieved in two ways. The first is through the availability of a land cover map annexed to the sensitivity map; second, land cover as an auxiliary index connected to TESI. In the latter model, land cover is represented by lower case letters of the Latin alphabet.
The proposed ranking of an auxiliary index attributes the first letters of the Latin alphabet to areas without land cover, such as those representing rocky outcrops and established artificial areas; intermediary letters represent areas with low land cover density and under anthropic management, such as areas with herbaceous, shrubby and agricultural cover; the last letters represent areas of dense vegetation, such as woods and forests (Table 3).
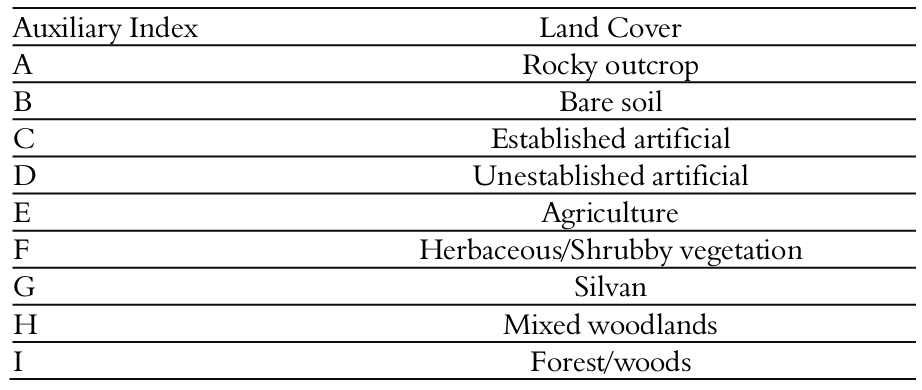
Thus, if an area has TESI 8 plus forest/woods land cover, it constitutes class 8I. The cartographic representation adopted for this auxiliary index is given through hatching, making possible the simultaneous visualization of TESI and land cover. The above representation of land cover is highly practical since it includes the two indexes within the same area and scale. However, the need for constant updating of this kind of information, the small size of some land cover polygons and the amount of information composing a map may affect somewhat negatively the map´s quality.
Application of the proposal
Production of ESI Maps for the Estrada dos Tamoios (Highway SP-099)
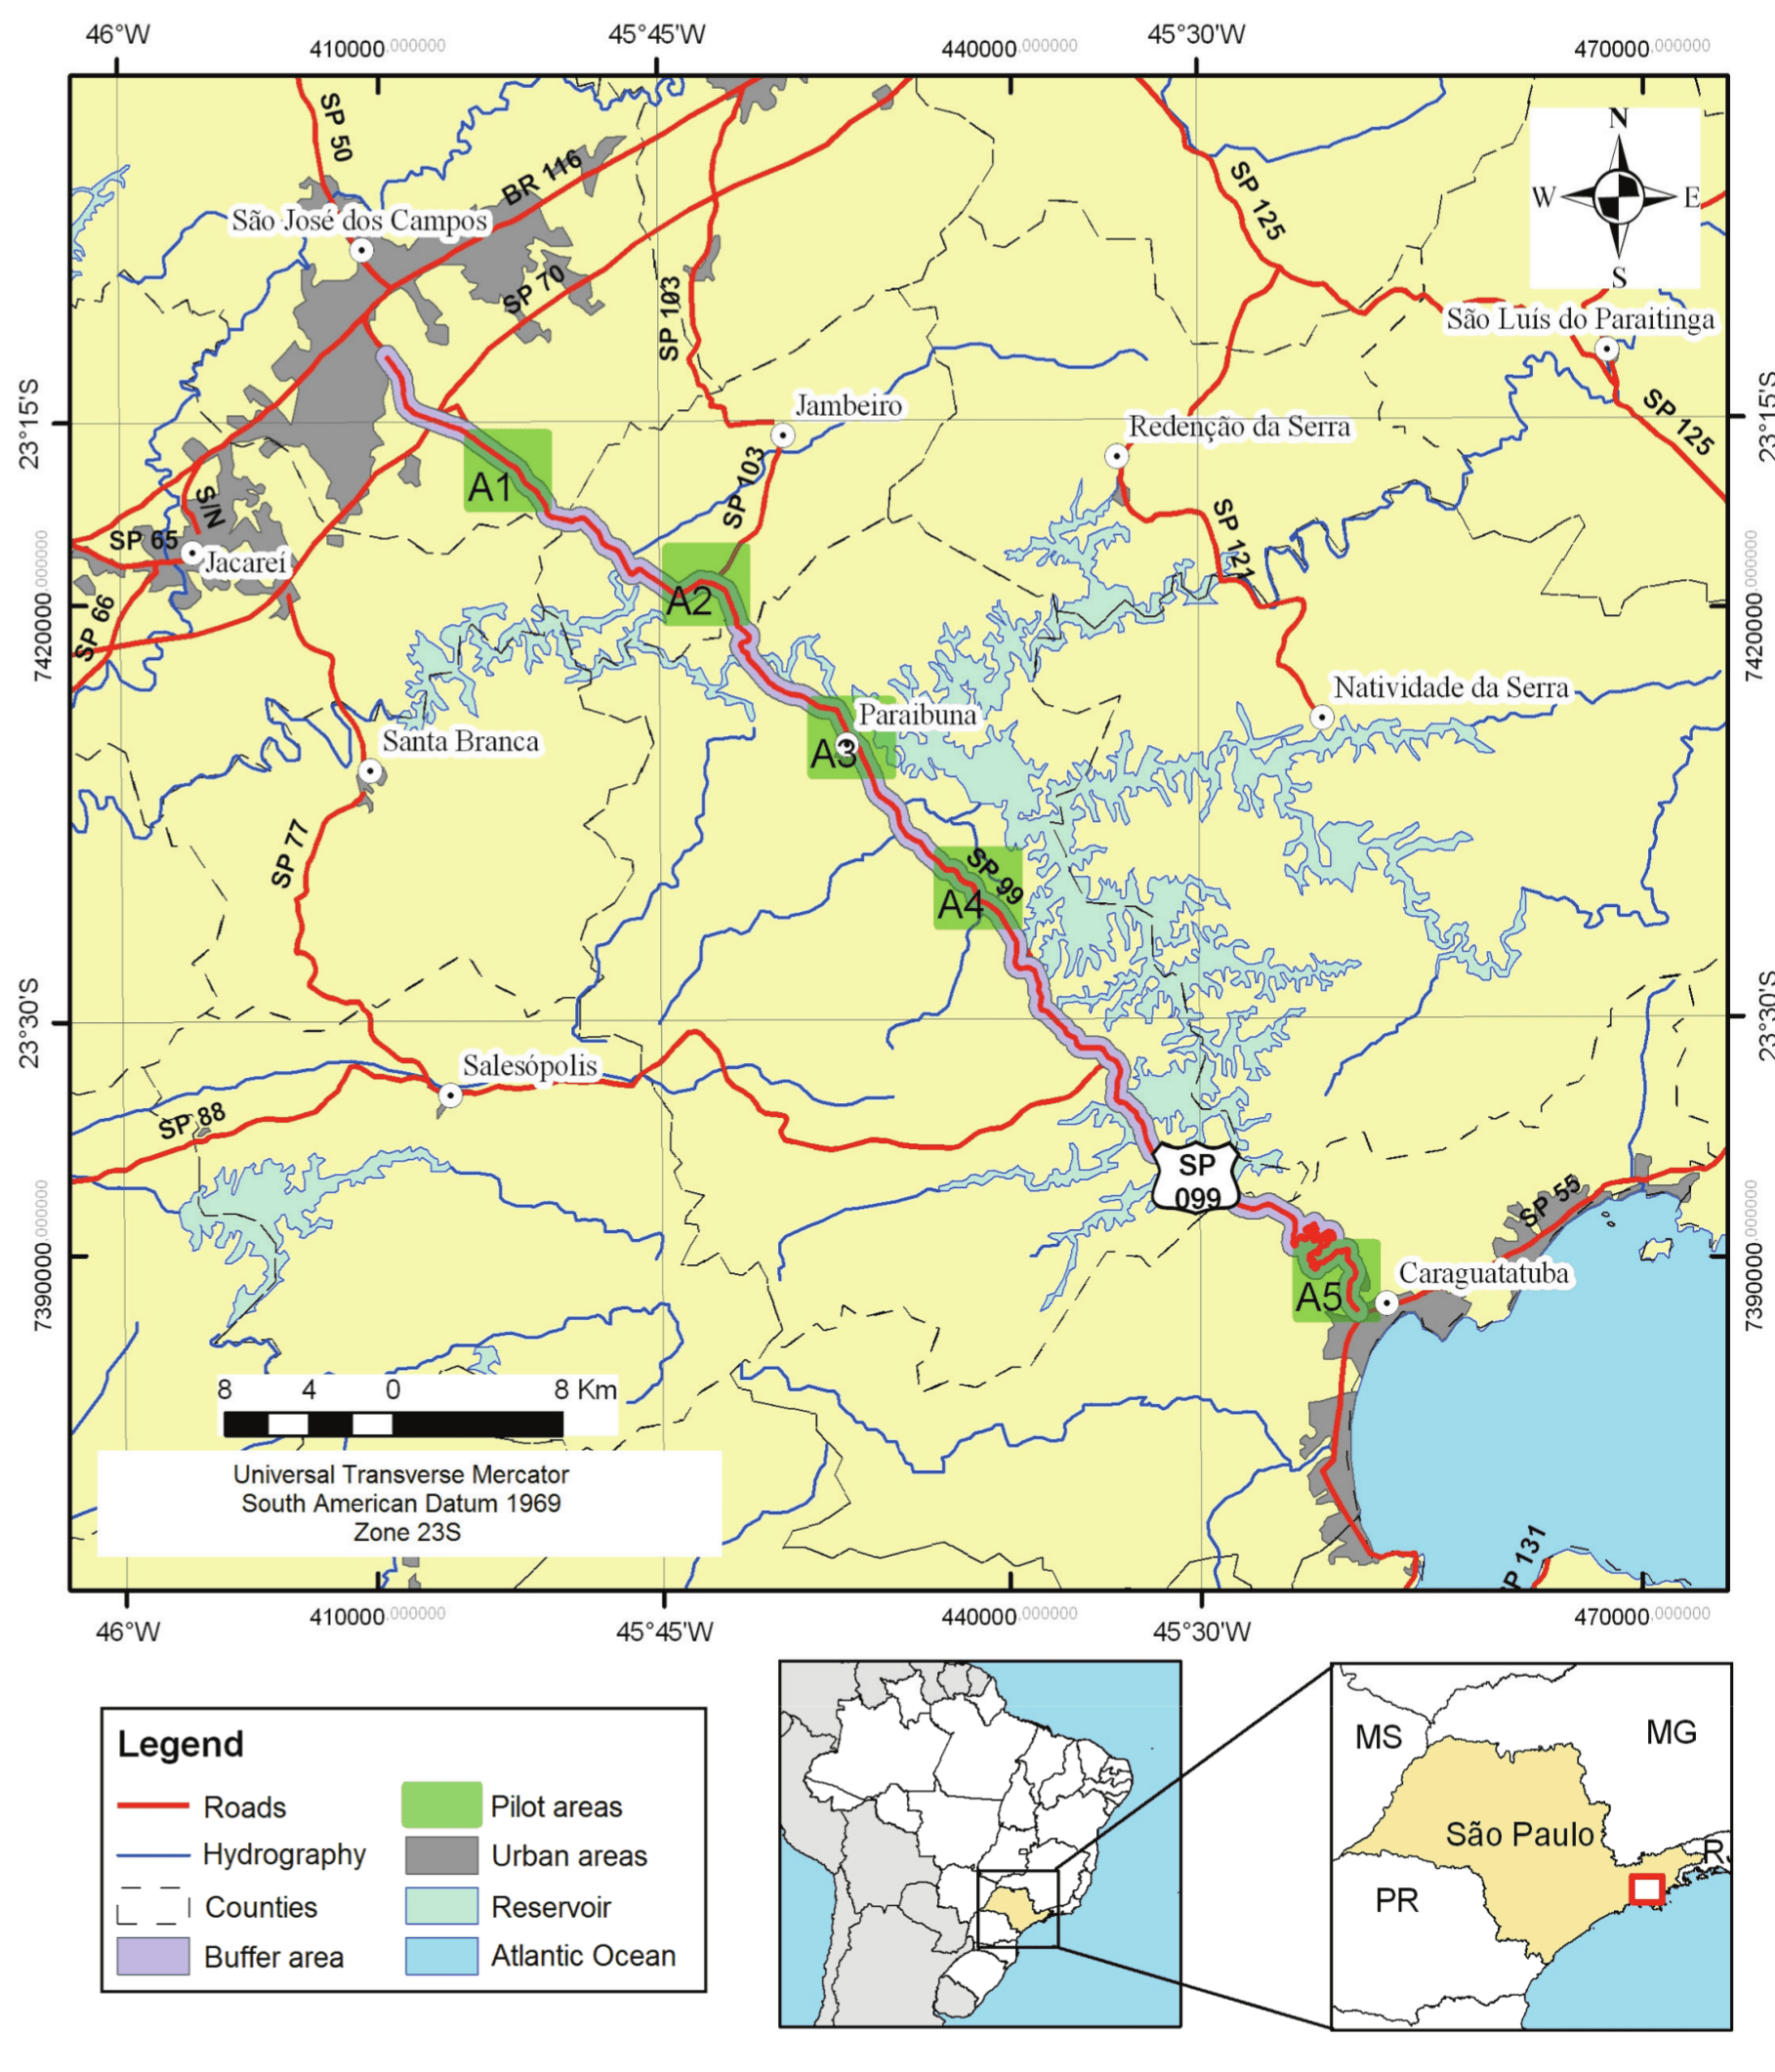
Based on combined theoretical and practical aspects, the ESI Map was applied to the Estrada dos Tamoios by defining the pilot areas and limiting a 500 m buffer area on both sides of the highway (Annex 2).
The topographic maps of the 1977 Cartographic Plan of the State of São Paulo (scale 1:10.000) were employed. They were scanned, geo-referenced, vectored and shaded relief images were reproduced within the Geographic Information System (GIS) where all the stages for the production of ESI Maps occurred.
TESI´s environmental segments were defined by identifying the land´s homogeneous zones using the physiographic compartment technique and employing the logic and systematic interpretation of aerial photography proposed by Soares and Fiori (1976) and its adaptation for orbital images undertaken by Veneziani and Anjos (1982). Satellite SPOT colored orthorectified images were employed, with 2.5 m spatial resolution and dated between 2007 and 2009. Relief features, analyzed and used for the delimitation of homogeneous zones, were based on Ponçano, Carneiro, Bistrichi, Almeida, and Prandini (1981). A database was thus established in GIS, where polygons, corresponding to the several compartments, were named according to the classification of key variables and constituting an environmental segment.
The drainage network was identified and vectored from SPOT images, aided by shaded relief images from which drainage density was generated by kernel density algorithm in GIS. Due to close co-relationship with permeability, the density class intervals were co-related to ‘relative permeability’ and divided according to intervals (Figure 2). Calculations of rates for high density class within each environmental segment were added to the database.
‘Slope rate’ was based on topographic maps taking into account the following intervals: high (> 30%); intermediate (15-30%); low (< 15%), and then added to the database after geoprocessing zonal operation (called majority).
The ‘soil texture’ was determined by analyzing the embankment type and confirmed by granulometry assays of samples collected during field work. Granulometry rates were tabulated and grouped into three classes, following Figure 2, and added in GIS as a factor in the database of the environmental segments.
Classes in alteration profile ‘thickness’ were provided by the analysis of segments with regard to top extension and type, slope and embankment type, followed by field work in which the thickness of the alteration profile within the compartments was measured. Exposed profiles on the highways and the river embankments were used. Classes comprise intervals given in Figure 2.
The variable ‘water level’ depth (WL) was estimated by the thickness of the unsaturated zone (Sturaro, in press), with topographic maps, SPOT images, field work and data on WL depth available in the authorization report of the Departamento de Águas e Energia Elétrica of the state of São Paulo (Daee, 2011) and in the Study on Environmental Impact (EIA) of the Rodovia dos Tamoios (Fundação Escola de Sociologia e Política de São Paulo [FESPSP], 2007). Tabulated registers were transformed into a regular network and subtracted from the topographic network. The variable´s classes were defined according to intervals provided by Figure 2, and added to the database, associating predominance to the homologous zone.
After establishing classes for all key variables and after including related information to the database, partial environmental sensitivity (low, intermediate and high) was given to each class. Final Terrestrial Environmental Sensitivity Index of the environmental segment was defined by graph analysis (Figure 2).
‘Socio-economic activities’ in the pilot areas were identified through field work. Geographical coordinates, photographs and descriptions of all activities on the buffer were identified and registered. ‘Fauna survey’ was mainly provided by bibliographical research (Programa de Pesquisas em Conservação e Uso Sustentável da Biodiversidade do Estado de São Paulo [Biota-Fapesp], 2004; FESPSP, 2007; IF, 2008, Coordenação de Aperfeiçoamento de Pessoal de Nível Superior [Capes], 2009). Species´ geographical localization, phytophysionomy and photographs were eventually registered and added to GIS database and represented cartographically according to MMA (2004).
‘Land cover’ was mapped by visual interpretation of SPOT images with interpretation tools described by Jensen (2009), coupled to field work.
Evaluation of the environmental sensitivity of the Estrada dos Tamoios (Highway SP-099)
Scale 1:15,000 in which the Maps were produced, corresponds to small- and medium-sized typology discharge, with a relatively restricted horizontal dispersion, featuring activities at operational level (MMA, 2004). Detailed scale reveals relevant local environmental aspects within the emergency mode. Figure 4 shows an example of the product obtained.
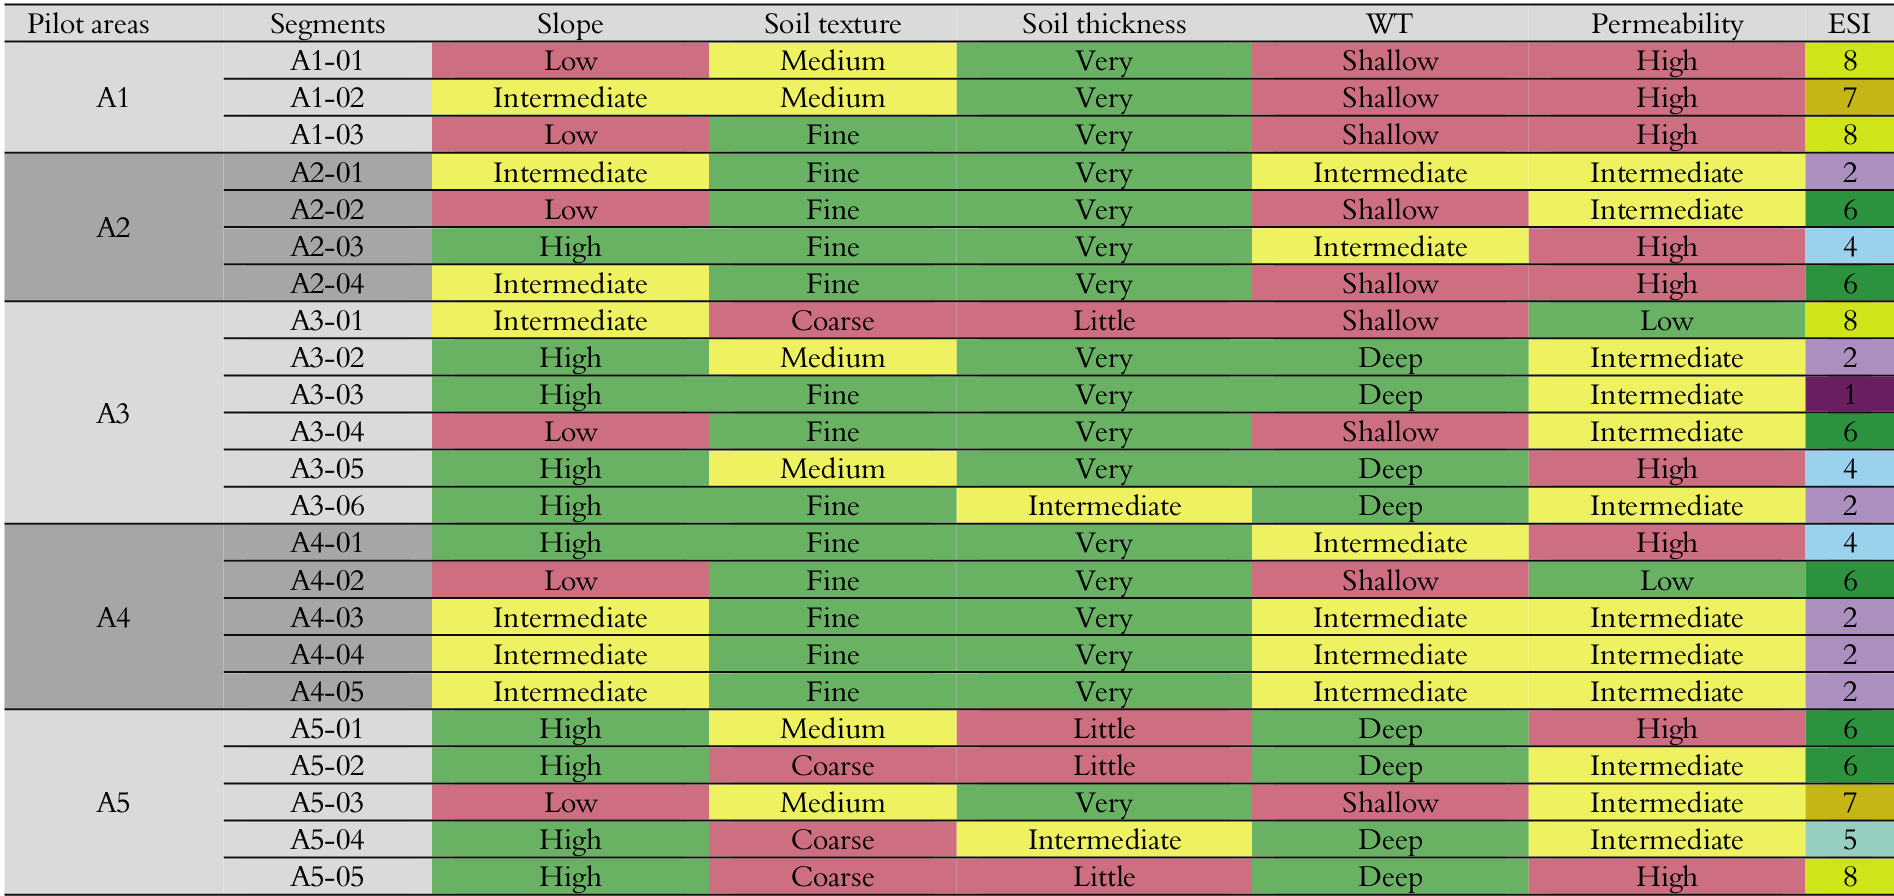
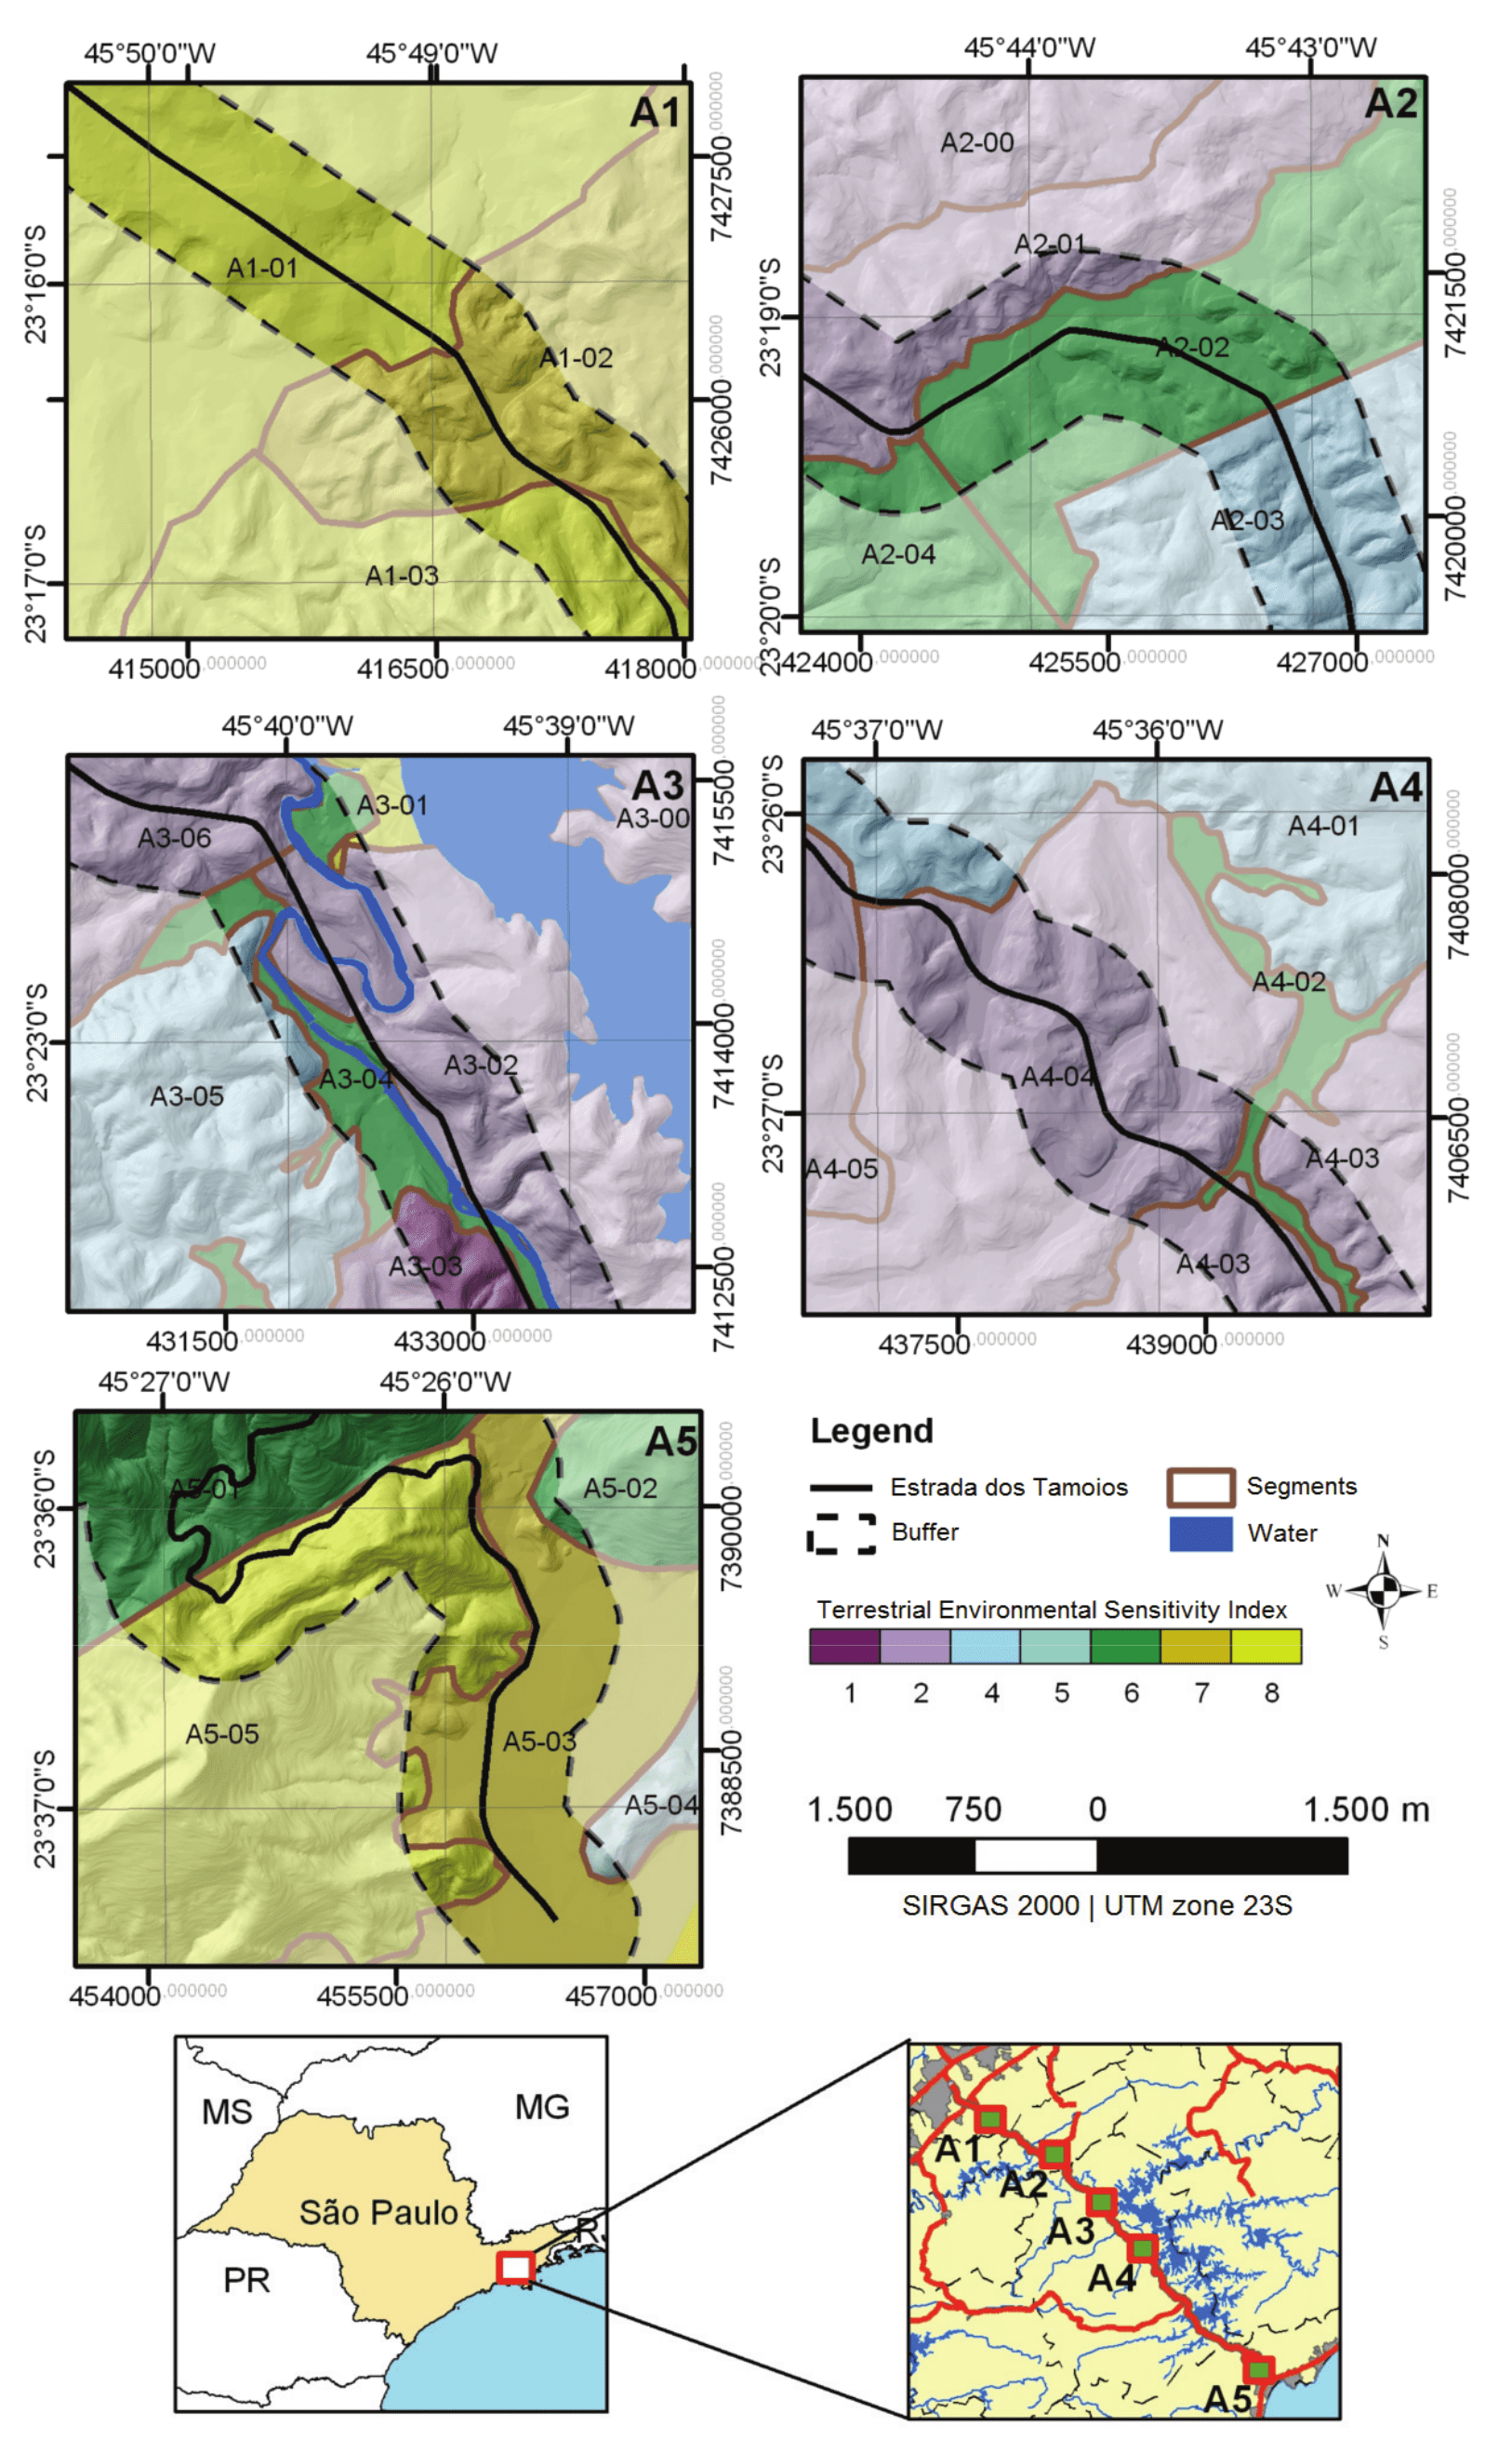
The application of physiographic compartments to the Estrada dos Tamoios provided 23 environmental segments divided into five pilot areas (Annex 3). Pilot area A3 has the highest number of segments, whereas A1 has the smallest number (just three). Final TESI of the segments of the pilot areas, with their respective classes and partial sensitivities, is given in Annex 1.
There are seven classes of environmental sensitivity to oil, identified in the pilot areas of the Estrada dos Tamoios. Classes 2 and 6 are constantly recurring and occur in six segments each. Excepting the three classes absent in areas 3, 9 and 10, the less occurring classes are 1 and 5, with only a single segment (see annexs 1-4).
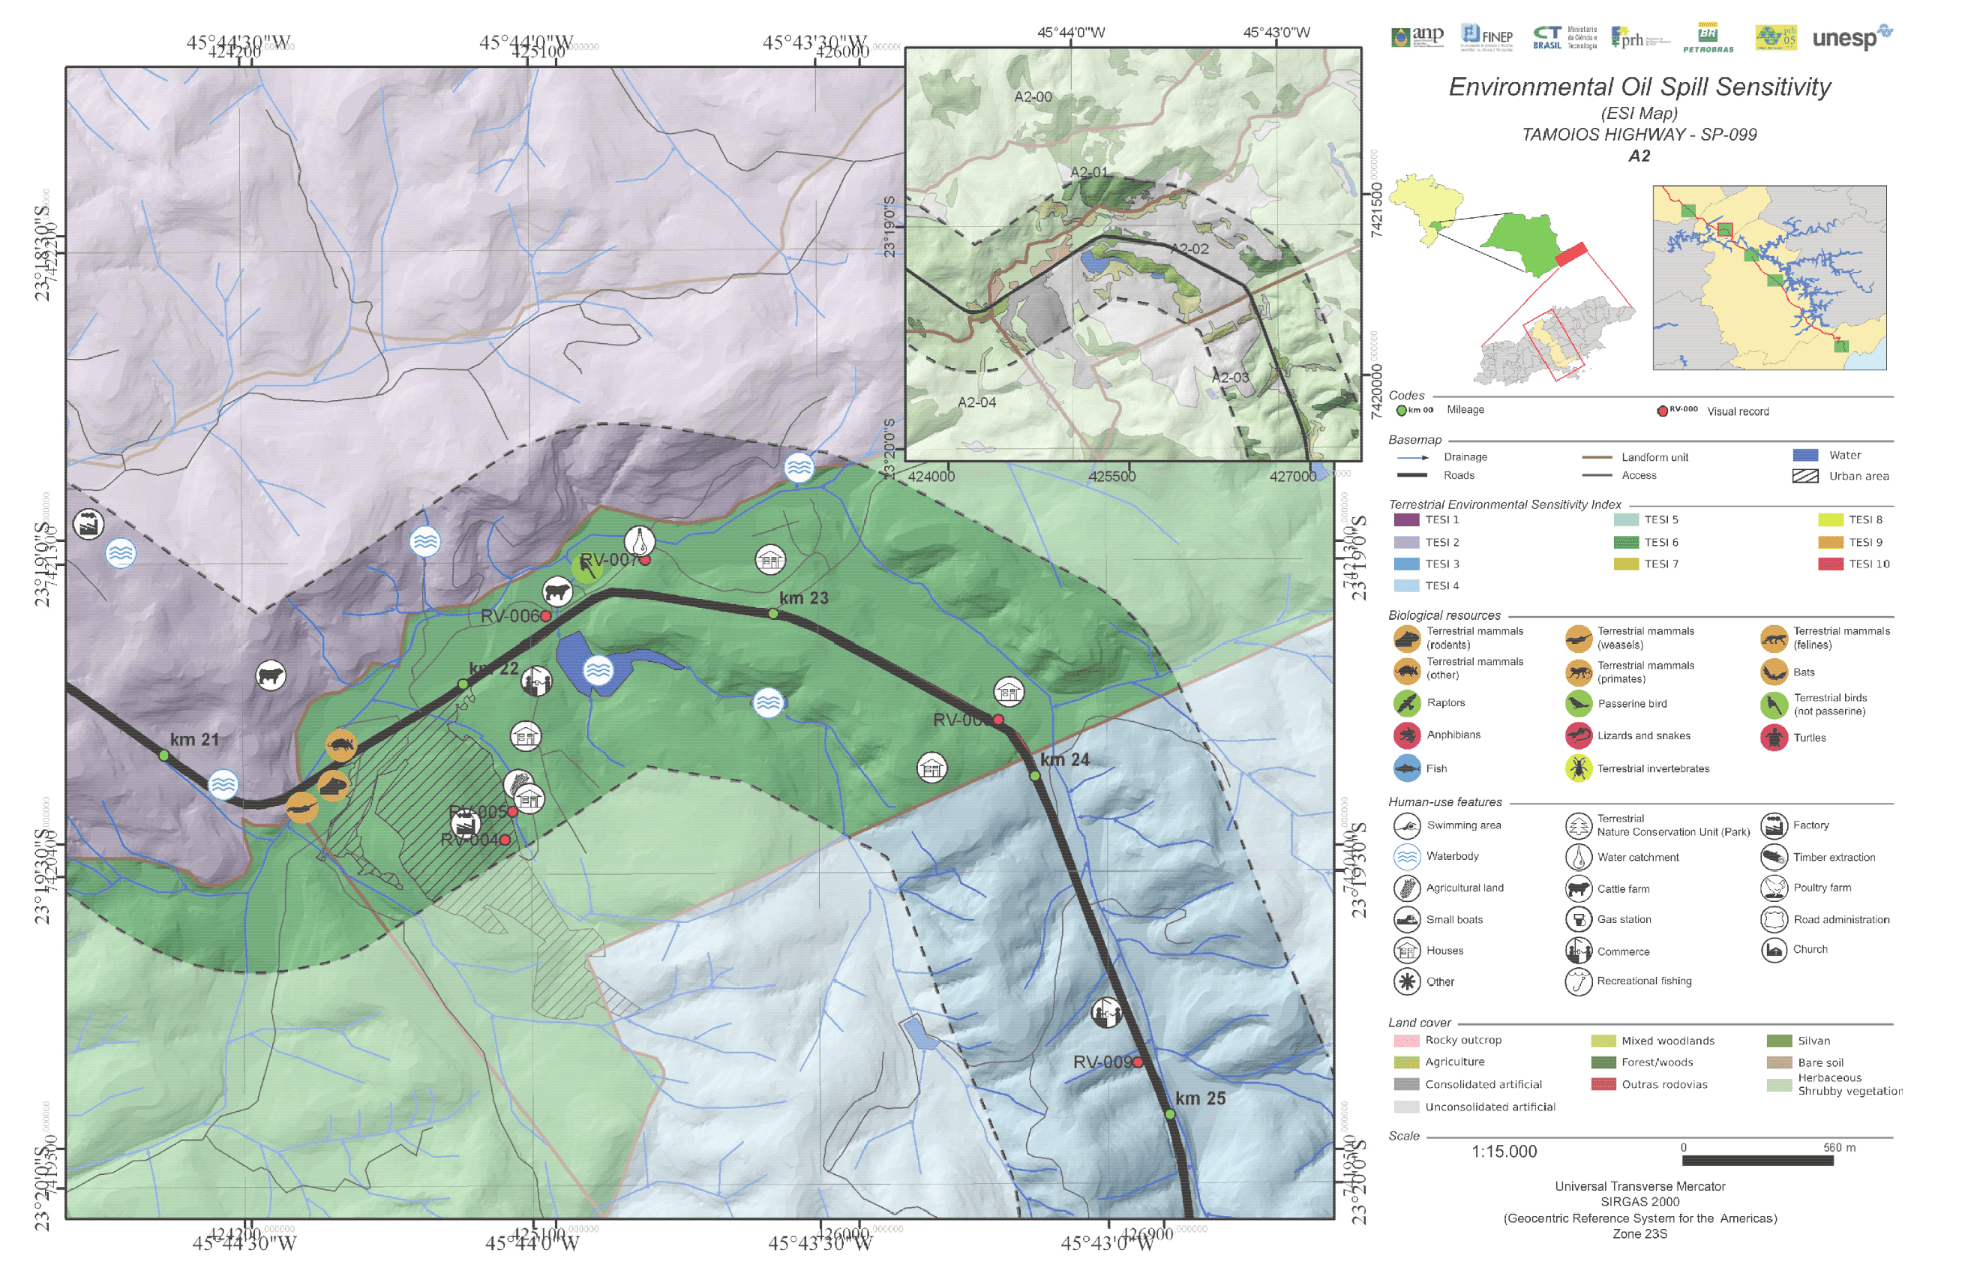
Figure 4.
Sample ESI map. Pilot area A2.
Class 2 with over 773 ha has the biggest extension. Classes 6, 7 and 8 are equally representative, especially in areas A1 and A5, with similar divisions between high, intermediate and low sensitivity to oil in the pilot areas. Whereas Area A1 is the most sensitive to oil, with segments featuring the highest sensitivity classes, areas A2 and A4 are the least sensitive.
Socio-economic activities on the Estrada dos Tamoios comprise recreational groups, area under special administration, extraction of natural resources, transport and other types of occupation. Homes, animal husbandry and small pools predominate in the pilot areas A1, A2, A3 and A4. Contrastingly to the other pilot areas, A5 comprises the lowest density in socio-economic activities due to forest fragments in more than 50% of the area and to a conservation area (CA) adjacent to the forest fragment.
The above description features the occupation model throughout the highway and implies in possible contamination of humans in oil spilling events, compounded by the abundance of lakes in the analyzed area which may drain the contaminants towards an extensive area downstream.
Positioning of socio-economic activities may be confirmed by 9 classes of land cover, or rather, rocky outcrops, agriculture, established artificial cover, non-established artificial cover, mixed wood, forest, woodland, exposed ground and herbaceous vegetation/shrubs.
Herbaceous vegetation and shrubs, linked to livestock, predominate in the pilot areas, with the exception of A5 where the buffer is mainly occupied by forest and by established artificial cover, with rocky outcrops exclusively in this particular area.
The ‘established artificial cover’ occurs in four out of the five pilot areas (A1, A2, A3 and A5), whereas A4, comprising the ‘woodland’ class, occurs in a significant way within the buffer. Coupled to erosion processes, the activity has been the cause of exposed soil in several areas. Mixed wood cover occurs in A1, A2, A3 and A4, characterized by small dispersed spots.
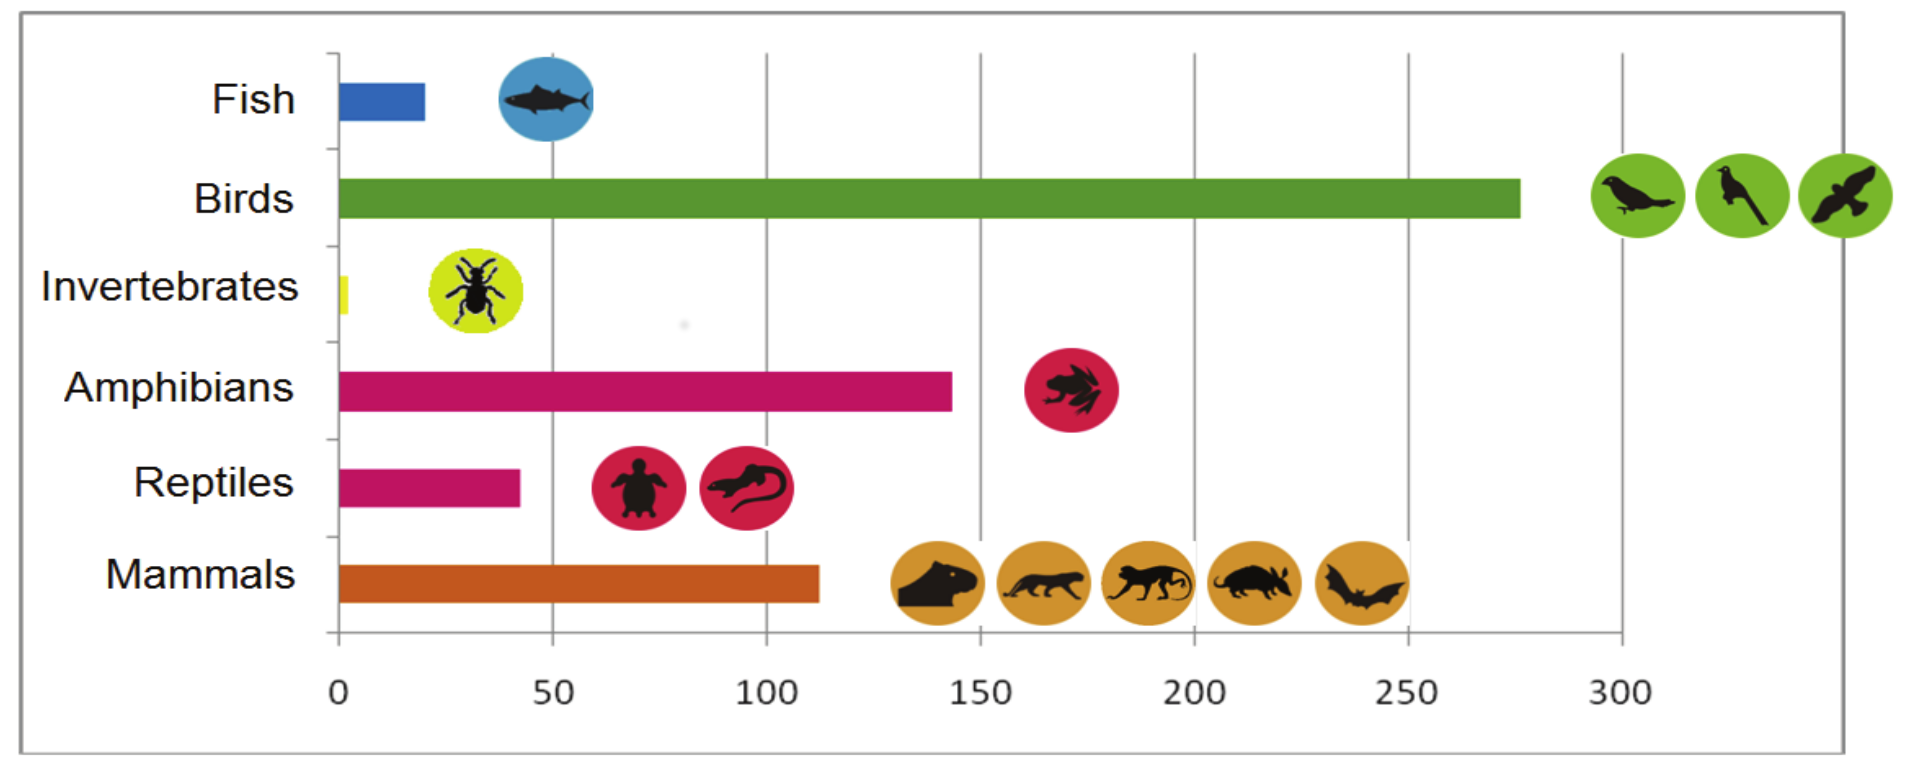
Further, 595 animal species, belonging to six groups, have been identified in the five pilot areas (Annex 4). Bird species have the greatest richness (approximately 46%), while mammals were the single group in the five areas. Survey revealed low number of land invertebrates, with only two identified species.
Due to great fauna variety, associated to forest fragments, A5 should have protection priority because of its high vulnerability. Moreover, access to the area is somewhat difficult and restricted. A1 is the area with the lowest variety rates and lowest fauna group rates, probably due to the town nearby and its inherent anthropic activities.
Conclusion
A sensitivity index proper to terrestrial environments made possible the systematization of an index shown to be efficient, quick and simple to produce. It must be underscored that current proposal, similar to the report on the Environmental Impact Study (EIA), is a technical document which must be applied by multidisciplinary teams comprising professionals specialized in the physical environment, biota and socio-economic aspects. Further, due to its condition as a thematic map, the expert reader should be able to interpret the document and be competent in its application. Information and interpretations are a help and a contribution to the authorities who are primary responsible for decision-taking during emergencies.
Owing to the proposal´s innovatory stance, modifications are expected after adaptation trials. These conditions are part of the methodological evolution and must be framed as such. It must be associated to road planning, coupled to the responsibility of road engineers and constructors.
Another possibility of breaking down the methodology proposed is to fit TESI to three classes only (low, intermediate and high), widely applied in environmental studies.
Supplementing land cover as an annex or even as an auxiliary index is a methodological possibility that has to be considered in these circumstances. In mapping sensitivity of terrestrial environments, land cover must be included as another factor, such as the TESI, biological resources or socioeconomic activities.
Current proposal proved to be applicable and enabled the sensitivity mapping of an area of great environmental complexity as the areas adjacent to the Estrada dos Tamoios in the state of São Paulo, associated to areas with intermediate sensitivity.
Current methodology and its application should certainly be fine-tuned after analyzing possible inconsistences during real situations in the event of accidents involving oil spills.
Acknowledgements
The authors would like to thank the Agência Nacional do Petróleo, Gás e Biocombustíveis (ANP) and Petróleo Brasileiro S.A. (Petrobras) for their funding through the Program for the Formation of Human Resources for Gas and Petroleum Sector (PRH-05).
Thanks are also due to the Universidade Estadual de Goiás for the research grant (Programa de Bolsa de Incentivo à Pesquisa e Produção Científica - PROBIP/UEG) to the first author, to the Coordenadoria de Planejamento Ambiental (CPLA) of the Secretary for the Environment of the State of São Paulo for the use of SPOT photos and to the anonymous reviewers for their comments, which helped us to clarify and improve this paper.
Annexs
Annex 1.
Synthesis of partial and final environmental sensitiveness for each segment.
Annex 2.
Location of the areas of application of the proposal.
Annex 3.
Spatial distribution of ESI in pilot areas.
Annex 4.
Number of species per group in pilot areas.
References
Adler, E., & Inbar, M. (2007). Shoreline sensitivity to oil spills, the Mediterranean coast of Israel: Assessment and analysis. Ocean and Coastal Management, 50(1-2), 24-34.
Baku-Tbilisi-Ceyhan [BTC]. (2011). Potential impacts of oil spillage to an onshore environment. BTC General Oil Spill Response Plan. Appendix F. Retrieved from http://www.bp.com/liveassets/bp_internet/bp_caspian/bp_caspian_en/STAGING/local_assets/downloads_pdfs/xyz/BTC_English_General_OSRP_Content_Appendix_F.pdf
Beynon, L. R., Gödjen, H., Lilie, R. H., Aston, G. H. R., Sibra, P., & Stapleford, J. K. (1983). A field guide to inland oil spill clean-up techniques. The Hague, South Holland: Concawe.
Castanedo, S., Juanes, J. A., Medina, R., Puente, A., Fernandez, F., Olabarrieta, M., & Pombo, C. (2009). Oil spill vulnerability assessment integrating physical, biological and socio-economical aspects: Application to the Cantabrian coast (Bay of Biscay, Spain). Journal of Environmental Management, 91(1), 149-159.
Companhia Ambiental do Estado de São Paulo [CETESB]. (2008). Relatório de emergências químicas do Estado de São Paulo 2007. São Paulo, SP: Cetesb.
Companhia Ambiental do Estado de São Paulo [CETESB]. (2016). SIEQ - Sistema de Informações sobre Emergências Químicas da CETESB. Recuperado de http://sistemasinter.cetesb.sp.gov.br/emergencia/relatorio.php
Coordenação de Aperfeiçoamento de Pessoal de Nível Superior [CAPES]. (2009). Novo portal de periódicos Capes. Recuperado de http://novo.periodicos.capes.gov.br/?option=com_phome&Itemid=68&
Departamento de Águas e Energia Elétrica [DAEE]. (2011). Relatório de outorgas do Departamento de Águas e Energia Elétrica do Estado de São Paulo. Recuperado de http://www.aplicacoes.daee.sp.gov.br/usosrec/fchweb.html
Empresa de Pesquisas Energéticas [EPE]. (2016). Balanço energético nacional: relatório síntese - ano base, 2015. Retrieved from ben.epe.gov.br/
Ferreira, J., & Zuquette, L. V. (1998). Considerações sobre as interações entre contaminantes constituídos de hidrocarbonetos e os compostos do meio físico. Geociências, 17(2), 527-557.
Fundação Escola de Sociologia e Política de São Paulo [FESPSP]. (2007). Estudo de Impacto Ambiental (EIA). Duplicação do Sub-trecho Planalto (SP-099) Km 11+500 ao Km 64+400, v. 1. Referência do anexo 2. São Paulo, SP: FESPSP.
Fussel, D. R., Godjen, H., Hayward, P., Lilie, R. H., Marco, A., & Panisi, C. (1981). Revised inland oil spill clean-up manual. The Hague, South Holland: Concawe.
Greif, S., Pioli, A., Haddad, E., Gouveia, J. L. N., & Vasconcellos, A. R. (2010). Relatório de emergências químicas atendidas pela Cetesb em 2009. São Paulo, SP: Cetesb.
Greif, S., Pioli, A., Haddad, E., Gouveia, J. L. N., & Vasconcellos, A. R. (2011). Relatório de emergências químicas atendidas pela CETESB em 2010. São Paulo, SP: Cetesb.
Gundlach, E. R., & Hayes, M. O. (1978). Vulnerability of coastal environments to oil spill impacts. Marine Technology Society Journal, 12(4), 18-27.
Huling, S. G., & Weaver, J. W. (1991). Dense nonaqueous phase liquids. Ground water issue. Oklahoma City, OK: EPA.
Instituto Brasileiro do Meio Ambiente e dos Recursos Naturais Renováveis [IBAMA]. (2011). Relatório de acidentes ambientais 2010. Retrieved from http://www.ibama.gov.br/documentos/publicacoes
Instituto Brasileiro do Meio Ambiente e dos Recursos Naturais Renováveis [IBAMA]. (2012). Relatório de acidentes ambientais 2011. Recuperado de http://www.ibama.gov.br/documentos/publicacoes
Instituto Brasileiro do Meio Ambiente e dos Recursos Naturais Renováveis [IBAMA]. (2013). Relatório de acidentes ambientais 2012. Recuperado de http://www.ibama.gov.br/documentos/publicacoes
Instituto Brasileiro do Meio Ambiente e dos Recursos Naturais Renováveis [IBAMA]. (2014). Relatório de acidentes ambientais 2013. Recuperado de http://www.ibama.gov.br/documentos/publicacoes
Instituto Brasileiro do Meio Ambiente e dos Recursos Naturais Renováveis [IBAMA]. (2015). Relatório de acidentes ambientais 2014. Recuperado de http://www.ibama.gov.br/documentos/publicacoes
Instituto Florestal de São Paulo [IF].. (2008). Plano de Manejo: Parque Estadual da Serra do Mar. Recuperado em 17 dez. de 2009 de http://www.fflorestal.sp.gov. br/planodemanejoCompletos.php
Jensen, J. R. (2009). Sensoriamento remoto do ambiente: uma perspectiva em recursos terrestres. São José dos Campos, SP: Parênteses.
Jensen, J. R., Halls, J. N., & Michel, J. (1998). A system approach to Environmental Sensitivity Index (ESI) mapping for oil spill contingency planning and response. Photogrammetric Engineering and Remote Sensing, 64(10), 1003-1014.
Jensen, J. R., Narumalani, S., Weatherbee, O., Murday, M., Sexton, W. J., & Green, C. J. (1993). Coastal environmental sensitivity mapping for oil spills in the United Arab Emirates using remote sensing and GIS technology. Geocarto International, 8(2), 5-13.
Krishnan, P. (1995). A geographical information system for oil spills sensitivity mapping in the Shetland Islands (United Kingdom). Ocean and Coastal Management, 26(3), 247-255.
Mackay, D. M., & Cherry, J. A. (1989). Ground-Water contamination: pump and treat remediation. Environmental Science and Technology, 23(6), 630-636.
Martins, P. T. A., Riedel, P. S., & Milanelli, J. C. C. (2014). Carta de sensibilidade ambiental ao óleo: origem, evolução e tendências. Ciência e Natura, 35(2), 163-175.
Martins, P. T. A., Riedel, P. S., Milanelli, J. C. C., & Sturaro, J. R. (2014). Carta de sensibilidade ambiental ao derramamento de óleo em rodovias: aplicação piloto na estrada dos Tamoios (SP-099), Estado de São Paulo. RBC. Revista Brasileira de Cartografia, 66(1), 59-74.
Michel, J., Hayes, M. O., & Brown, P. J. (1978). Application of an oil spill vulnerability índex to the shoreline of lower Cook Inlet, Alaska. Environment Geology, 2(2), 107-117.
Ministério do Meio Ambiente [MMA]. (2004). Especificações e normas técnicas para a elaboração de cartas de sensibilidade ambiental para derramamentos de óleo. Brasília, DF: MMA.
Ministério do Meio Ambiente [MMA]. (2007). Especificações e normas técnicas para a elaboração de cartas de sensibilidade ambiental para derramamentos de óleo. Brasília, DF: MMA.
Moe, K. A., Skeie, G. M., Brude, O. W., Løvås, S. M., Nedrebø, M., & Weslawski, J. M. (2000). The Svalbart intertidal zonne: a concept for the use of GIS in applied oil sensivity, vulnerability and impact analyses. Spill Science and Technology Bulletin, 6(2), 187-206.
National Oceanic and Atmospheric Administration [NOAA]. (1995). Sensitivity mapping of inland areas: Technical support to the Inland Area Planning Committee Working Group. USEPA Region 5. HAZMAT Report 95-4. Seattle: hazardous materials response and assessment division, national oceanic and atmospheric administration. Retrieved from http://docs.lib.noaa.gov/noaa_documents/NOS/HMRA/HAZMAT_report_95-4.pdf
Newell, C. J., Acree, S. D., Ross, R. R., & Hulling, S. G. (1995). Light nonaqueous phase liquids. Ground water issue. Oklahoma City, OK: EPA.
O’Rourke, D., & Connolly, S. (2003). Just oil? The distribution of environmental and social impacts of oil production and consuption. Annual Review of Environment and Resources, 28, 587-617.
Onwurah, I. N. E., Ogugua, V. N., Onyike, N. B., Ochonogor, A. E., & Otitoju, O. F. (2007). Crude oil spills in the environment, effects and some innovative clean-up biotechnologies. International Journal of Environmental Research, 1(4), 307-320.
Parshall, J. (2010). Presalt propels Brazil into oil’s front ranks. Journal of Petropleum Technology, 62(4), 40-44.
Petersen, J., Michel, J., Zengel, S., White, M., Lord, C., & Plank, C. (2002). Environmental sensitivity index guidelines. National Oceanic and Atmospheric Administration. 3.0 v. Washington, DC: NOAA.
Pioli, A., Haddad, E., Gouveia, J. L. N., & Greif, S. (2007). Relatório de emergências químicas atendidas pela Cetesb em 2006. São Paulo, SP: Cetesb.
Ponçano, W. L., Carneiro, C. D. R., Bistrichi, C. A., Almeida, F. F. M., & Prandini, F. L. (1981). Mapa geomorfológico do Estado de São Paulo. São Paulo, SP: Instituto de Pesquisas Tecnológicas do Estado de São Paulo/IPT.
Programa de Pesquisas em Conservação e Uso Sustentável da Biodiversidade do Estado de São Paulo [Biota-Fapesp]. (2004). Mapa de vegetação remanecente do Estado de São Paulo. Instituto Florestal/SMA, Centro de Referência em Informação Ambiental. Recuperado de http://sinbiota.cria.org.br/info/
Schmelling, S. G., & Ross, R. R. (1989). Contaminant transport in fractured media: models for decision makers. U.S. EPA, EPA/600/SF-88/002, October. Durham, NV: EPA.
Soares, P. C., & Fiori, A. P. (1976). Lógica e sistemática na análise e interpretação de fotografia aéreas em Geologia. Notícia Geomorfológica, 16(32), 71-104.
Sturaro, J. R. (in press). Mapeamento da vulnerabilidade do aquífero Guarani em uma porção central do Estado de São Paulo - Bacia Hidrográfica do rios Jacaré Pepira-Guaçu e Tietê. São Paulo, SP.
United State Department of Agriculture [USDA]. (1993). Design guide for oil spill prevention and control at substations, bulletin 1724E-302. Retrieved fromeved from http://www.rurdev.usda.gov/SupportDocuments/UEP_Bulletin_1724E-302.pdf
Veneziani, P., & Anjos, C. E. (1982). Metodologia de interpretação de dados de sensoriamento remoto e aplicações em geologia. São José dos Campos, SP: Inpe.
Weslawski, J. M., Wiktor, J., Zajaczkowski, M., Futsaeter, G., & Moe, K. A. (1997). Vulnerability assessment of Svalbard intertidal zone for oil spills. Estuarine, Coastal and Shelf Science, 44(1), 33-41.
Wotherspoon, P., Marks, D., Solsberg, L., & West, M. (1997). Guía para el desarrolo de mapas de sensibilidad ambiental para la planificación y respuesta ante derrames de hidrocarburos. Montevideo, UY: Arpel.
Notes
Author notes
patrick.martins@ueg.br