Arquitetura e Urbanismo
Evaluation of CFD simulations with wind tunnel experiments: pressure coefficients at openings in sawtooth building
Avaliação de simulações CFD através de experimentos no túnel de vento: coeficientes de pressão nas aberturas de edifícios com sheds
Evaluation of CFD simulations with wind tunnel experiments: pressure coefficients at openings in sawtooth building
Acta Scientiarum. Technology, vol. 40, 2018
Universidade Estadual de Maringá

This work is licensed under Creative Commons Attribution 4.0 International.
Received: 08 July 2017
Accepted: 25 October 2017
Abstract: Wind tunnel experiments and Computational Fluid Dynamics (CFD) simulations are used to analyze natural ventilation in a sawtooth roof building. A 1:10 scale model is tested in an atmospheric boundary layer wind tunnel. The CFD simulations are performed with Ansys CFX software. The aim of this study is to evaluate the reliability of CFD simulation in predicting pressure data at opening height in a sawtooth roof building with wind tunnel data. The model is evaluated for prevailing wind in five directions: 0 and 45° (air extractor sheds), 90° (neutral situation) and 135 and 180° (air collector sheds). The computational grid resolution shows that the inclusion of prisms and the increase of the grid refinement in the building’s surface cause insignificant differences in Cp (wind pressure coefficient). In general, the error values below 10% indicate a good agreement between CFD simulations and wind tunnel data.
Keywords: natural ventilation, air extractors and collector sheds, experimental tests, computational simulations.
Resumo: Ensaios no túnel de vento e simulações de Dinâmica dos Fluídos Computacional (CFD) são utilizadas para analisar o comportamento da ventilação natural em edifícios com cobertura em sheds. Modelos físicos reduzidos na escala 1:10 foram ensaiados em um túnel de vento de camada limite atmosférica. As simulações CFD foram realizadas com o software Ansys CFX. O objetivo é avaliar a confiabilidade de simulações CFD em edifícios com sheds através de ensaios no túnel de vento. O modelo foi avaliado para cinco direções predominantes dos ventos: 0 e 45° (sheds extratores), 90° (situação neutra) e 135 e 180° (sheds captadores). Os testes de sensibilidade da malha computacional mostraram que a inclusão de prismas e o aumento do refinamento da malha na superfície do edifício não causaram diferenças significativas nos valores de Coeficiente de Pressão. Em geral, as simulações CFD apresentaram boa concordância com os ensaios no túnel de vento, sendo que a diferença registrada entre as duas ferramentas na maioria dos pontos medidos foi menor que 10%.
Palavras-chave: ventilação natural, sheds extratores e captadores de ar, medições experimentais, simulações computacionais.
Introduction
Natural ventilation is one of the most important passive cooling strategies to provide thermal comfort and healthier indoor environment in buildings. It minimizes energy consumption and environmental impacts, since the need for mechanical ventilation and air conditioning systems is reduced. The energy cost of a naturally ventilated building is typically 40% lower than that of an air-conditioned building (Alloca, Chen, & Glicksman, 2003).
In hot humid climates, as in most of Brazilian territory, the use of natural ventilation can be an efficient strategy for the thermal comfort without the use of mechanical cooling (Cândido, De Dear, Lamberts, & Bittencourt, 2010). This strategy is less efficient in areas with infrequent and weak winds, or inadequate spaces for air circulation within the urban network. In rooftop buildings, natural ventilation strategies can be explored in two ways, in order to minimize this problem: 1) through the stack effect, only dependent on indoor-outdoor temperature difference and an effective height difference between inlet and outlet openings, and 2) through the use of wind captors with openings above rooftops such as solar chimneys (Chen et al., 2003; Maerefat & Haghighi, 2010; Shi et al., 2016), wind towers (Lôbo & Bittencourt, 2003; Bahadori, Mazidi, & Dehghani, 2008; Montazeri & Azizian, 2008) and shed roofs.
Shed roofs can work for both air collection (wind catcher) and extraction (leeward sawtooth roof), depending on the orientation of the openings to prevailing wind directions. The most common example of a shed roof is the well-known ‘sawtooth’, a series of pitched roofs with a triangular cross section showing a profile similar to the serrated edge of a saw blade. The vertical wall of each ‘tooth’ provides locations for openings enabling natural daylight and also ventilation. This roof type can be used in different buildings such as schools, industries, hospitals, among others (Lukiantchuki, Caram, Matsumoto, & Labaki, 2014; Lukiantchuki, 2015; Perén, Van Hooff, Leite, & Blocken, 2015).
Despite their great potential to increase natural ventilation, especially in hot climates such as Brazil, shed roofs have not been extensively studied concerning this aspect, providing poor scientific and technical data (Cândido & Bittencourt, 2006). For this reason, this strategy has a scarce use in Brazilian architecture. Most natural ventilation studies are focused on flat roof geometries. However, despite international researches on shed roofs since 1980 - mono-sloped roofs (Gandemer, Barnaud, Millet, & Sacre, 1992; Perén et al., 2015), multi-span roofs such as sawtooth roofs (Blackmore, 1986; Standard Australia, 1989; Stathopoulos & Saathoff, 1992; EN 1991-1-4, 2010; Heras, Jiménez, San Isidro, Zarzalejo, & Pérez, 2005) and aerodynamic sheds (Lukiantchuki, 2015; Lukiantchuki et al., 2016), there is still a lack of research analyzing the impact of sawtooth roof design on natural ventilation potential.
The literature review indicates an information gap. There have been few national and international studies on the performance of shed roofs. Most publications involving wind assessment and the measurement of Cp are related to the structural analysis of wind loads and not to the potential for natural ventilation. The Cp values available in the literature are in general for simple shapes (Cóstola & Alucci, 2007) and complex geometry buildings are not considered. This reinforces the need for measurements of this parameter in different building geometries and the demand for research on air extractor and collector shed roofs in hot, humid climates, such as in most of Brazil. This paper presents CFD simulations for an isolated building. The simulations are compared and validated against detailed data from wind tunnel experiments, based on Cp measurements in the buildings openings.
Wind tunnel measurements
Description of the building evaluated and the construction of the reduced physical models
The dimensions of the tested building model are 7×5×5 m (L× W× H). This rectangular structure has a sawtooth roof composed of three orthogonal shaped sheds (14° slope) spaced 2.5 m apart. There is a ventilation opening on one of the facades (0.625 m in height) and openings in the sheds (4.375 m in height). All openings have the same dimensions W × H = 5×0.625 m and the vertical distance between the openings is 3.75 m (Figure 1).
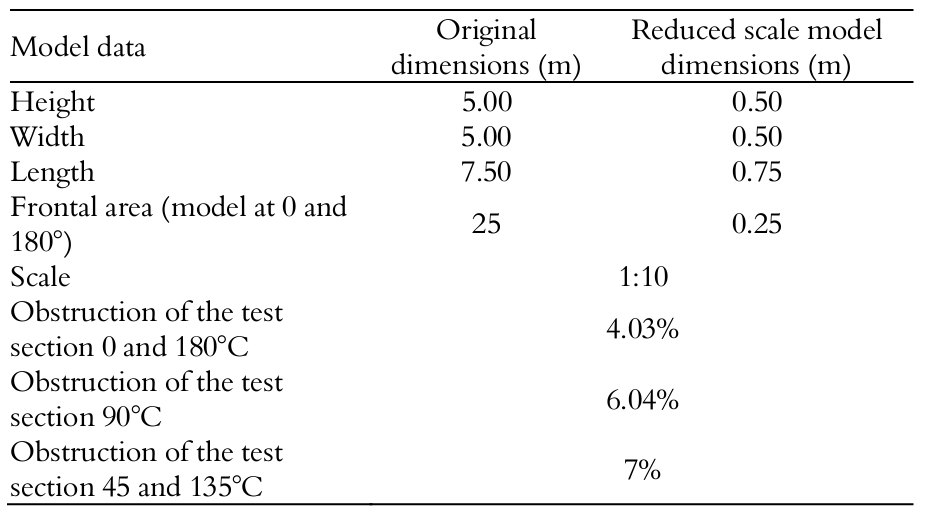
A scaled-down model of the building was tested in an open circuit wind tunnel at the Structures Department in the National Laboratory of Civil Engineering (LNEC) in Lisbon, Portugal. The dimensions of the test section of the wind tunnel are: length = 9.0, width = 3.1, and height = 2.0 m (cross-section area = 6.2 m2). The tunnel contains six fans, each one producing a wind velocity of approximately 3.5 m s-1. In order to avoid blockage, the model could not obstruct more than 7% of the cross-sectional area, and the optimal value is closer to 5% (Jewel, William, Era, & Alan, 1999; Matsumoto & Labaki, 2011). As a result a, 1:10 scale models was built, as shown in Table 1. The physical scaled-down models were built from 6 mm transparent acrylic material to facilitate flow visualization testing as well as to be able to clearly see the measurement points markers. The models were reinforced with aluminum corners on the sides for resilience during testing (Figure 2).
Boundary layer simulation
Wind data at the level of the building must be correct and an atmospheric boundary layer must be generated. The simulated atmospheric boundary layer in the wind tunnel was developed by Castanho (2012), using the Irwin method (Irwin, 1981). Three triangular elements were placed in the upstream position of the tunnel and 0.1m cubes were disposed on the floor of the tunnel to provide roughness to the flow and vortices similar to the real environment.
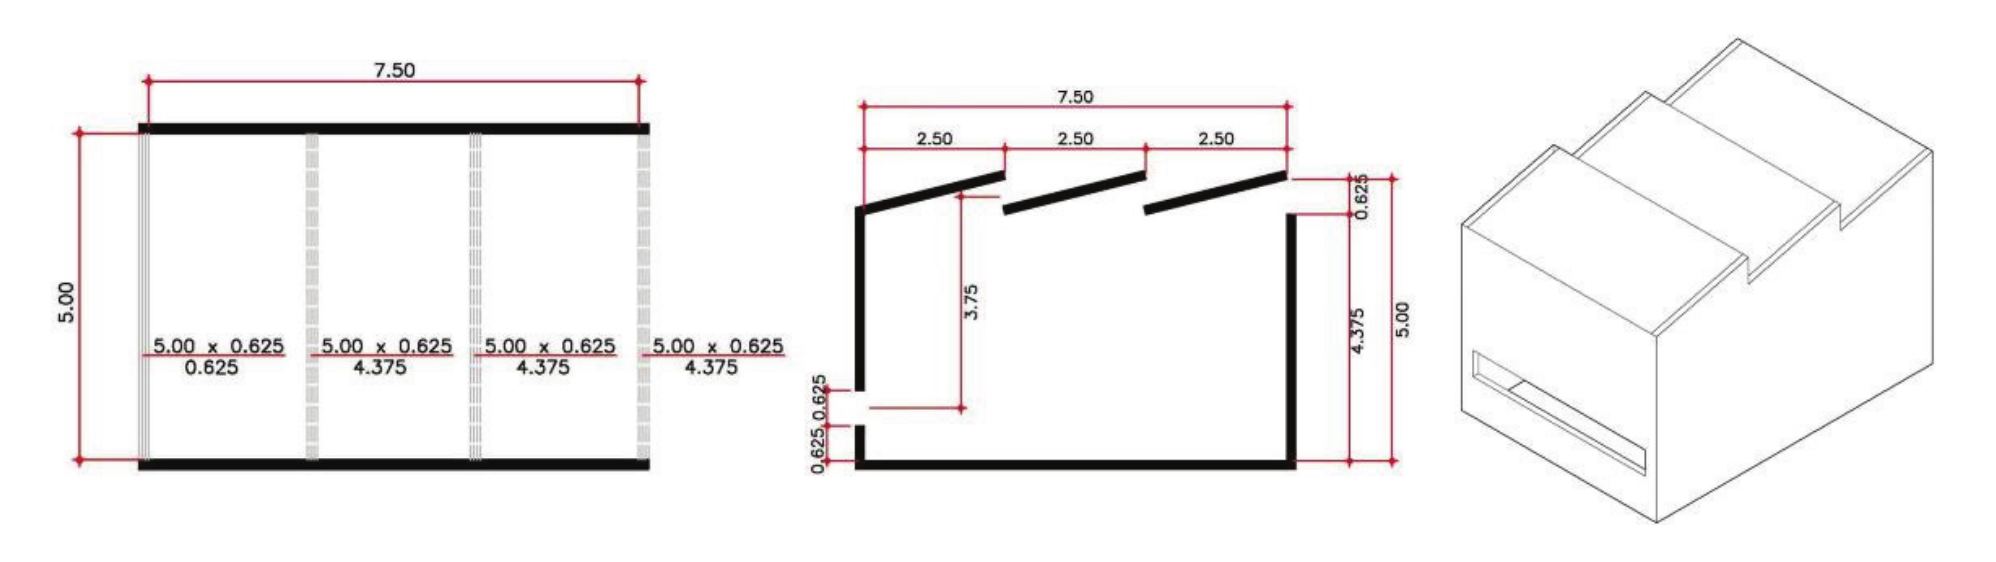
Figure 1.
(a) Horizontal and vertical cross-section and perspective of the building model.
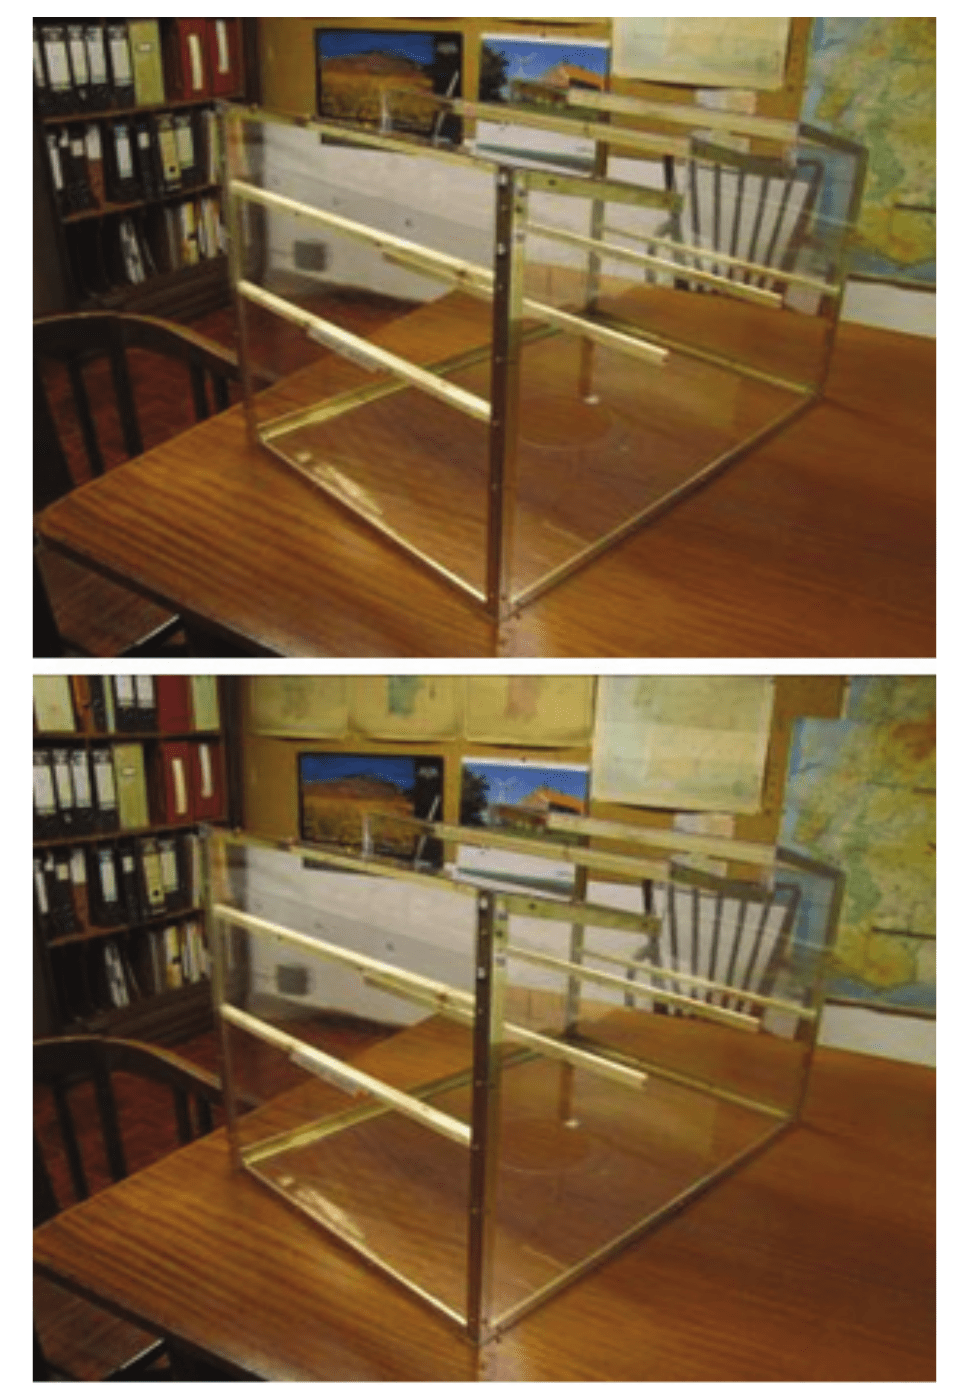
Figure 2.
The reduced-scale model tested in wind tunnel.
These cubic elements were arranged in an uneven manner located at a distance of 40 cm between axes. A 2 m space was reserved for the test area to minimize the local effects of the cubes. This configuration resulted in a total of 98 cubic elements (Figure 3).
The characteristics of the profile of the simulated atmospheric boundary layer were evaluated using a Pitot-Prandlt tube located in the central position of the wind tunnel and 0.50 m upwind of the test area. The procedure used to record the characteristics of the simulated atmospheric boundary layer was based on measurements of the dynamic pressure, from 1.5 cm to a height of 90 cm. The flow dynamic pressure was measured with a Betz type 2500 micromanometer Acin, Van-Essen, associated with Pitot-Prandtl, with a resolution of 0.1 Pa and accuracy of the read-out of +/- 0.04%.The calibration temperature is 20°C.
Figure 4 shows the vertical profiles of the mean wind velocity of the atmospheric boundary layer tested in the wind tunnel. A building reference height (href ) of 50 cm was adopted and the reference mean wind velocity (Uref ) was 7 m s-1. According to the experiments conducted in the wind tunnel, the value of the power law exponent (α) was 0.21. Comparing the curve of the atmospheric boundary layer, obtained experimentally in this research, with the curve obtained by Castanho (2012) (α = 0.22) and with the theoretical value for a suburban environment (α = 0.23), a good agreement was observed. The difference between our experiments and the value suggested in the literature was only 8%. The same wind profile was generated in the CFD simulation.
Pressure coefficient measurements
The measurement positions in the building openings are indicated in Figure 5. Total pressure is measured at three points in each inlet and outlet opening (A1, S1, S2 and S3), totaling 12 points (P1, P2, P3… P12) (Figure 5). The pressure in the openings was measured by sensors that recorded the total pressure (Pt), at the average height of the openings. The sensors were located perpendicular to the openings for all wind incidence angles. A Pitot-Prandtl tube at building rooftop height was connected to the micromanometer inside the wind tunnel, located upwind of the model to measure the local velocity. This value was a reference for calculating the dynamic pressure of the flow. The resulting value was used as a reference for the calculation of Cp at the openings. The model was equipped with 1mm pressure taps connected to two PSI electronic pressure scanners 16 TC/DTC, with 32 and 64 channels, for the simultaneous measurement of pressure at all points. The pressure scanners were connected to a data acquisition system (DTC Initium) with a 2 Hz data sampling rate (Figure 6). Average pressure values were measured during a two minute acquisition period.
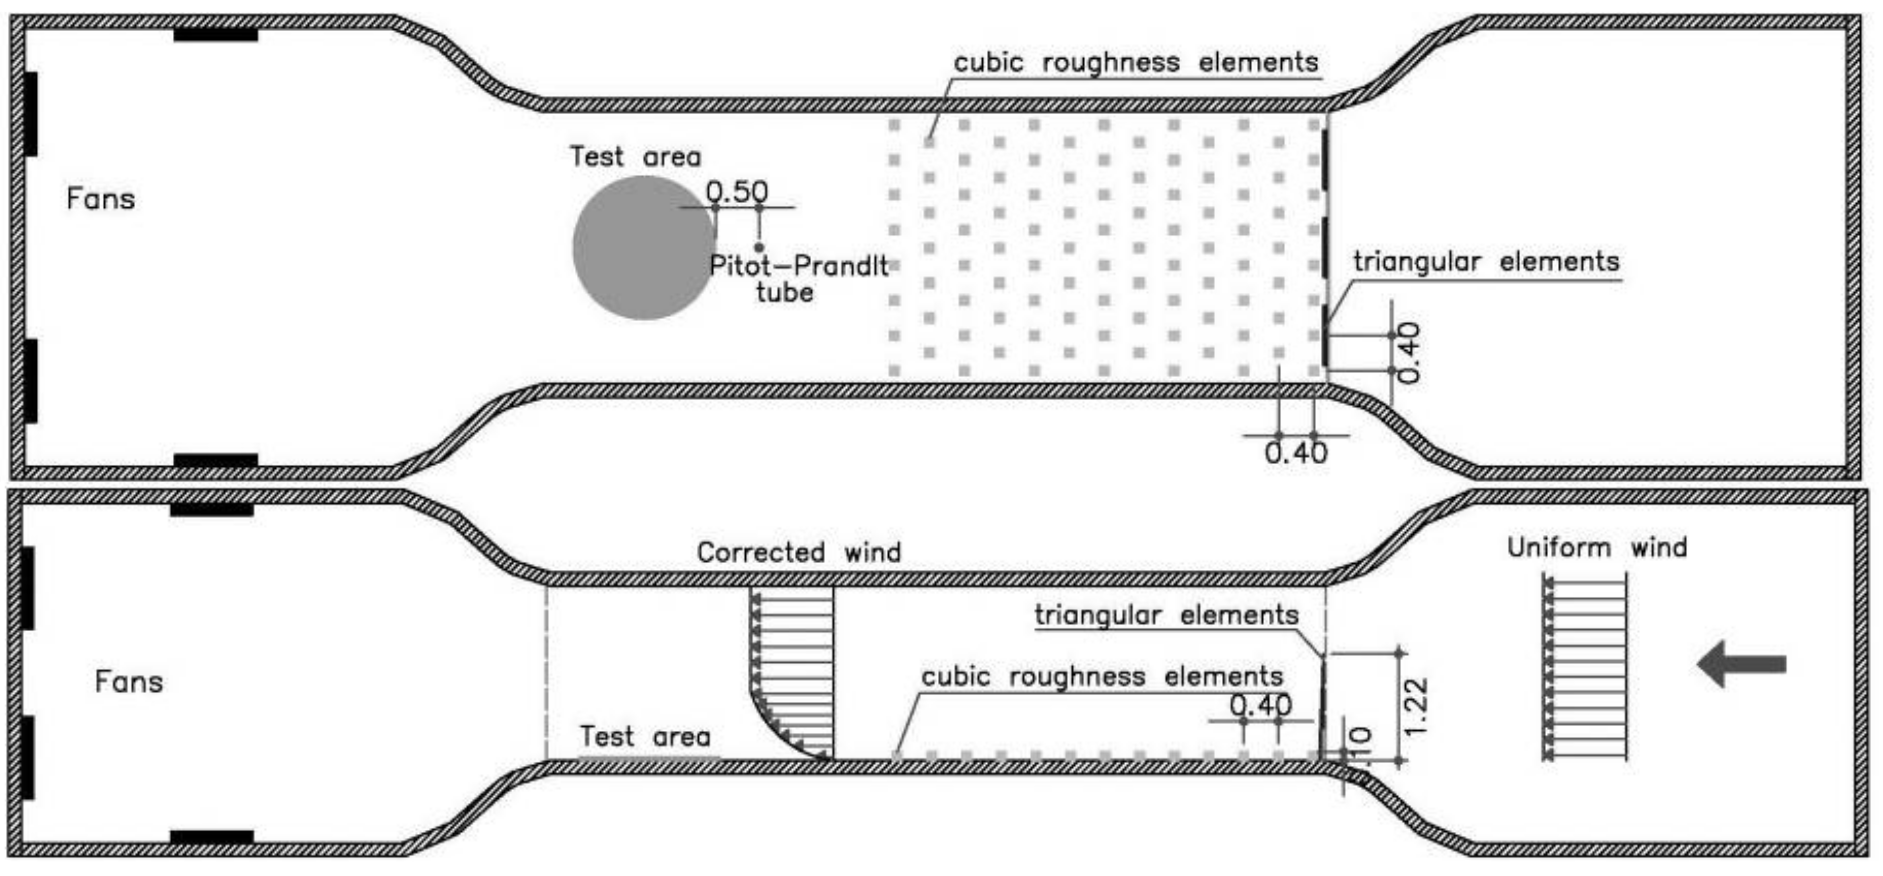
Figure 3.
Wind tunnel with roughness elements to generated the atmospheric boundary layer.
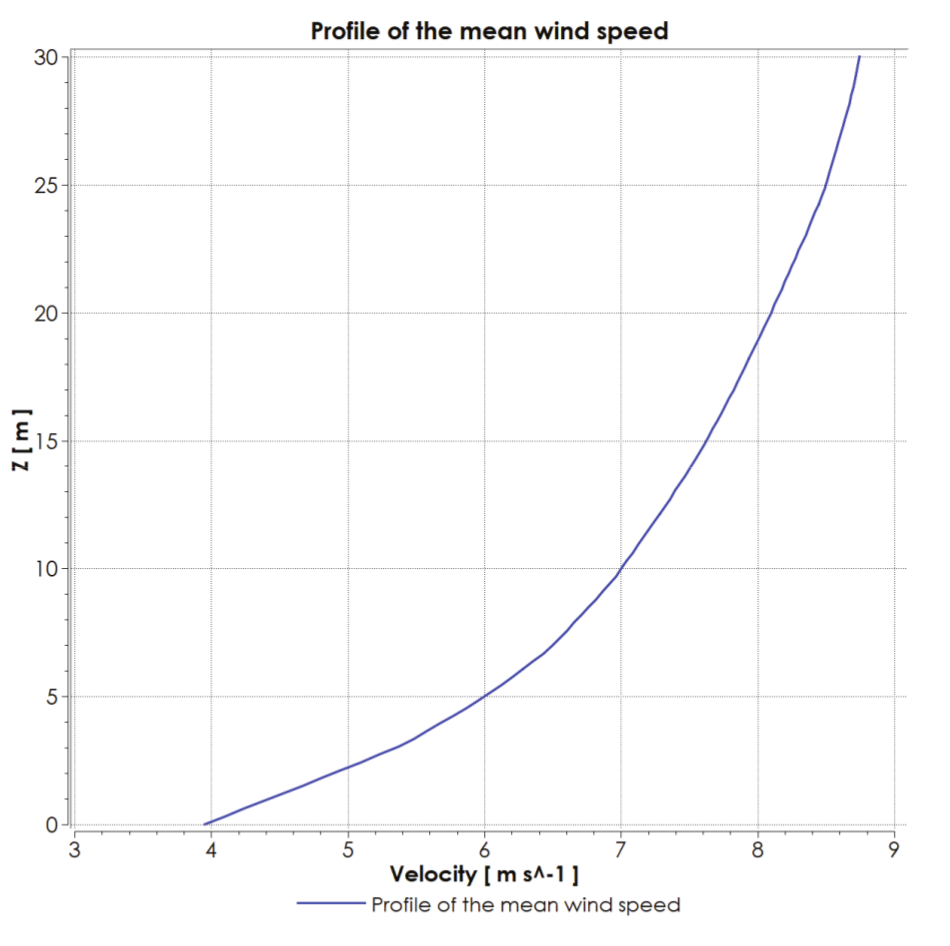
Figure 4.
Profile of the mean wind speed in wind tunnel experiment and CFD simulation.
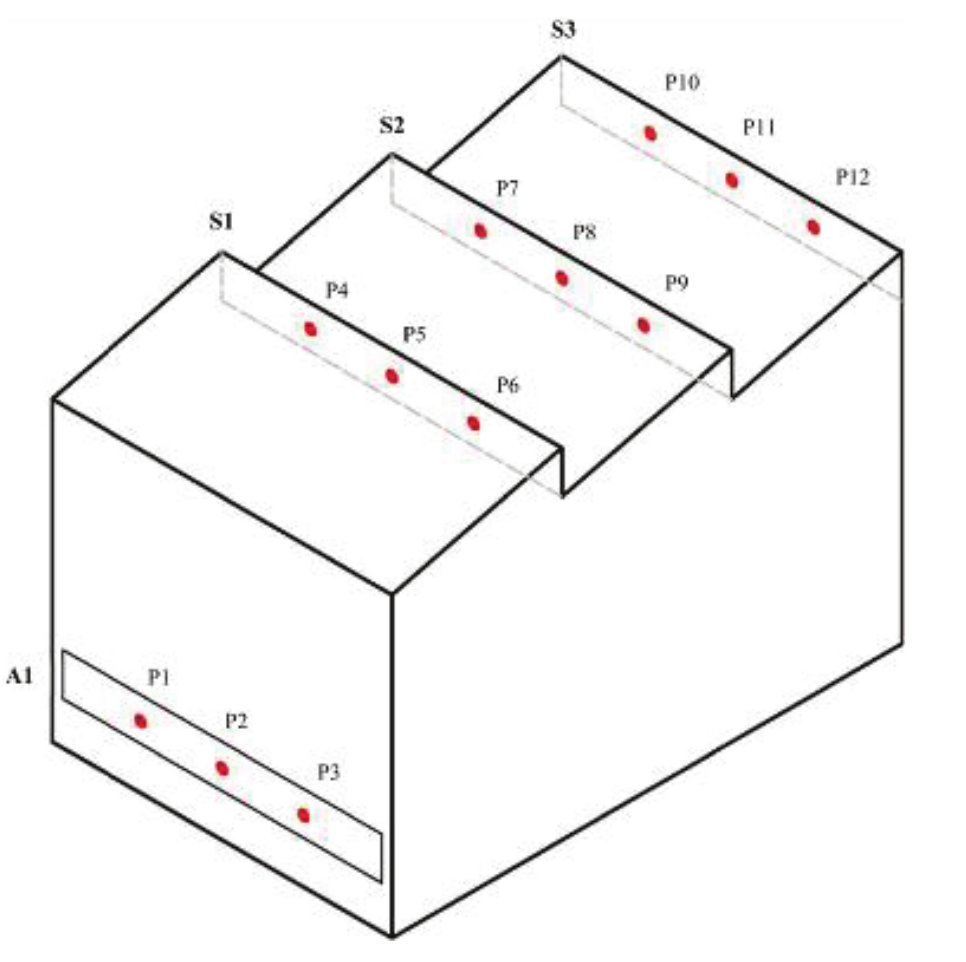
Figure 5.
Measurement points in openings.
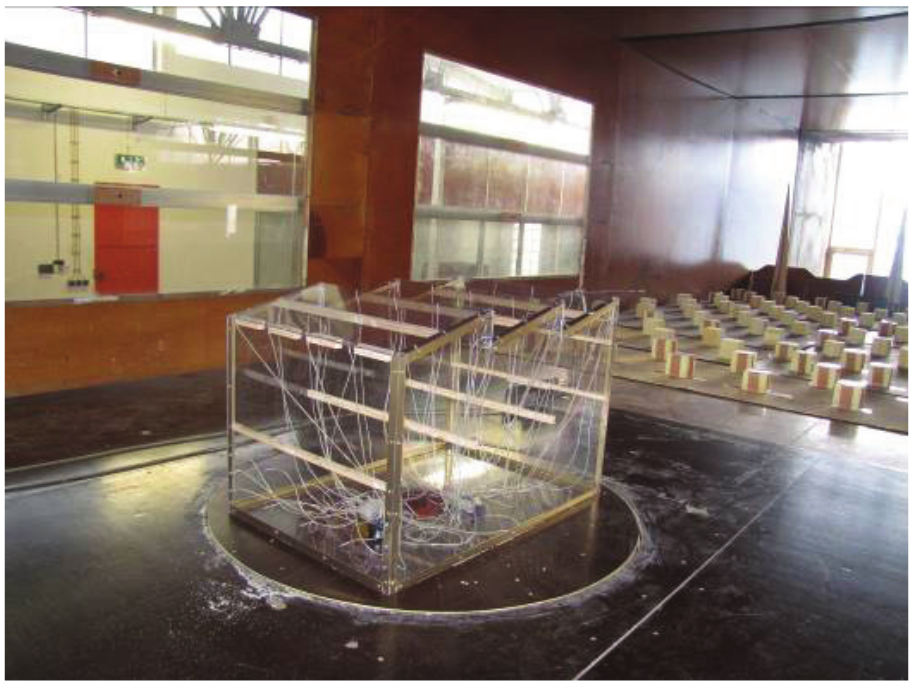
Figure 6.
Instrumented reduced-scale model.
The model was evaluated for five prevailing wind directions: 0 and 45° (air extractor), 90° (neutral situation) and 135 and 180° (air collector). The analysis of difference between the internal and external air (stack effect) is also of great importance in studies of air movement and should be analyzed. However, this was not the focus of this article and will be posteriorly.
Computational fluid dynamic simulations
Computational domain and grid
A 3D computational model and the volume outside of the building, that represent the flow domain, were prepared in AutoCAD software. The computational domain is rectangular and the dimensions followed the recommendations of Harries (2005): windward = 5 H (25 m); leeward = 15 H (75 m); height = 6 H (30 m) and lateral sides = 5 H (25 m), where H = 5 m, which corresponds to the height of the building. The maximum blockage ratio at the cross section is 1.5%, which, according to Cost (2004), should not exceed 3% (Figure 7).
The accuracy of the results obtained from CFD modeling is highly dependent on the quality of the mesh. The computational simulations used an unstructured tetrahedral mesh, with the following global grid parameters: maximum element size of 16; 4 for natural size and; 8 for gap cells. The grid was refined on the building surface in 0.20 m to ensure that the flow field was accurately captured in the simulations (Franke, Hellsten, Schlünzen, & CarissimLo, 2007; Tominaga et al., 2008; Hughes, Chaudhry, & Calautit, 2013; Calautit, Hughes, Chaudhry, & Ghani, 2013; Calautit & Hughes, 2014). The combination of these parameters determines a number of mesh elements of approximately 30 million (Figure 8).
Boundary conditions
Boundary conditions for the numerical modeling of the flow were the same as the conditions in the wind tunnel during the experiment. The accuracy of CFD simulation is affected by several factors, including the turbulence model, the initial conditions and the boundary conditions. In this research, these factors were based on Cóstola and Alucci (2007). The computational domain layout was similar to those of a wind tunnel: lateral faces, floor and ceiling as walls, not allowing the passage of the air flow. Inlet and outlet were set as flow admittance and exhaust respectively. The lateral faces and the ceiling were defined as slip -free walls (without friction) in order not to impose resistance on the domain elements far from analyzed areas. The floor and the surfaces of the building were defined as friction slip walls (Figure 7). Zero static pressure is applied at the outlet plane and symmetry conditions: zero normal velocity and zero normal gradients of all variables, at the top and lateral sides of the domain. All points of Cp measurement in CFD have the same location in the wind tunnel measurements (Figure 5). The same boundary layer obtained experimentally was applied as inlet boundary conditions in the CFD simulations (Figure 4). Medium turbulence intensity (5%) was adopted, together with a high resolution advection scheme and conservative auto time scale.
Solver settings
The simulations were performed in a stationary regime with an isothermal condition (25°C) and adopted the standard k-ε turbulence model. Convergence was obtained when all the scaled residuals levelled off and reached a maximum of 10-4 for x, y and z momentum. The adopted number of interactions varied from a minimum of 600 to a maximum of 6.000.
Results and discussions
CFD simulations: sensitivity analysis for computational grid resolution
The definition of the computational grid parameters is one of the most important stages of a CFD simulation. A sensitivity analysis was conducted for the evaluated building by varying a single parameter and evaluating the impact of this change on the simulation results. Sensitivity tests for the resolution of the computational grid were conducted by modifying the parameters: 1) types of grid elements (tetrahedral [grid TP] and tetrahedral with prisms [grid TPA] on the surface of the building); 2) the size of the global parameter natural size (coarse grid A: 4; middle grid B: 2 and fine grid C: 0.5); and 3) the size of the grid refining elements of the building’s surface (0.30 m; 0.20 and 0.10 m) for each mesh analyzed (A, B and C).
These parameters were modified separately to evaluate the influence of each one on the numerical results. These results were compared to the criteria: 1) MAX level of convergence 10-4, and 2) y+ values for the standard k-ε turbulence model minimum of 30 as per Cost (2004), y+ values between 20 and 100 as per software manual CFX and and between 30 and 300 according to Leite (2015).
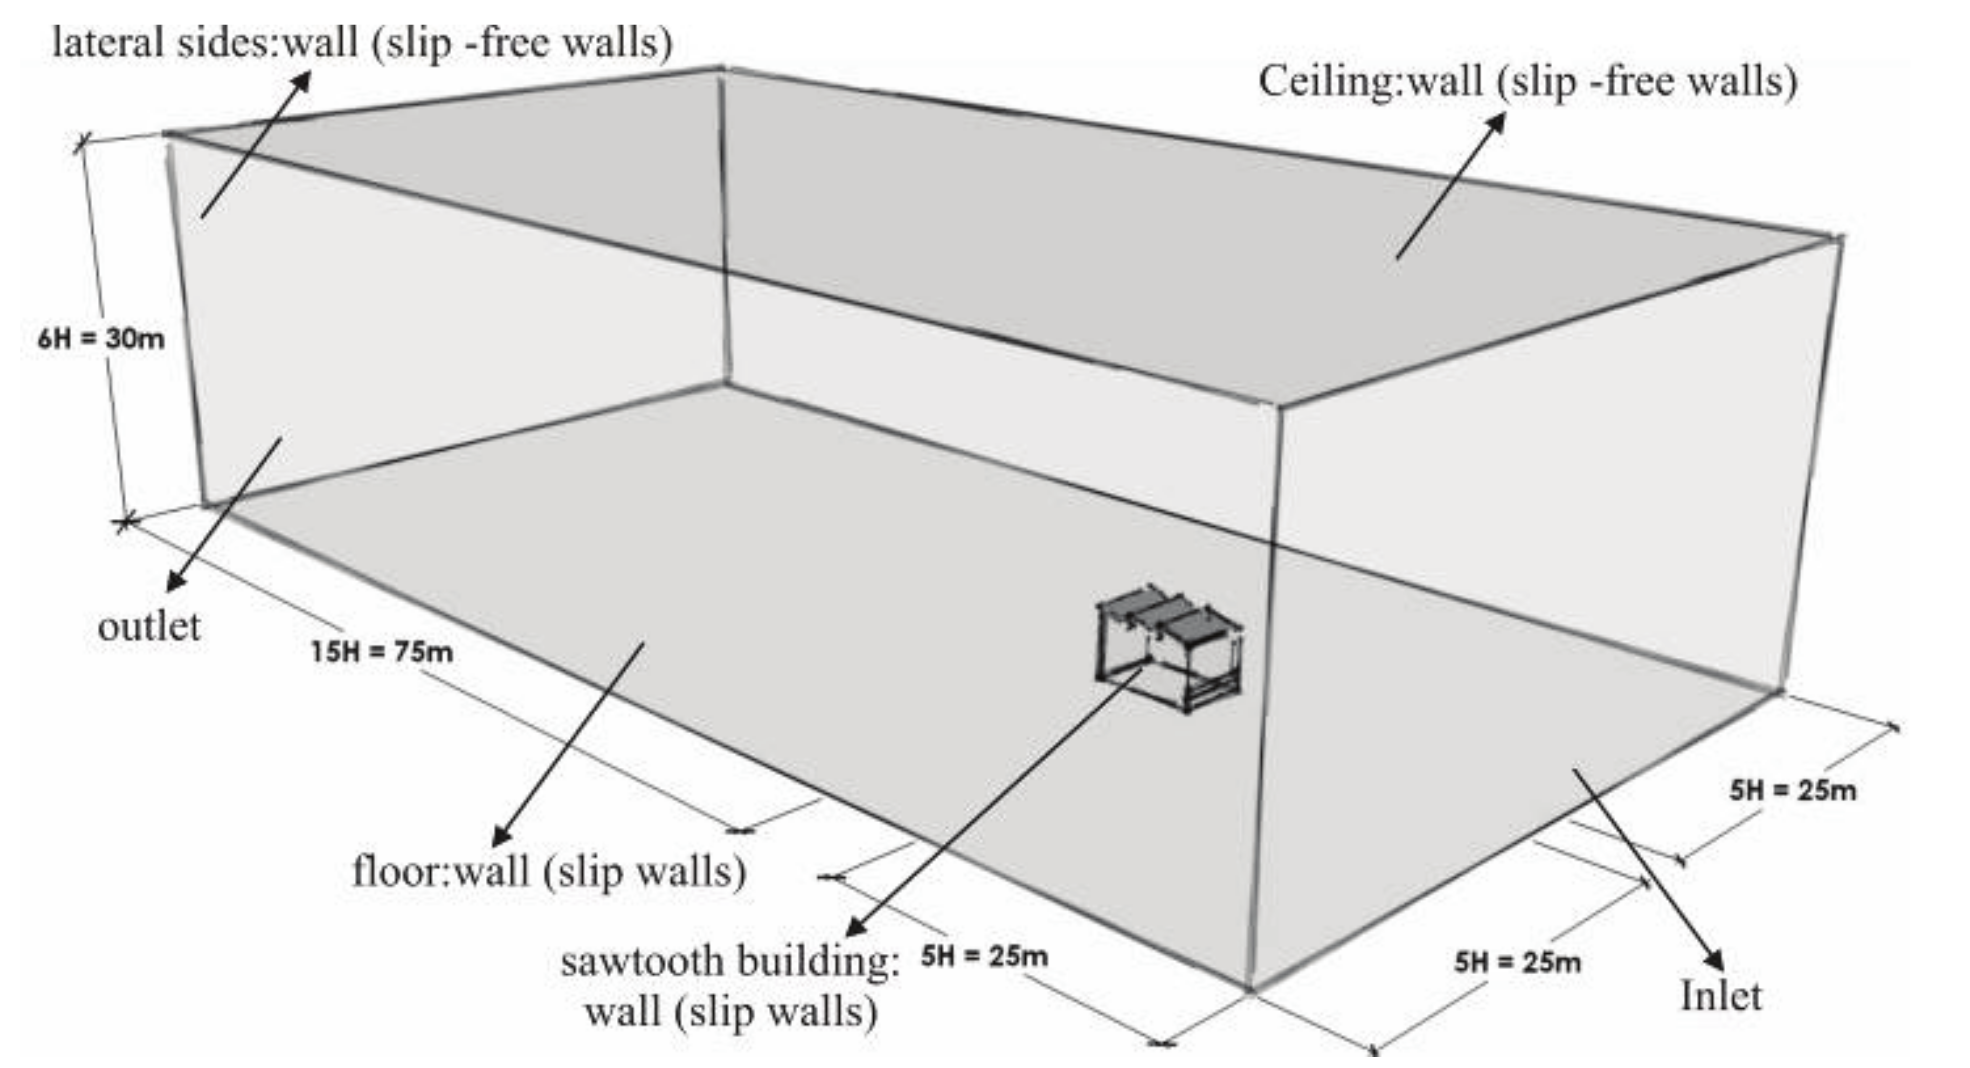
Figure 7.
3D model and a volume outside the building.
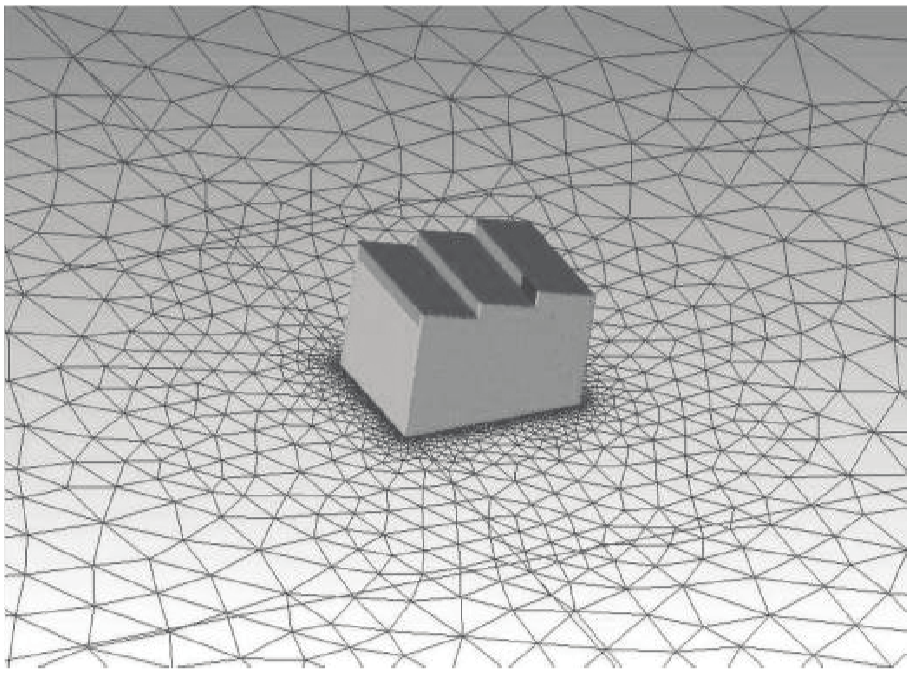
Figure 8.
The unstructured tetrahedral grid.
The y+ value describes the relation among the distance of the first grid point to the solid border, the tension caused by the flow on this border, the specific mass and the viscosity of the fluid. The evaluation of this parameter permits a correct understanding of the boundary layer detachment effect. Y+ can be defined by the Equation 1:
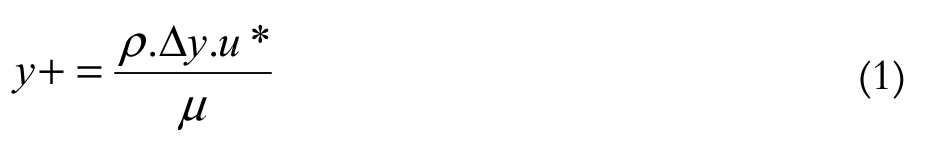 (1)
(1)where:
ρ = especific mass (kg m-1);
∆y = distance from the first point of the mesh to the wall (m);
u* = friction velocity (m s-1);
μ = dynamic viscosity (N s-1 m-2).
Figure 9 shows the average value of y+ relative to the change in element types and the size of the computational grid parameters. Figure 10 shows the level of convergence achieved for each tested grid. For all analyzed grids, whenever the value of the minimum element and the size of the elements of the building’s surface have been reduced, y+ values were lower, reaching values nearest to those recommended (Cost, 2004; Leite, 2015). However, meshes TB and TC did not reach MAX 10-4 convergence level, and remained in a stationary state after 300 iterations. For mesh TA, the convergence level was reached for elements on the building’s surface of 0.30 and 0.20 m. However, the inclusion of prisms in the mesh (TPA, TPB and TPC) and the increase of the mesh refinement in the building’s surface resulted in the impoverishment of the mesh, reaching higher y+ values, and in the non-convergence of the simulations (Figure 9).
Finally, the influence of the y+ values on Cp at the openings of the building was evaluated for grids that had reached MAX 10-4 convergence levels. Figure 11 shows variation of Cp at inlet and outlet openings relative to the grid elements and a variation in y+ value. Although y+ was reduced with the refinement of the building elements and the use of only tetrahedral elements, insignificant differences were observed in the Cp values. The maximum variation in the absolute values of Cp was, at most, 0.1, registering very similar values at several measured points. This variation caused no significant changes in the internal airflow. Leite (2015) found the same trend. The reduction of the height of the prismatic elements caused no significant differences in Cp. The differences found by Leite (2015) were approximately 3 and 6%. From these results, grid TA was used for validation in wind tunnel tests: tetrahedral elements, natural element of 4 and the size of the elements on the building's surface of 0.20 m ( + lower and convergence level 10-4)
Quantitative validation: pressure coefficients at inlet and outlet openings
Figure 12 shows both computational and experimental results for the mean pressure coefficients at the inlet and outlet openings concerning different wind attack angles. Figure 13 shows the Cp values measured numerically and experimentally, adopting an error limit of 10% between the two tools. In general, most of the results showed consistent agreement and the differences were below 10% for most monitored points. Discrepancies were observed, especially in S1 (39%), where the CFD overestimated Cp values. The largest difference between the computational and experimental results was recorded for S1 sheds as air captors (180°C). The exact reasons for this difference were not clear, however, the highly disturbed flow reaching S1 may have led to errors in the measurements and, consequently, averaging numerical misinterpretation. Variations in wind velocities and directions in the shed roof regions constantly change the behavior of the airflow at the openings. The extractor shed roofs (0°C) showed the highest similarity between all measured points,
with very close numerical and experimental values. Moreover, Cp in S2 openings for 45 and 180°C incidences were exactly the same, recording an average error of 0%, and S3 (180°C) showed a mean error of only 1%.
The magnitude of the differences observed between the experimental and CFD results is similar to the values referenced in the literature. Calautit et al. (2013) obtained results of Cp on the surface of a wind tower with a good agreement (error less than 10%), except for some points at the top and on the back of the building. The measurements on the front surface showed high accuracy, with an average error of 5%. Balbastro and Sonzogni (2012) found differences in Cp measurements lower than 10%, showing a good agreement between the numerical and experimental results. Jiang, Alexander, Jenkins, Arthur, and Chen (2003) observed similar Cp values through wind tunnel tests and CFD simulations.
In general, the performance of the internal airflow is strongly influenced by the orientation of the openings to the prevailing winds. The way that the wind attacks the building modifies the pressure fields around the windows and, consequently, the Cps in the openings. For air extractors and collectors sheds, the largest differences between the Cps in the openings occur when the winds attacks obliquely in the building. The air extractor sheds presented a greater ∆Cp between the air inlet and outlet openings, so, for this situation the performance is better than that of air collector sheds.
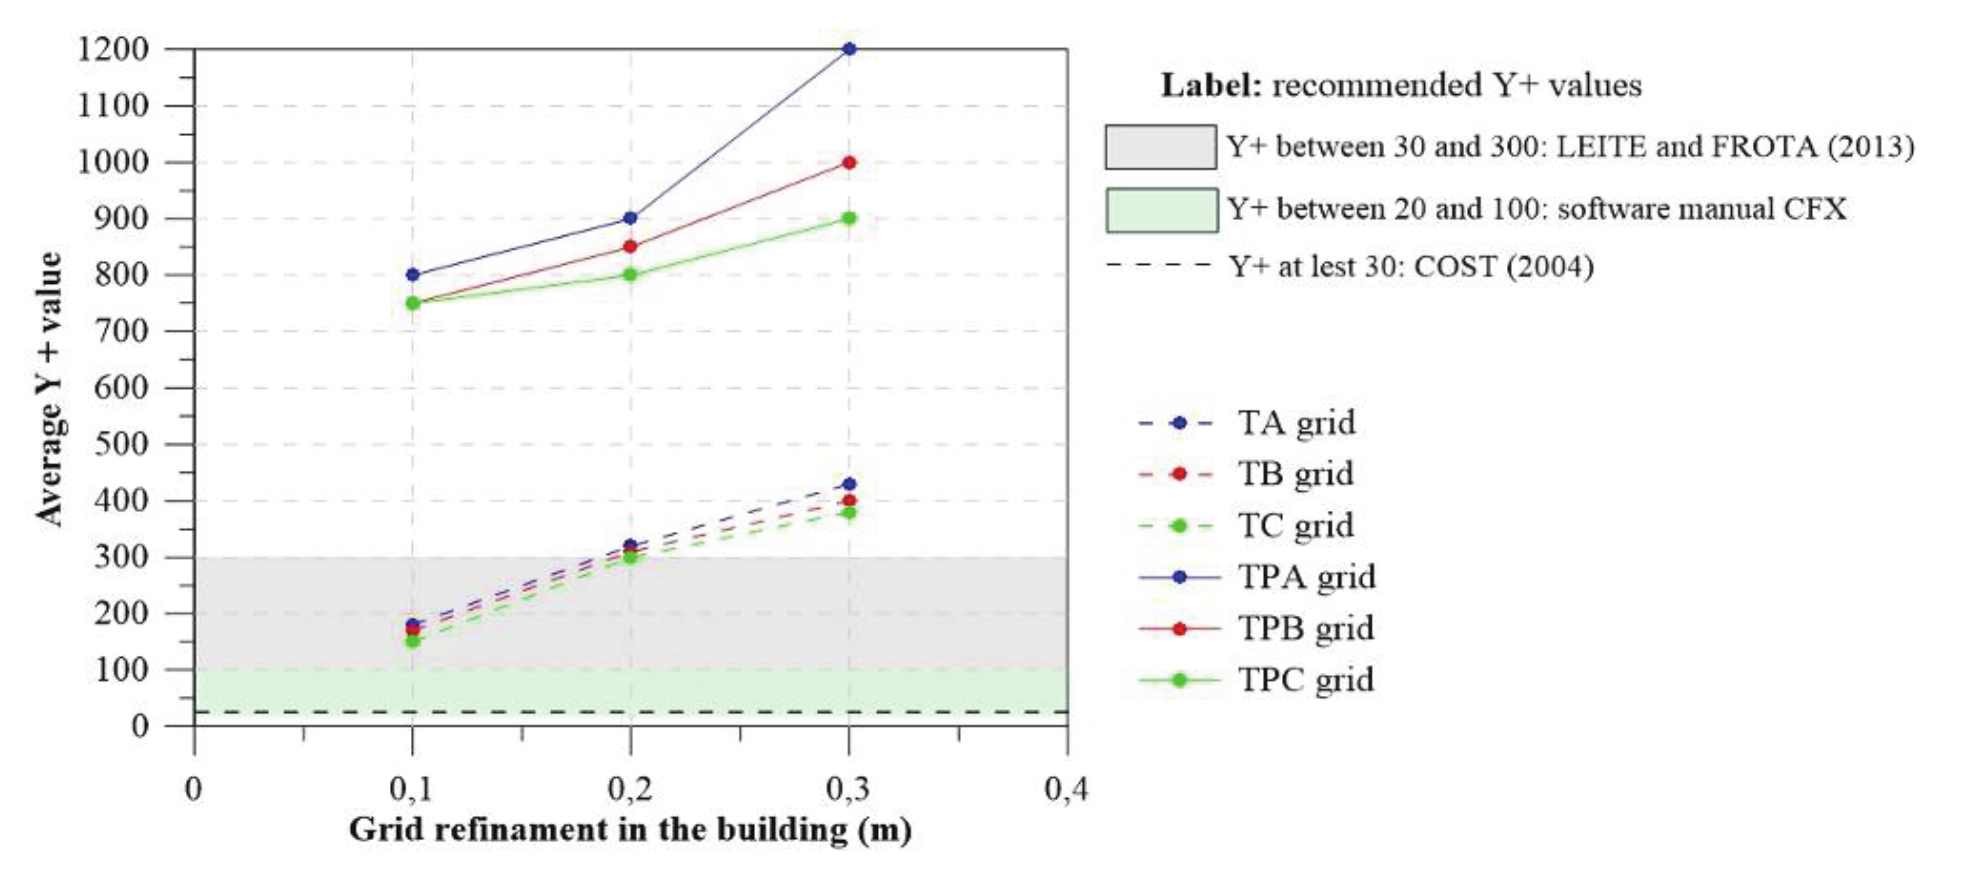
Figure 9.
Average value of y+ in relation to the change of parameters analyzed.
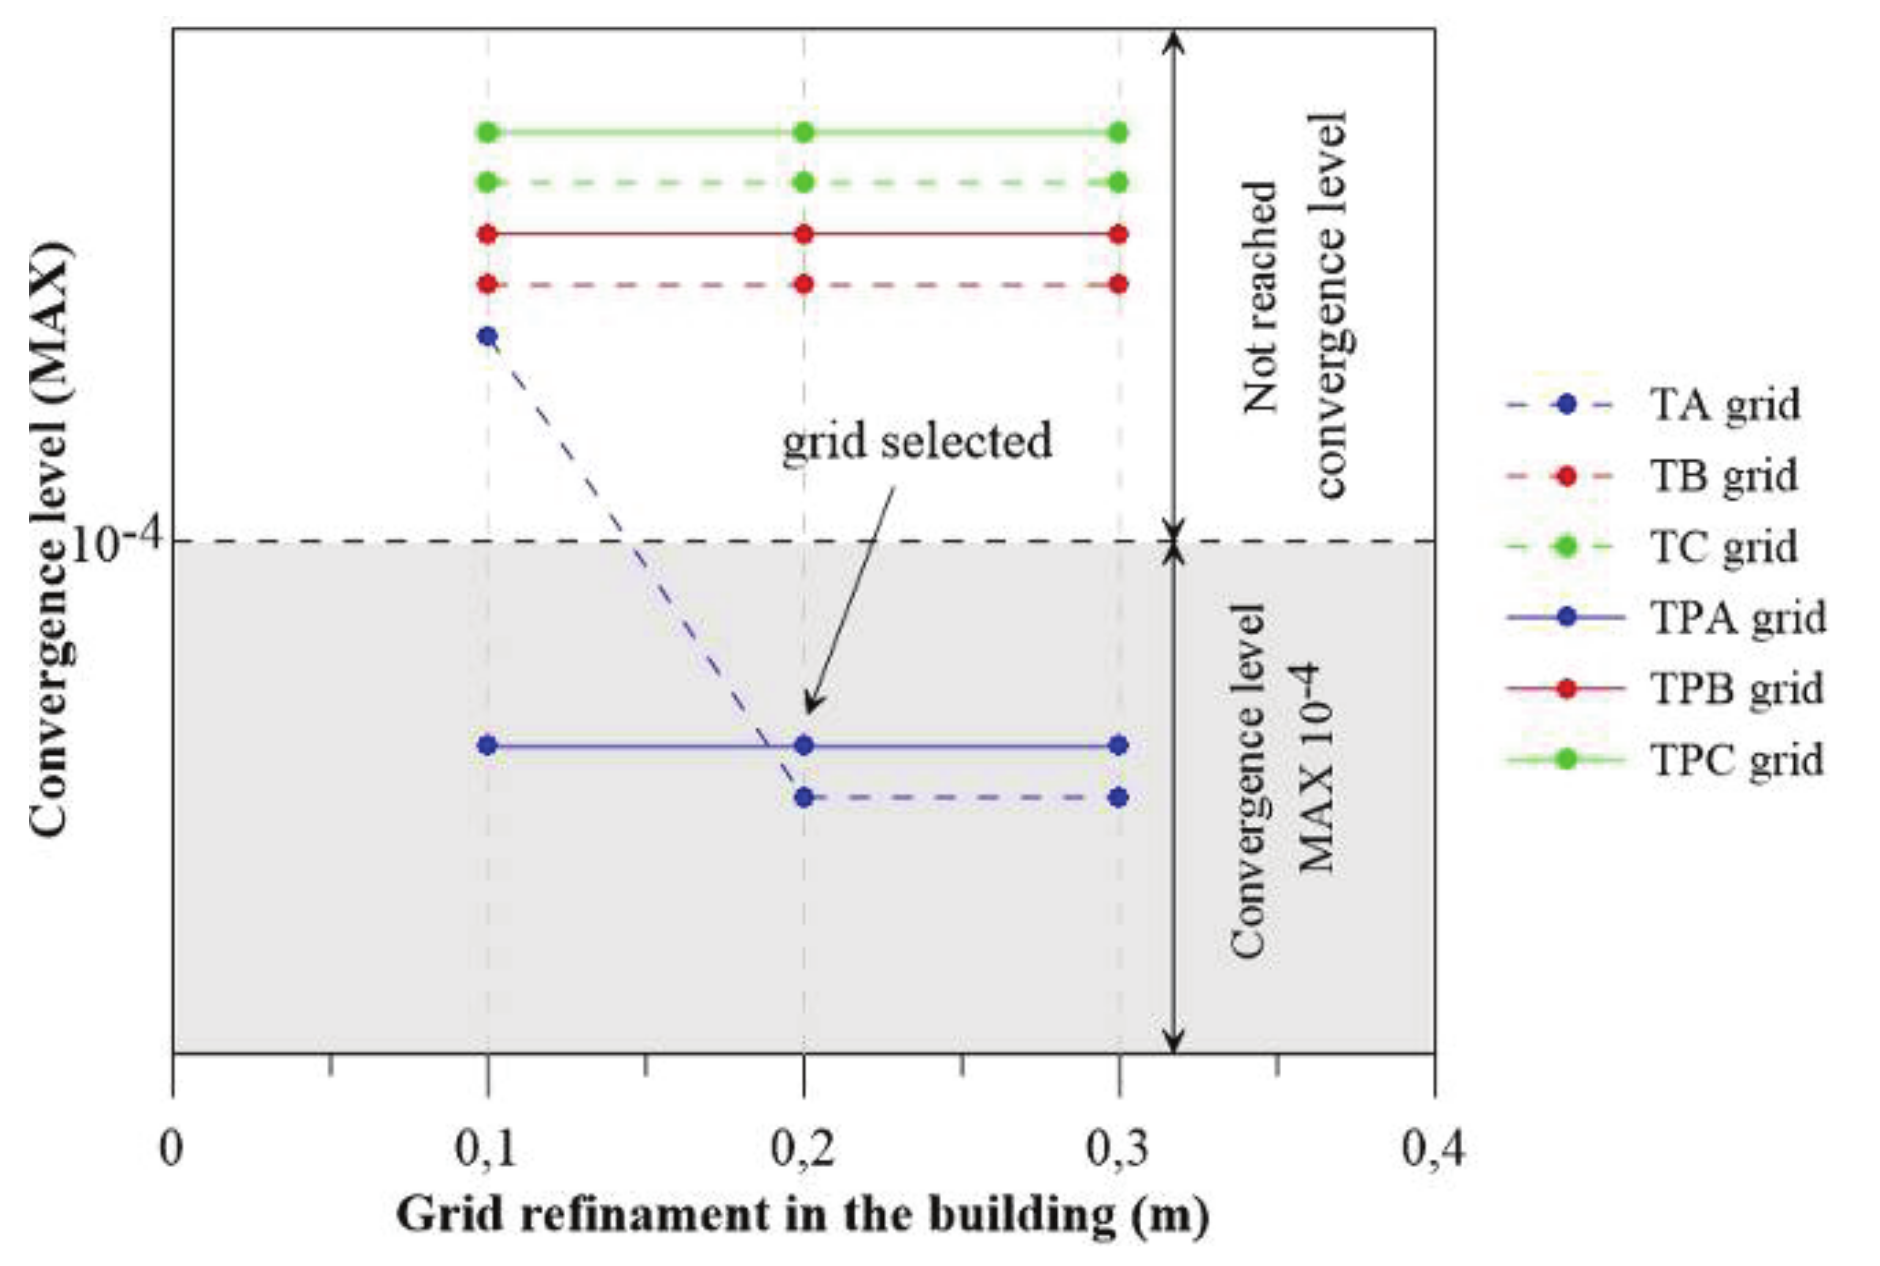
Figure 10.
The level of convergence achieved in each mesh tested.
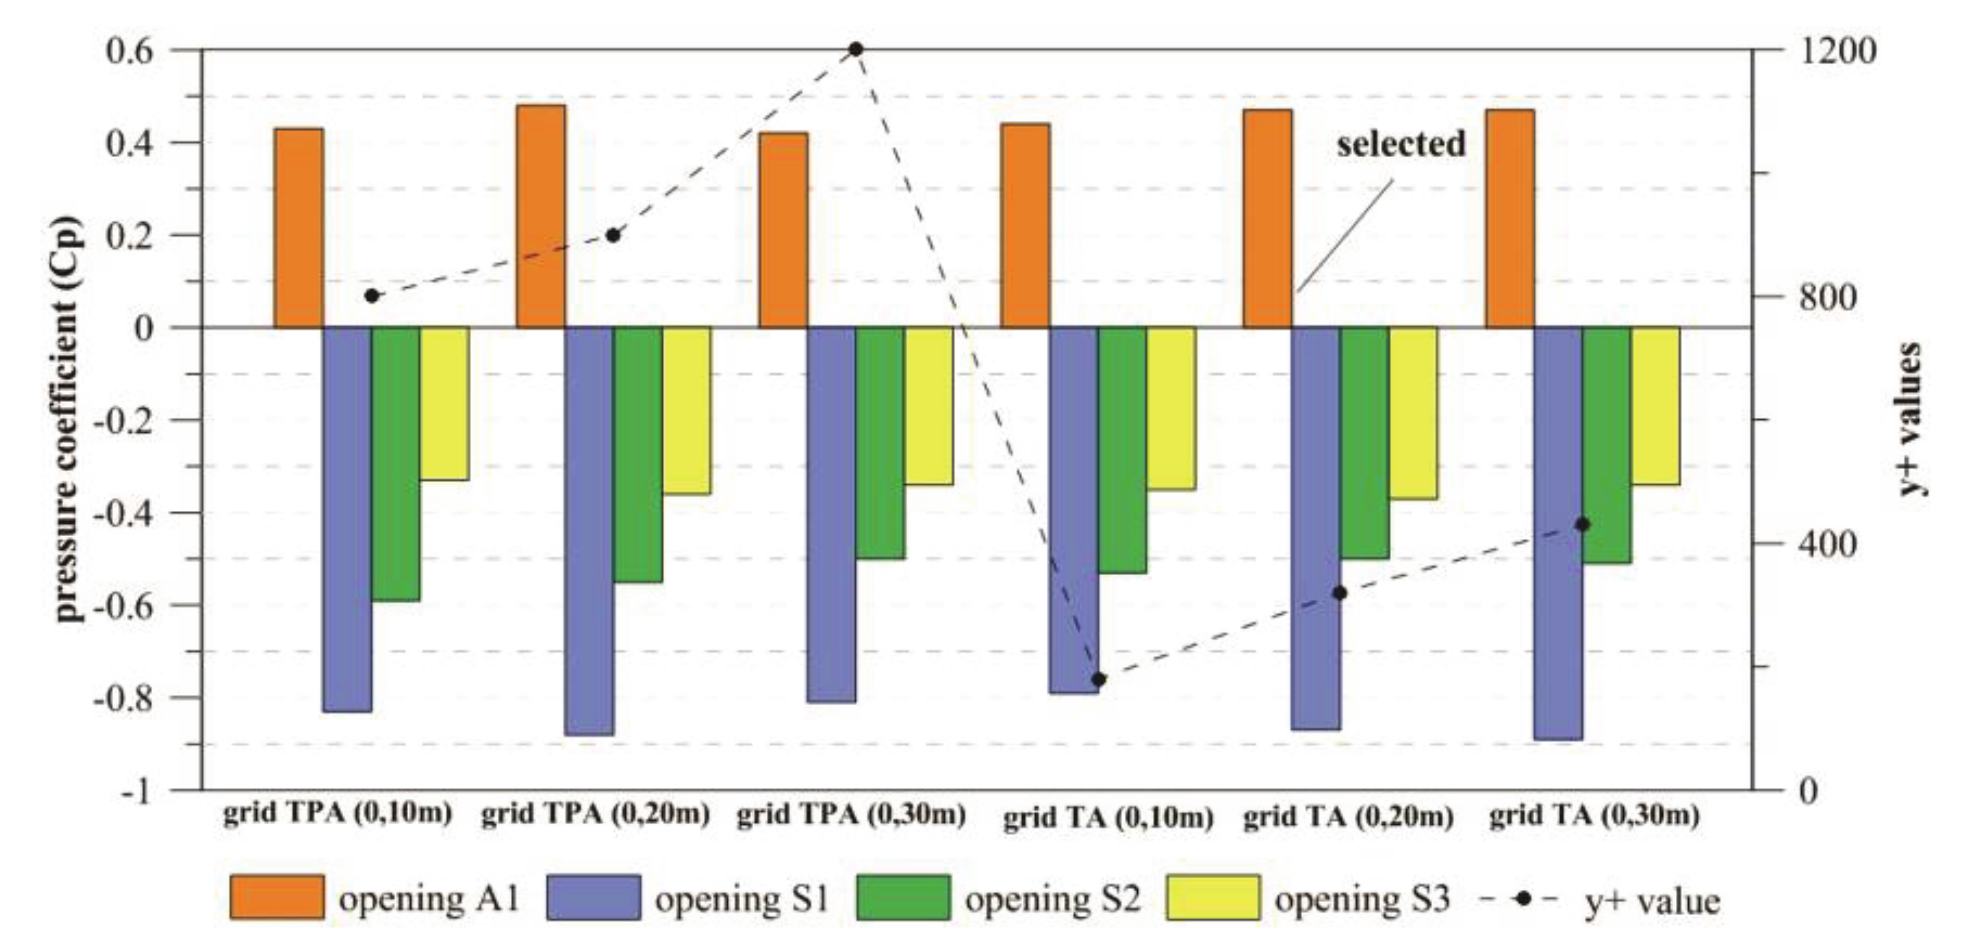
Figure 11.
The variation of the Cp in openings in relation to mesh elements and y+ value.
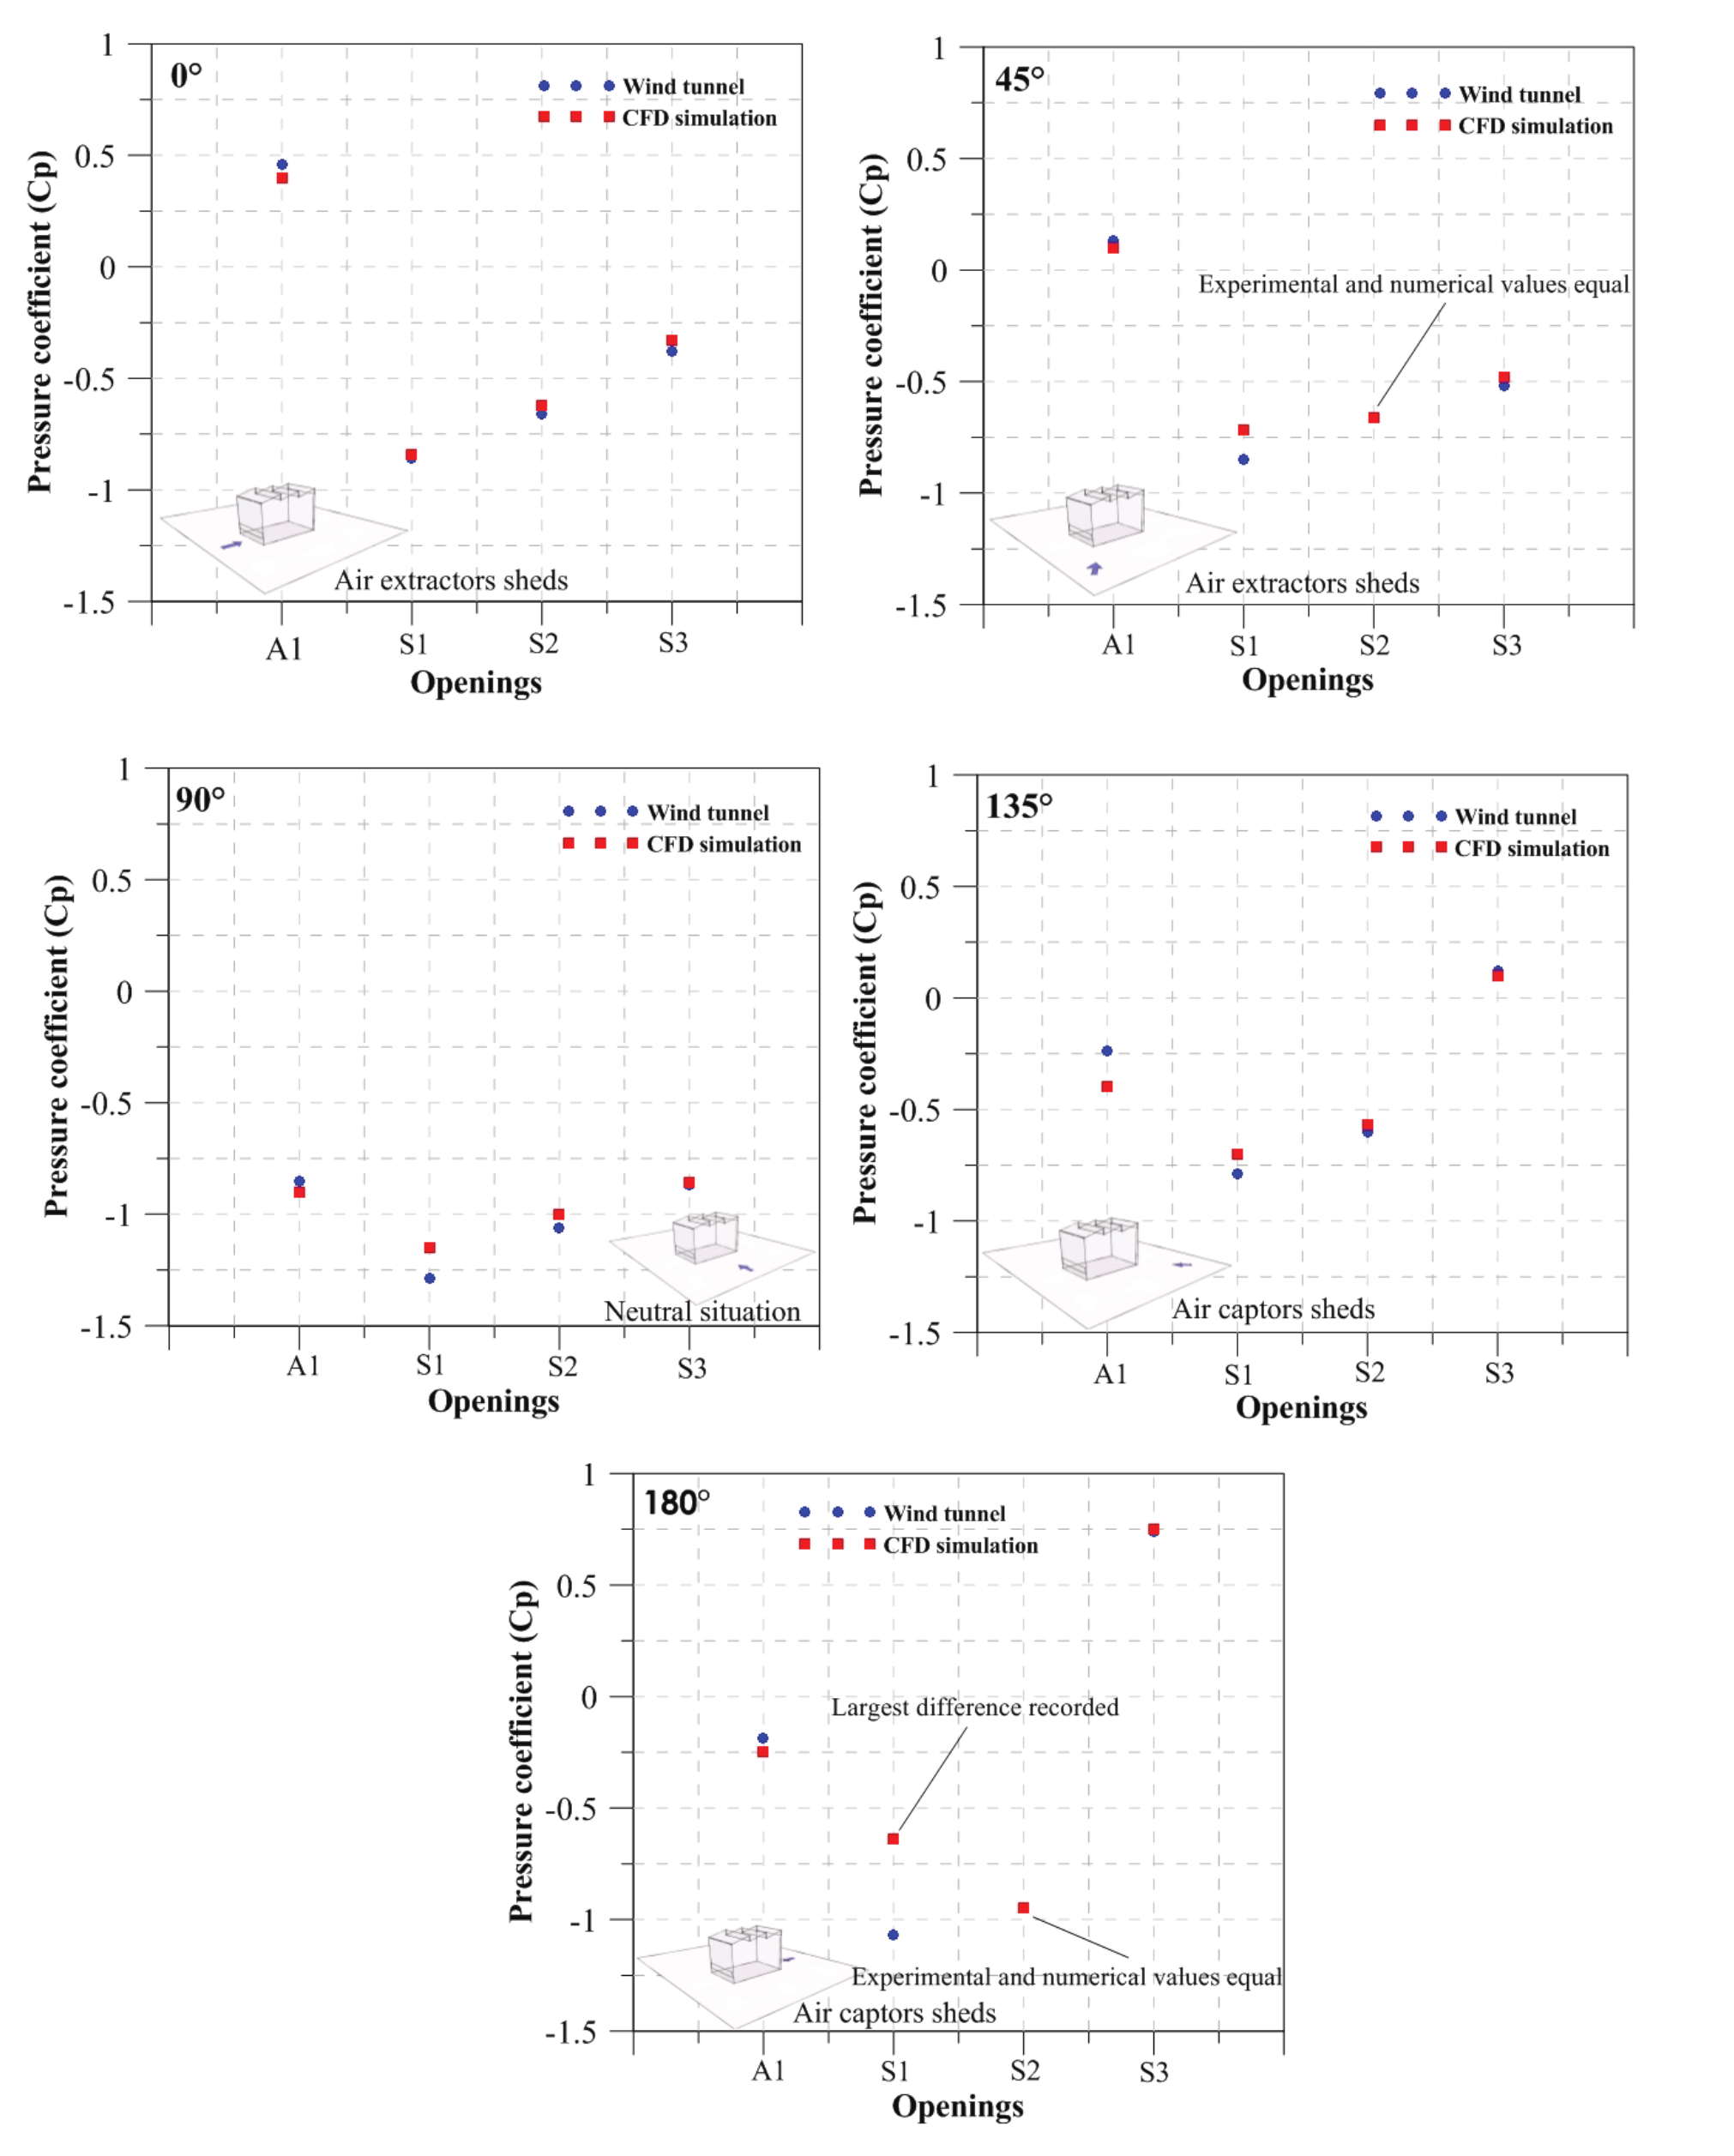
Figure 12.
The Cp in the openings, in relation to winds incidence angles for different wind incidence angles.
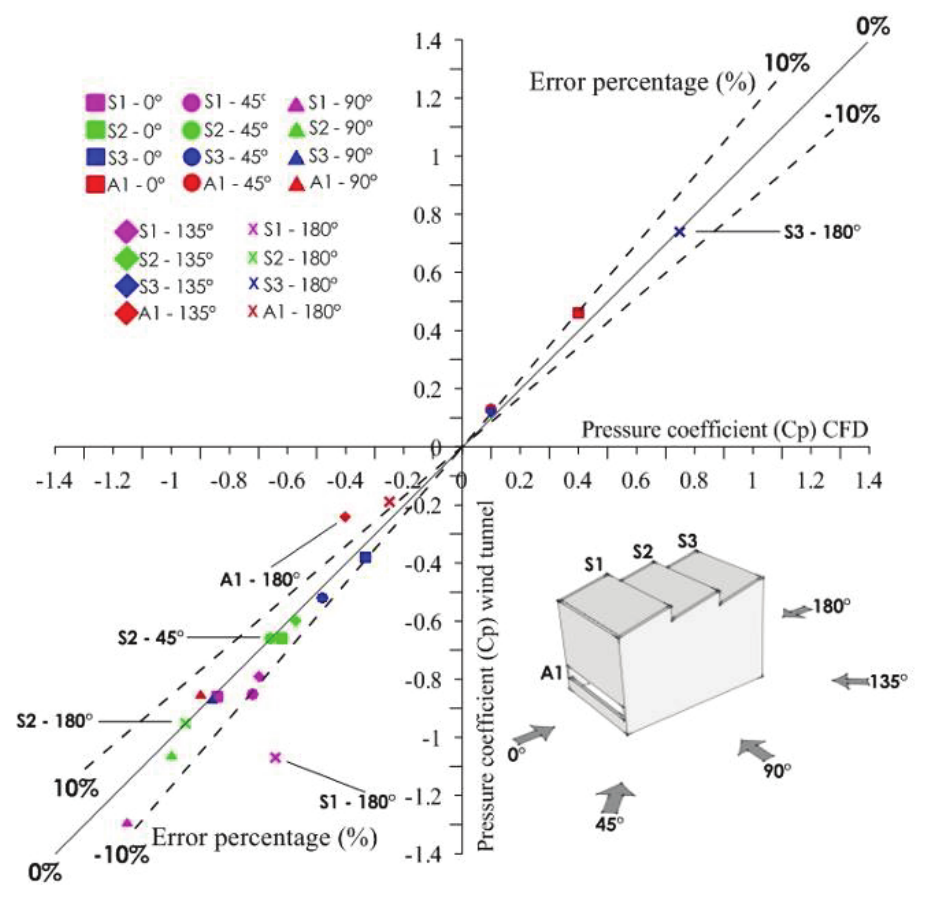
Figure 13.
The Cp values adopting as an error limit the 10% between the wind tunnel tests and CFD simulations.
Conclusion
In this paper noted that the influence of the resolution of the computational grid shows that the inclusion of prismatic elements and the mesh refinement on the building caused no significant effect on the Cp values, although y+ value declined with the refinement of the building elements. However, a more detailed discussion of these aspects is important. There are few studies concerning the influence of these parameters on quantitative variable values, such as Cp.
In general, the CFD simulations are in agreement with the wind tunnel data. The Cp measurements showed consistency between the numerical and experimental results. The analysis showed that the majority of monitored points presented Cp values with errors less than 10%, where larger differences were observed at only two points. However, the differences are within the values reported in the literature and both tools analyzed have the same airflow behavior, showing similar phenomenological performance.
Acknowledgements
Fundação de Amparo à Pesquisa do Estado de São Paulo (Fapesp) under Grant [number 2011/11376-6].
References
Alloca, C., Chen, Q., & Glicksman, L. R. (2003). Design analysis of single-sided natural ventilation. Energy and Buildings, 35(8), 785-795. doi 10.1016/S0378-7788(02)00239-6
Bahadori, M. N., Mazidi, M., & Dehghani, A. R. (2008). Experimental investigation of new designs of wind towers. Renewable Energy, 33(10), 2273-2281. doi 10.1016/j.renene.2007.12.018
Balbastro, G. C., & Sonzogni, V. E. (2012). Uso de CFD para estúdio de pressiones del viento em cubiertas curvas aisladas. Revista internacional de métodos numéricos para cálculo y diseño em ingeniería, 28(1), 49-54. doi 10.1016/j.rimni.2011.11.003
Blackmore, P. A. (1986). Wind loads on pitch roof multi-span buildings. Watford: Building Research Establishment.
Calautit, J. K., & Hughes, B. R. (2014). Wind tunnel and CFD study of the natural ventilation performance of a commercial multi-directional wind tower. Building and Environment, 80, 71-83. doi 10.1016/j.buildenv.2014.05.022
Calautit, J. K., Hughes, B. R., Chaudhry, H. N., & Ghani, S. A. (2013). CFD analysis of a heat transfer device integrated wind tower system for hot and dry climate. Applied Energy, 112, 576-659. doi 10.1016/j.apenergy.2013.01.021
Cândido, C., & Bittencourt, L. S. (2006). Introdução à ventilação natural. Maceió, AL: Edufal.
Cândido, C., De Dear, R. J., Lamberts, L., & Bittencourt, L. S. (2010). Air movement acceptability limits and thermal comfort in Brazil’s hot humid climate zone. Energy and Building, 45(1), 222-229. doi 10.1016/j.buildenv.2009.06.005
Castanho, A. F. S. (2012). Avaliação experimental do conforto pedestre em ambiente urbano (Dissertação de Mestrado). Universidade Técnica de Lisboa, Lisboa.
Chen, D. Z., Bandopaghayhay, P., Haldorsson, J., Byrjalsen, C., Heiselberg, C., & Li, Y. (2003). An experimental investigation of a solar chimney model uniform heat flux. Building and Environment, 38(7), 893-906. doi 10.1016/S0360-1323(03)00057-X
Cost. (2004). Cost Action 14: Recommendations on the use of CFD in predicting pedestrian wind environment. Bruxelas, BE: COST.
Cóstola, D., & Alucci, M. (2007). Pressure coefficient simulated by CFD for wind-driven ventilation analysis. Beijing, CN: Proceedings Building Simulation.
EN 1991-1-4. (2010). Eurocode 1: Actions on structures- Part 1-4: General actions – wind actions. The European Union Per Regulation 305/2011, Directive 98/34/EC, Directive 2004/18/EC. Bruxeles, BE: CEN-Comité Européen de Normalisation.
Franke, J., Hellsten, A., Schlünzen, H., & Carissimo, B. (2007). Best practice guideline for the CFD simulation of flows in the urban environment. Brussels, BE: Cost Office.
Gandemer, J., Barnaud, G., Millet, J. R., & Sacre, C. (1992). Guide sur la climatisation naturelle de l’habitat en climat tropical humide. Tome 1: Methologie de prose em compte des parameters climatiques dans l’habitat et conseils pratiques. France: CSTB.
Harries, A. (2005). Notas de aula. In Workshop:CFX-FAU/USP. São Paulo.
Heras, M. R., Jiménez, M. J., San Isidro, M. J., Zarzalejo, L. F., & Pérez, M. (2005). Energetic analysis of a passive solar design, incorporated in a courtyard after refurbishment, using an innovative cover component based in a sawtooth roof concept. Solar energy, 78(1), 85-96. doi 10.1016/j.solener.2004.05.019
Hughes, B. R., Chaudhry, H. N., & Calautit, J. K. (2013). Passive energy recovery from natural ventilation air streams. Applied Energy, 113, 127-140. doi 10.1016/j.apenergy.2013.07.019
Irwin, H. P. (1981). The design of spires for wind simulation. Journal of Wind Engineering and Industrial Aerodynamics, 7(3), 361-366. doi 10.1016/0167-6105(81)90058-1
Jewel, B. B., William, H., Era, J., & Alan, P. (1999). Low-Speed wind tunnel testing (3rd ed.). India: Wiley India Pvt Ltd.
Jiang, Y., Alexander, D., Jenkins, H., Arthur, R., & Chen, Q. (2003). Natural ventilation in buildings: measurement in a wind tunnel and numerical simulation with large-eddy simulation. Journal of Wind Engineering and Industrial Aerodynamics, 91(3), 331-353. doi 10.1016/S0167-6105(02)00380-X
Leite, R. C. V. (2015). Cidade, vento, energia: limites de aplicação da ventilação natural para o conforto térmico face à densificação urbana em clima tropical úmido. São Paulo, SP: Universidade de São Paulo.
Lôbo, D. G. F., & Bittencourt, L. S. (2003). A influência dos captadores de vento na ventilação natural de habitações populares localizadas em climas quentes e úmidos. Revista Ambiente Construído, 3(2), 57-67.
Lukiantchuki, M. A., Shimomura, A. P., Marques da Silva, F., & Caram, R. (2016). Sheds extratores e captadores de ar: influência da geometria e da dimensão das aberturas no desempenho da ventilação natural nas edificações. Revista Ambiente Construído, 16, 83-104. doi 10.1590/s1678-86212016000100062
Lukiantchuki, M. A. (2015). Sheds extratores e captadores de ar para indução da ventilação natural em edificações. São Paulo, SP: Universidade de São Paulo.
Lukiantchuki, M. A., Caram, R., Matsumoto, E., & Labaki, L. (2014). Natural ventilation by captors and extractors sheds in hospitals in Brazil: Wind tunnel measurements. Journal of Civil Engineering and Architecture, 8(10), 1293-1303. doi 10.17265/1934-7359/2014.10.011
Maerefat, M., & Haghighi, A. P. (2010). Passive cooling of buildings by using integrated earth to air heat exchanger and solar chimney. Renewable Energy, 35(10), 2316-2324. doi 10.1016/j.renene.2010.03.003
Matsumoto, E., Labaki, L., & Caram, R. M. (2011). A aplicação de ensaios em túnel de vento no processo de projeto. In Kowaltowski, D. C. C. K. O processo de projeto em arquitetura: da teoria à tecnologia. São Paulo, SP: Oficina de texto.
Montazeri, H., & Azizian, R. (2008). Experimental study on natural ventilation performance of one-sided wind catcher. Building and Environment, 43(12), 2193-2202. doi 10.1016/j.buildenv.2008.01.005
Perén, J. I., Van Hooff, T., Leite, B. C. C., & Blocken, B. (2015). CFD analysis of cross-ventilation of a generic isolated building with asymmetric opening positions: impact of roof angle and opening location. Building and Environment, 85, 263-276. doi 10.1016/j.buildenv. 2014.12.007
Shi, L., Zhang, G., Cheng, X., Guo, Y., Wang, J., & Chen, L. Y. M. (2016). Developing an empirical model for roof solar chimney based on experimental data from various test rigs. Building and Environment, 110, 115-128. doi 10.1016/j.buildenv.2016.10.002
Standard Australia. (1989). Loading code. Part 2: wind loads standards Australia, North Sydney, New South Wales, Australia. Sydney, AU: Australian Standards AS1170.2.
Stathopoulos, T., & Saathoff, P. (1992). Codification of wind pressure coefficients for sawtooth roofs. Journal of Wind Engineering and Industrial Aerodynamics, 43(1-3), 1727-1738. doi 10.1016/0167-6105(92)90584-W
Tominaga, Y., Mochida, A., Yoshie, R., Kataoka, H., Nozu, T., Yoshikawa, M., & Shirasawa, T. (2008). AIJ guidelines for practical applications of CFD to pedestrian wind environment around buildings. Journal of Wind Engineering and Industrial Aerodynamics, 96(10-11), 1749-1761. doi 10.1016/j.jweia.2008.02.058
Notes
Author notes
mlukiantchuki@yahoo.com.br