Ciência, Tecnologia de Alimentos e Engenharia de Alimentos
Release optimization of fermentable sugars from defatted rice bran for bioethanol production
Otimização da liberação de açúcares fermentescíveis do farelo de arroz desengordurado para produção de bioetanol
Release optimization of fermentable sugars from defatted rice bran for bioethanol production
Acta Scientiarum. Technology, vol. 40, 2018
Universidade Estadual de Maringá

This work is licensed under Creative Commons Attribution 4.0 International.
Received: 25 January 2017
Accepted: 08 September 2017
Abstract: The aim of this study was to optimize the enzymatic hydrolysis of defatted rice bran (DRB) for release fermentable sugars with subsequent bioethanol production. Optimization of enzymatic hydrolysis was achieved using a sequential experimental design, performing a fractional factorial design (FFD) followed by two Central Composite Rotatable Designs (CCRDs). The optimization was achieved under the conditions of 200 g L-1 of DRB concentration, 30 μL of α-amylase g-1 of DRB and 40 μL g-1 of amyloglucosidase (AMG), at action times of two and three hours, respectively. In bioethanol production, it was evaluated the effect of adding of 15 μL g-1 of protease prior to the action of amylases. Fermentation was conducted at 29°C, with 4.0% Saccharomyces cerevisiae and initial pH of 5.0. The hydrolysis with protease yielded 3.55% ethanol, an increase of 115.15% in relation to the medium without protease addition, and the conversion had a yield of 101.5% in 24h of alcoholic fermentation. This study demonstrates the possibility to obtain bioethanol from DRB.
Keywords: alcoholic fermentation, strategy of experimental design, reducing sugars for bioprocess, protease.
Resumo: O objetivo deste estudo foi otimizar a hidrólise enzimática do farelo de arroz desengordurado (FAD) para a liberação de açúcares fermentescíveis com posterior produção de bioetanol. A otimização da hidrólise enzimática foi alcançada por meio da utilização de uma sequência de planejamento experimental, executando-se um planejamento experimental fatorial fracionário (FFD), seguido de dois delineamentos compostos centrais rotacionais (DCCRs). A otimização foi obtida sob as condições de 200 g L-1 de concentração de FAD, 30 μL de α-amilase g-1 de FAD e 40 μL g-1 de amyloglucosidase (AMG) g-1 de FAD, com os tempos de atuação de duas e três horas, respectivamente. Na produção do bioetanol, foi avaliado o efeito da adição de 15 μL g-1 de protease previamente à adição das amilases. A fermentação foi conduzida a 29°C, 4,0% de Saccharomyces cerevisiae e pH inicial 5,0. O meio hidrolisado com a protease rendeu 3,55% de etanol, um aumento de 115,15% em relação ao meio sem adição da protease e uma taxa de conversão de 101,5% em 24h de fermentação alcoólica. Este estudo demonstra a possibilidade de obtenção de bioetanol a partir de FAD.
Palavras-chave: fermentação alcoólica, estratégia de delineamento experimental, açúcares redutores para bioprocesso, protease.
Introduction
Defatted rice bran (DRB) is an important by-product obtained by processing of polished rice. In the crop production of 2014/2015, Brazil was responsible for the production of approximately 12.436 million tons of rice (National Company of Supplying [NCS], 2016). The processing of white rice results in several by-products such as bran, that is high in protein, fat, carbohydrate, and a number of micronutrients such as vitamins, minerals, antioxidants, and phytosterols (Schramm, Abadie, Hua, Xu, & Lima, 2007; Shirakawa, Koseki, Ohinata, Hazhizume, & Komai, 2006; Loypimai, Moonggarm, & Chottanom, 2009; Bhatnagar, Prabhakar, Prasanth, Rajan, & Gopala Krishna, 2014; Wang et al., 2015).
The chemical composition and nutritional quality of rice grains vary considerably because of genetic factors, environmental influences, fertilizer treatment, grinding and storage conditions (Amissah, Ellis, Oduro, & Manful, 2003).
Amissah et al. (2003) observed that the concentration of carbohydrate in 16 varieties of rice bran ranged from 26 to 46%, which was confirmed in a study by Moongngarm, Daomukdaa and Khumpika (2012) (40.26%). Its preservation "in nature" becomes problematic because it contains lipase, which is responsible for the process of rancidity, making it inedible, therefore requiring the development of processes to use this by-product (Kahlon, 2009).
The high carbohydrate concentration justifies the use of DRB in fermentative processes, such as bioethanol production; however, it is necessary to convert the starch into reducing sugars (RS) by acid hydrolysis, high temperatures under pressure, or by enzymes. Acid hydrolysis offers an effective means of conversion, but the recovery of the acid is inefficient, and it results in the production of hydroxide-methyl furfural, which inhibits the growth of yeasts, impairing fermentation. The use of high pressures can damage the catalytic effect of α-amylase, causing a decrease in the conversion rate of the starch into RS, such that enzymatic hydrolysis becomes more efficient (Farone & Cuzens, 1996; Kim & Hamdy, 1985; Buckow, Weiss, Heinz, & Knorr, 2007).
Jieun, Seo, Kweon, Park, and Jin (2009) evaluated the production of butanol and ethanol from hydrolyzed polysaccharides of bran and defatted rice bran. The processes of acid and enzymatic hydrolysis were studied, and for acid hydrolysis the authors reported a higher conversion of polysaccharides to fermentable sugars, but also stressed on the formation of toxic compounds such as furans, aliphatic acids, and phenolic compounds. During the alcoholic fermentation, the yeast could not consume all the sugar produced in the medium treated by acid hydrolysis, which may have been caused by the presence of toxic compounds. In the medium treated by enzymatic hydrolysis, all sugar was consumed.
Todhanakasem, Sangsutthiseree, Areerat, Young, and Thanonkeo (2014) produced bioethanol from rice bran hydrolyzed by acid treatment followed by the action of cellulosic enzymes. The rice bran hydrolyzed contained approximately 18 g L-1 glucose, furfural 198.68 ppm, 5-hydroxymethyl furfural (5-HMF) 0.095 ppm, vanillin 0.86 ppm, syringaldehyde 3.19 ppm, and 0.168% acetic acid (pH 6.0). The fermentation was conducted with Zymomonas mobilis and the higher concentration of ethanol produced was 13.40 ± 2.43 g L-1.
During the alcoholic fermentation, the presence of nutrients such as proteins and lipids form a cover wrapped starch, decreasing the performance of the hydrolytic enzymes (Watanabe, Honda, Kashiwamura, Sasano, & Watanabe, 2007). In addition, yeasts require nitrogen to maintaining metabolic activity. About 10-15% of the weight of the yeast consists of nitrogen, which makes it an essential macronutrient (Alexandre, Rousseaux, & Charpentier, 1994; Bamforth, 2005). In this way, the hydrolysis of proteins, present in the substrates, and the consequent release of amino acids that have nitrogen in its composition, can help to improve a higher metabolic activity of yeast. The rice bran contains 12 to 15% protein (Zhang, Zhang, Wang, & Guo, 2012).
Therefore, the aim of this study was to examine the enzymatic hydrolysis process of complex sugars in DRB, and evaluate the effect of protease addition in the production of ethanol, enabling further use of the hydrolyzed for bioethanol production.
Material and methods
The DRB (11.09% moisture; 1.67% fat; 11.31% ash; 14.89% proteins; 61.03% carbohydrate), provided by Riograndense Vegetable Oil Industry (IRGOVEL-Pelotas, Rio Grande do Sul State) was ground in a Wiley mill and frozen until the tests. The enzymes, α-amylase (TERMAMYL 2X, Novozymes A/S), amyloglucosidase (AMG 300L-amyloglucosidase from Aspergillus niger-Novozymes A/S), and protease (alcalase, Novozymes A/S), were kindly provided by the company LNF-American Latino (Brazil, Rio Grande do Sul).
After hydrolysis, the medium was inoculated with Saccharomyces cerevisiae (commercial lyophilized yeast), purchased in the local market, in the ratio of 5.0% (g 100 g-1).
Experimental design strategy for enzymatic hydrolysis of DRB
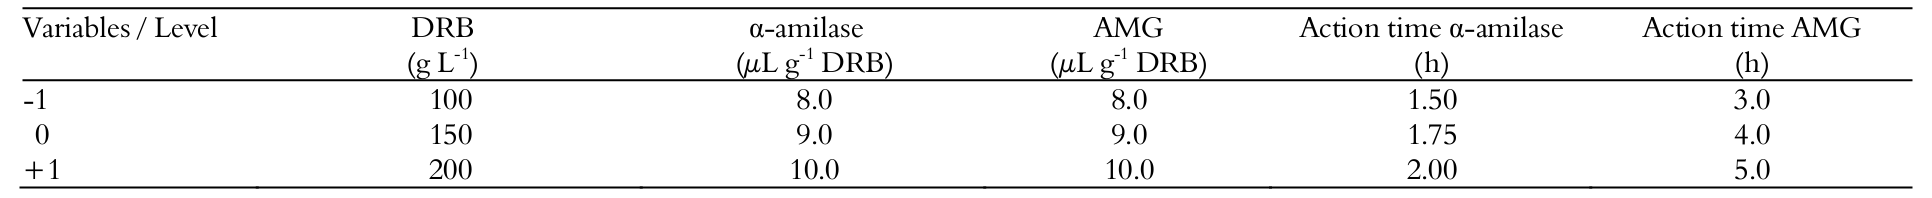
The effect of the concentration of DRB [ratio bran:water (g L-1)], concentration and time of action of a-amylase and AMG on the response of RS was evaluated through a sequential experimental design. Firstly, a FFD including 25-1 trials plus three center points (19 runs) was applied to assess the effects of the variables. The statistical design and the coded and real values of the variables are given in Table 1.
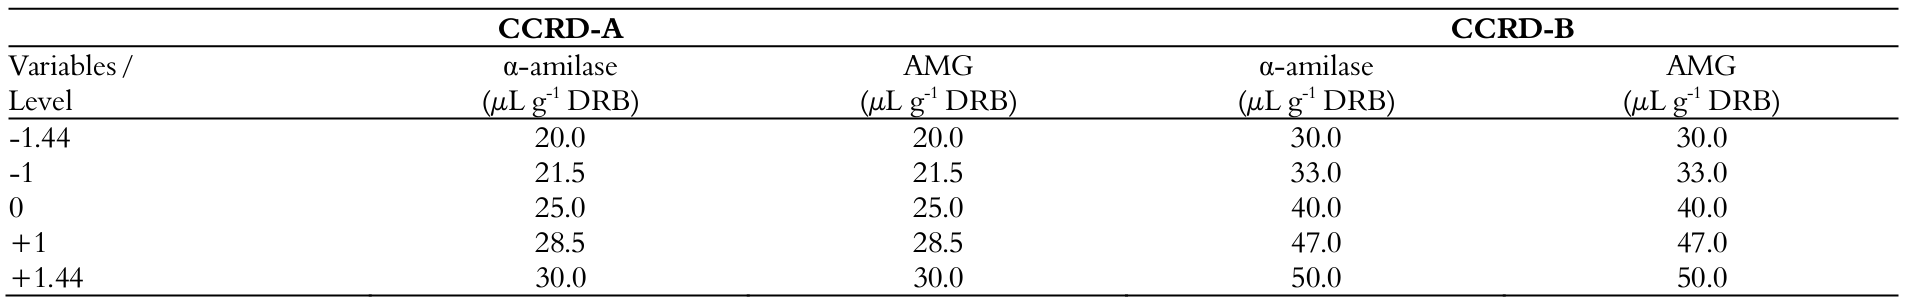
The preliminary FFD allowed for the selection of statistically significant variables with respect to reducing sugar liberation. With these variables, two sequential CCRD were applied, with three replicates at the central point and four axial points (22 plus star configuration, with 11 runs each) in order to achieve the process optimization. The design matrix with the coded and real values of variables of CCRDs is given in Table 2.
The definition of the levels of the variables was substantiated as described by Chen and Chen (2009) and according to values used industrially for the hydrolysis of starch from rice, provided by the enzyme suppliers. Along with the trials, a “control treatment” (absence of enzymatic activity) was conducted for comparison.
All runs (FFD and CCRDs) were conducted in 250 mL Erlenmeyer flasks, adding milled DRB in distilled water in the proportions defined by the experimental design. The -amylase was added with the pH and temperature previously adjusted to 6.0 and 90°C, respectively; posteriorly, the AMG was added with the temperature and the pH adjusted to 55°C and 4.7, respectively. The action times and enzymes concentrations were defined in the experimental design (Table 1). All runs were conducted in thermostatic bath with agitation set at 100 rpm. The reducing sugar analysis was performed at the end of the hydrolysis time.
All experiments of the FFD and the CCRDs were performed randomly, and the data were analyzed using the software STATISTIC 7.0 (Statsoft Inc., Tulsa, OK). The quality of fit of the second-order model equation was expressed by the coefficient of determination R2, and its statistical significance was determined by an F-test (analysis of variance-ANOVA).
Alcoholic fermentation
With optimized conditions of enzymatic hydrolysis, the hydrolyzed medium was centrifuged at 3600 x g for five min in a refrigerated centrifuge (CIENTEC, CT-5000R, Piracicaba, São Paulo) for later use in alcoholic fermentation. The alcoholic fermentation was conducted in triplicate in 500 mL Erlenmeyer flasks with 250 mL of medium, incubated in an orbital shaker (SOLAB, Model SL 221, Piracicaba, São Paulo) under stationary conditions, with the temperature held at 30°C, the pH at 5.0, and a concentration of the inoculum of 5.0% for 72h (conditions defined in unpublished study).
To evaluate the results, samples of the medium were collected every 12h to determine the ethanol concentration. For monitoring the concentration of dry cell weight, RS, and pH, the samples were collected every 6h.
Influence of treatment with protease in ethanol concentration
To assess the possibility of an increase in the percentage of ethanol yield, a treatment of the suspension of rice bran was made with protease addition before enzymatic saccharification (addition of amylases). Three new assays were performed in 500 mL conical flasks with 400 mL medium. For addition of protease (15 µL of protease g-1 of DRB), the pH of medium was adjusted to 6.5, according recommendations of the enzymes supplier, and the temperature was maintained at 60°C. The activity of the enzyme was kept for 2h at 60°C, in a thermostatic bath. These parameters were based on the study by Watanabe et al. (2009) and on values used industrially, assigned by the supplier of the protease. The amylolytic enzymes hydrolysis was subsequently performed in the optimized conditions (described in section 3.1.2) to obtain the culture medium for alcoholic fermentation conducted as described in section 2.3.
Analytical methods
Determination of RS
The concentration of RS released after the process of enzymatic hydrolysis was determined in triplicate by the technique of Somogyi (1945) and Nelson (1944). These results were expressed as % (g 100 g-1 of DRB).
Determination of Ethanol Concentration
The ethanol concentration was determined using an Ultrahigh Pressure Liquid Chromatograph (UPLC) (DIONEX, Model U3000) equipped with a Refractive Index and a diode array detector, using the methodology proposed by Aguiar, Nascimento, Ferretti, and Gonçalves (2005), with some modifications. The samples were filtered on a 0.45 µm Millipore membrane and injected into a Rezex ROA-Organic Acid H + (8%) column. The mobile phase consisted of 5mM H2SO4 kept under a flow of 0.6 mL min.-1. The system temperature was held at 30°C. The detection was performed by refractive index, and the injected sample volume was 20 µL. Standard ethanol (Sigma) was used on the calibration curve to calculate the concentration of ethanol in the samples.
Determination of pH
The pH was determined in triplicate using a potentiometric method, according to the methods of the Adolfo Lutz Analytical Standards Institute (Adolfo Lutz, 1985).
Measurement of Dry Cell Weight (Biomass)
The concentration of dry mass was analyzed in triplicate by reading the optical density (OD) at 600 nm of an aliquot of the culture medium, using calibration curves of OD versus dry mass.
Results and discussion
Enzymatic hydrolysis of DRB
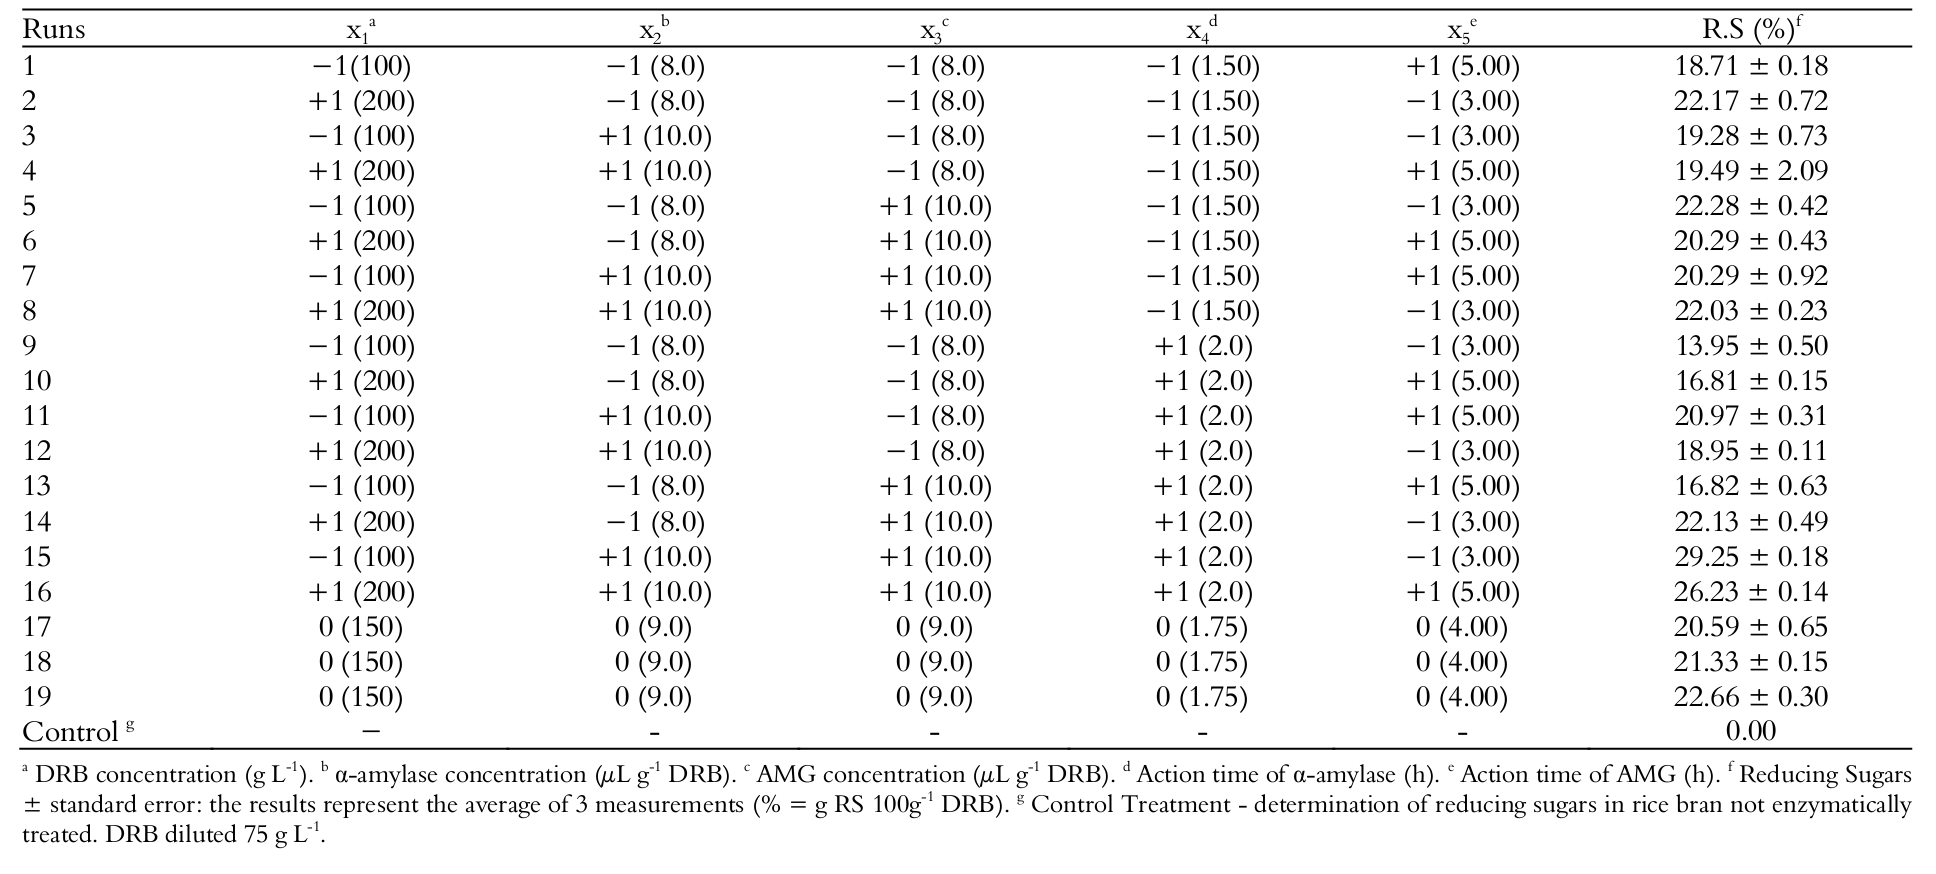
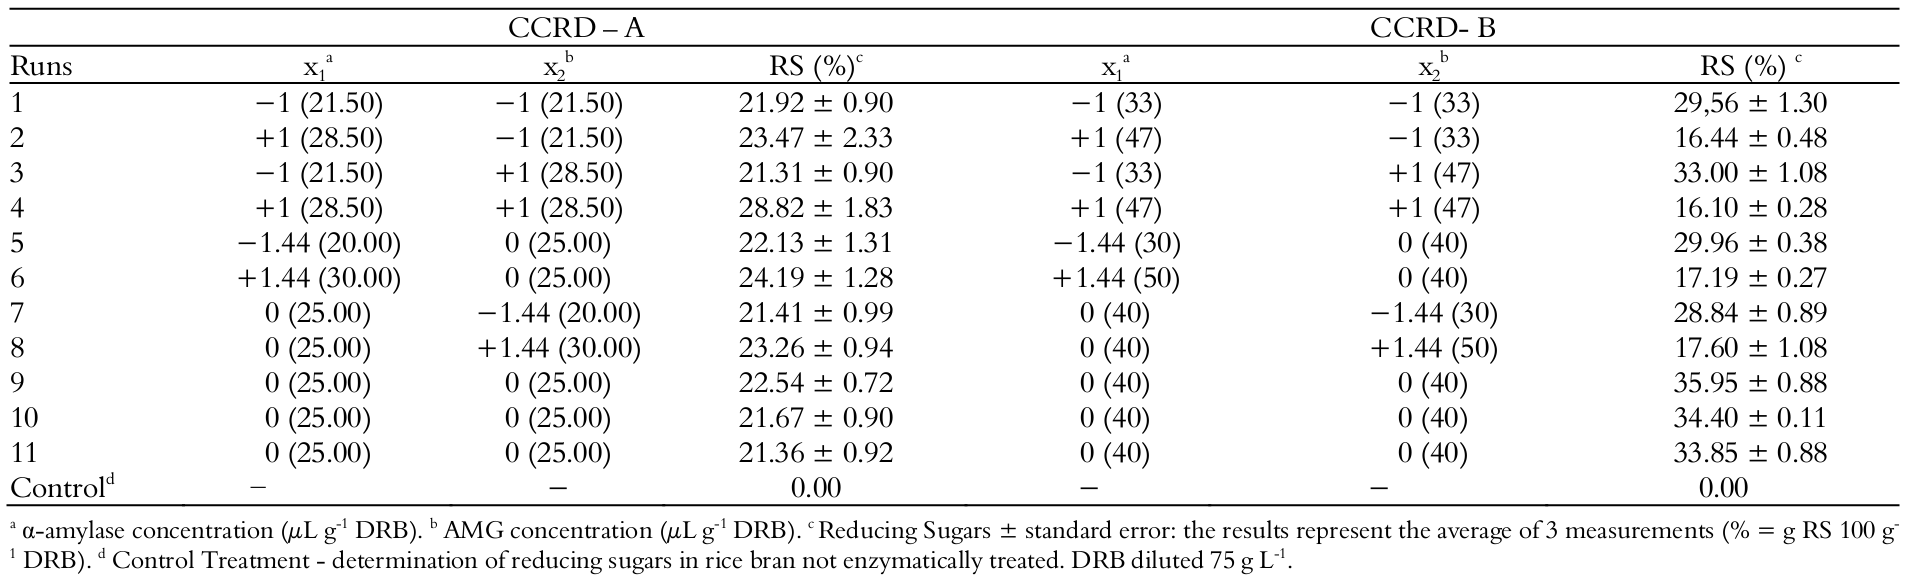
The design matrix with the coded and real values of the variables and the responses of RS of all runs of the FFD and control treatment is presented in Table 3.
The starch hydrolysis is initiated by the starch liquefaction in the water and subsequent action of the α-amylase enzyme which randomly cleaves the α1,4 bonds of polysaccharides dispersed in aqueous medium. AMG is an enzyme that acts from the non-reducing end and it is used to terminate the starch saccharification cleaving both α1,4 and α1,6 bonds (Palmarola-Adrados, Chotěborská, Galbe, & Zacchi, 2005). Therefore, the concentration and the time of action of these enzymes are of extreme importance for the complete starch hydrolysis.
In the responses of FFD, the lowest value observed of RS was 13.95% (g 100 g-1) in run 9, where only the action time of α-amylase was at a higher level within the range studied. The largest response observed was 29.25% in run 15, when the enzymes concentration and action time of α-amylase were in the upper level of the range studied.
By the analysis of the effects of the FFD, it was observed that the variable time of action of the AMG had a negative effect, probably due to a decrease in the enzyme activity during the 3 hours of the process. Palmarola-Adrados, Chotěborská, Galbe, & Zacchi, 2005)., the enzyme reaction speed increases since the substrate is in excess, justifying the need to shorten the action time of AMG, taking in to account the range studied for the DRB dilution rate. For the concentration of both enzymes, the effect was positive and significant (p ≤ 0.10), evidencing an incomplete starch hydrolysis, requiring an increase in the concentration of both enzymes.
The concentration of DRB and action time of α-amylase showed positive effects, however not significant within the range studied. The range of study applied for the action time of α-amylase was close (1.5-2h), and this may have limited the statistical analysis of this variable.
Optimization of enzymatic hydrolysis
In the sequence of study, a CCRD, namely CCRD-A, was applied. The variables that did not showed statistically significant effects (DRB concentration, action times of AMG and α-amylase) were fixed considering the effects shown on the results of the FFD. The DRB concentration had positive effect, so it was set at the higher level (+1) studied on the FFD (200 g L-1). For AMG, the time of performance had a negative effect, so it was fixed at the lower level (-1) of the FFD (3h). For the action time of α-amylase, besides the effect obtained (positive effect), it was observed the time industrially applied (2h) and so it was fixed at the higher level (+1) of the FFD (2h).
The concentrations of α-amylase and AMG were statistically significant and showed positive effects on the response evaluated. Therefore, the concentration range of enzymes was expanded to 20–30 μL g-1 DRB to perform the CCRD-A (Table 2).
The responses for RS concentration in the CCRD-A are shown in Table 4.
The concentrations of RS ranged from 21.31 to 28.82% (g 100 g-1) (runs 3 and 4). Comparing the highest results of FFD and CCRD-A, there is a small difference between their values (29.25 ± 0.19 to 28.82 ± 1.83% (g 100 g-1), both obtained in the maximum level of enzyme concentration. Analyzing the results of Table 4, it was possible to determine the regression coefficients (Table 5).
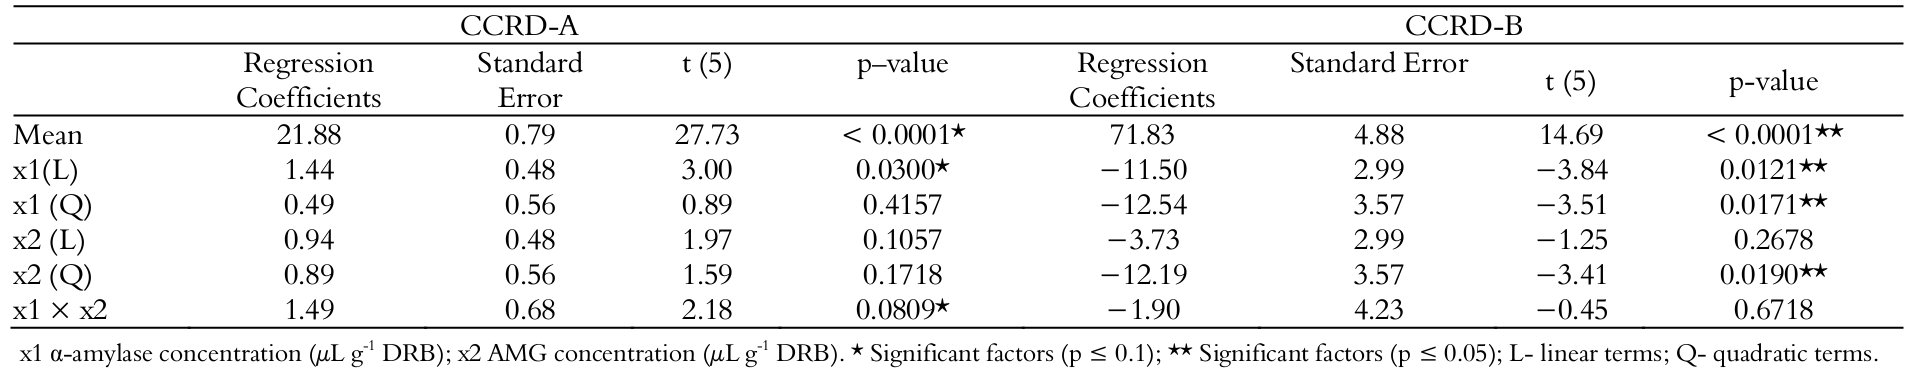
From the regression coefficients of CCRD-A, it was observed that the concentration of α-amylase had significant effect (p ≤ 0.10). The Fcalculated (4.07) for regression was significant (≥ Ftabulated 3.45), and the percentage of variance explained by the model was adequate (R2 approximately equal to 80.30%), considering the variability inherent to enzymatic processes (Haaland, 1989). These results lead to the conclusion that the model fitted well to the experimental data, and it was possible to generate the response surface shown in Figure 1-I.
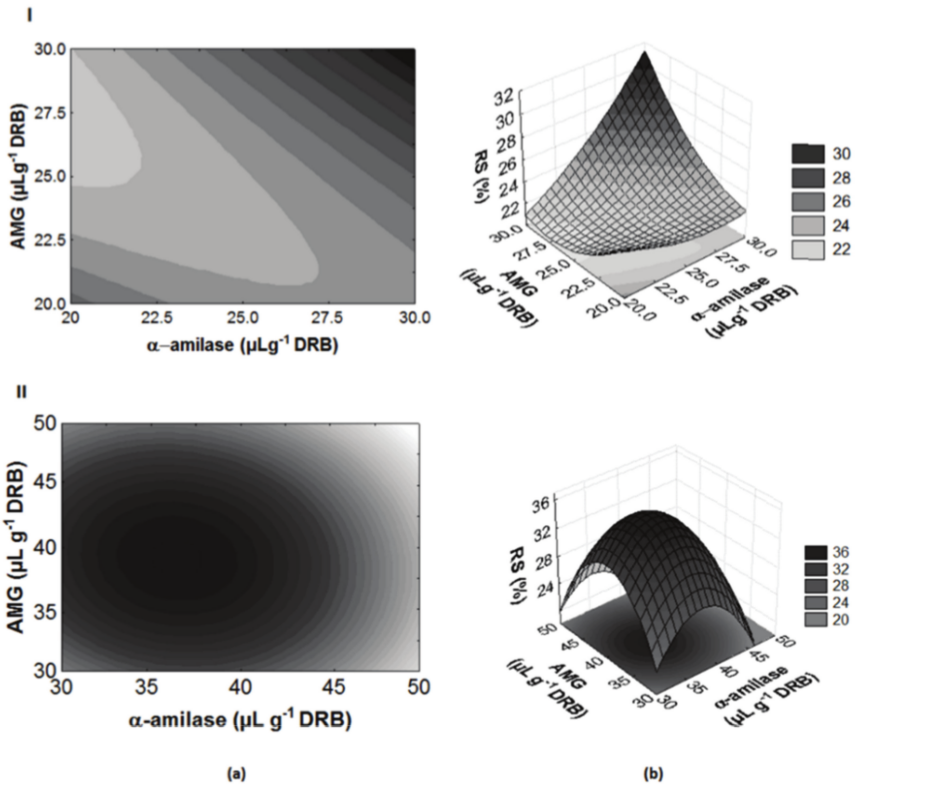
Figure 1.
(I)Contour diagram (a) and response surface (b) for Reducing Sugars (%) as a function of a-amylase and amyloglucosidase (AMG) concentrations (µL g-1 bran) of the CCRD-A. (II)Contour diagram (a) and response surface (b) for Reducing Sugars (%) as a function of a-amylase and amyloglucosidase (AMG) concentrations (µL g-1 bran) of the CCRD-B.
Analyzing the response surface and contour curves (Figure 1-I), it was observed that on the studied ranges, higher concentrations of RS were obtained at higher levels of enzyme concentrations; however, it was not possible to achieve optimization of the hydrolysis process. This result can be due to insufficient concentration of amyloglucosidase and amylase, resulting in a partial hydrolysis. The amylases act on the starch granule surface without cleave the branches, being therefore a limited hydrolysis of the amylopectin, releasing dextrins or branched oligosaccharides. It is the amyloglucosidase that complete the hydrolysis cleaving the major and branched chains (dextrins) into glucose (Lévêque, Janečekc, Haye, & Belarbi, 2000; Suvd, Fujimoto, Takase, Matsumura, & Hiroshi, 2001).
As the effect of the two enzyme concentrations was positive, a new CCRD namely CCRD-B was performed, expanding the ranges of both variables to 30–50 μL g-1 DRB.
The design matrix of the CCRD-B with real and coded values of the variables, and the responses to the RS concentration are presented in Table 5. For comparison, a “control treatment” was examined. Comparing the highest results of CCRD-A (28.82% (g 100 g-1)) with the results of the CCRD-B (35.95% (g 100 g-1)), there was an increase of 24.7% (g 100 g-1) in the RS concentration. The highest responses of CCRD-B were obtained in the central points (33.85 to 35.95% (g 100 g-1)). The lowest response in CCRD-B was 16.10% (g 100 g-1), found in the run 4 with the two enzymes at the higher levels studied. This behavior can be explained by the fact that enzyme and substrate concentrations determine the rate of the enzymatic reaction, and with an increase in both concentrations (substrate and enzymes), the increase in the reaction rate showed that the substrates are in excess (Srivastava & Chosdol, 2007). However, with an increase in enzyme concentrations, the substrate is not in excess, and the rate of hydrolysis is decreased. Therefore, with the enzymes in the maximum level (+1.44) (50 μL g-1 DRB), the substrate is no longer in excess, therefore reducing the rate of hydrolysis of the DRB.
The regression coefficients of factors evaluated of CCRD-B showed that the two variables had statistically significant effects (p ≤ 0.05) on the response of RS, and in the negative direction, indicating that the increase in enzyme concentration within the range studied (30 - 50 μL g-1DRB) resulted in decreased RS concentration, probably due to a limitation in substrate concentration.
Considering the significant parameters (p ≤ 0.05) of CCRD-B the Equation 1 was obtained, representing the quadratic model of RS as a function of the variables studied.
Where A and B are the independent variables, concentrations of α-amylase and AMG, respectively.
The regression was significant Fcalculated (6.77) was higher than Ftabulated (5.05), and the percentage of variance explained by the model was adequate (R2 approximately equal to 87.53%) considering the variability inherent to enzymatic processes (Haaland, 1989). Thus, it was concluded that the model fitted well to the experimental data, and it was possible to generate the response surface shown in Figure 1-II.
In the Figure1-II, it is possible to observe that the optimal region for hydrolysis of DRB is within the range of 30–40 μL g-1 DRB for α-amylase concentration and at the center point studied for AMG concentration (40 μL g-1 DRB). The validation of the optimized conditions was performed in triplicate. Results of 34.4% RS (g 100 g-1) (68.8 g L-1) (run with 30 μL g-1 DRB of α-amylase and 40 μL g-1 DRB of AMG) and 33.50% RS (g 100 g-1) (67.0 g L-1) (40 μL g-1 DRB for both enzymes) were observed. Based on the results of the Tukey test, these two treatments were statistically different (p < 0.05). Therefore, it is possible to affirm that the optimization of hydrolysis was achieved by using the concentration of α-amylase and AMG on 30 and 40 μL g-1 of DRB, respectively.
The results obtained can be compared with those reported in the study of Oh et al. (2015) that achieved 24% (g 100 g-1) of glucose in hydrolyzed rice bran with 1.5 mL of α-amylase (Sigma A8220), 1.5 mL of glucoamylase (Sigma A7095), and 1.5 kU of invertase (Sigma I4504) that were added per 1 L of substrate mixture at 50°C for 24h.
Another methodology used for enzymatic hydrolysis of fresh rice bran was studied by Devi, Vijayendra, and Shamala (2012), using 100 g L-1 of the substrate dilution rate in water and the enzyme α-amylase (Anilozyme, Anil Starch Industries, Ahmedabad, India) at 80°C for 30 min. and AMG at 50°C and a pH of 5.5 for 4h. The result observed by the authors was 26.4% (g 100 g-1) of RS.
 (1)
(1)The study of Jieun, Seo, Kweon, Park, and Jinet (2009) assessed the production of ethanol and butanol from rice bran and DRB. In that study, the substrates were hydrolyzed by chemical methods, enzymatic methods, and a combination of both. In enzymatic hydrolysis, the conditions used were 100 g L-1 DRB, 5 μL g-1 DRB of α-amylase and incubation at 30°C for 4h followed by adding 0.15 mg g-1 of β-amylase and 0.01 mL g‑1 of AMG, and then, incubating at 37°C for 4h. For acid treatment, 1% (v/v) HCl was used at 80°C for 3h. The acid-treated mixture was then cooled to room temperature followed by adjusting to pH 6.0 with 10 N NaOH and sterilized at 121°C for 15 min. The results of fermentable sugars released ranged from 20 - 30% (g 100 g-1) depending on the treatment utilized. The lowest result was obtained in the medium with enzymatic treatment, and highest result with the use of the combination of enzymatic and chemical treatments, becoming more costly process than the one used in this work, besides presenting lower concentrations of fermentable sugar in the medium.
Considering the results obtained in the cited studies, which reached the maximum of 26.4% (g 100 g-1) for conversion of the substrate to reducing sugars using enzymatic treatment, it is possible evaluate that this study presents a breakthrough in obtaining reducing sugars from DRB by enzymatic hydrolysis, wherein more than 34% of the substrate was converted, improving the performance of substrate in fermentation processes.
Alcoholic fermentation
The kinetics obtained from the fermentation of the treatments with and without the addition of protease are shown in Figure 2.
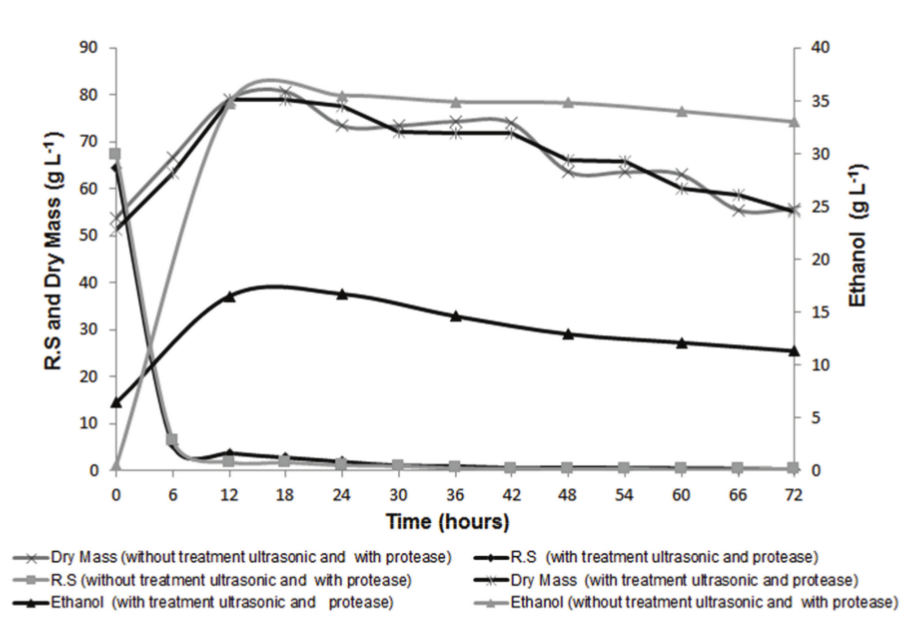
Figure 2.
Kinetic profile of alcoholic fermentation of defatted rice bran.
The two experiments were started at similar concentrations of RS (approximately 68 g L-1) and showed a marked decrease in substrate concentration during the first 6h. These results show that the protease had no effect on enzymatic hydrolysis. In both medium, the dry cell weight showed a large increase up to 12h of fermentation, followed by a stationary phase and a subsequent decline. In this same time, the RS concentration reduced and the ethanol concentration increased. In 12h of fermentation, the ethanol concentration of medium without alcalase achieved 16.5 g L-1 of ethanol, and after 12h, the concentration had a slight decrease that may have occurred due to evaporation of ethanol during of process.
Theoretically 1 g of glucose yields 0.51 g of ethanol (Adams, 1985). As the hydrolyzed used in this study contained 68 g L-1 of RS at the beginning of alcoholic fermentation, it would be possible to obtain approximately 35 (g L-1) ethanol, higher concentration than that achieved in the medium without the treatment with protease. This behavior can be explained by the composition of DRB, a complex substrate that contains important substances with possible inhibitory effect on enzymatic saccharification and fermentation process. Presence of nutrients such as proteins and lipids decrease the exposure area of the starch granules, hindering the use of starch for the hydrolytic enzymes. Besides, the proteins hydrolysis release amino acids used as source of nitrogen for the yeast (Fabian, Huynh, & Ju, 2010; Watanabe et al., 2009). As observed in Klosowski, Mikulski, Czuprynski, and Kotarska (2010), the availability of free amino acids results in a lower requirement for the synthesis of amino acids by yeast and higher yield of biomass per mole of glucose consumed. DRB has protein in significant concentrations, about 12.5% (Amissah et al., 2003).
In both treatments the highest ethanol concentrations were observed in 24h of fermentation. Similar results were found in other studies that performed enzymatic hydrolysis of pineapple leaf wast and corn kernels, respectively (Chitanguta, Ray, & Banerjee, 2017; Tang, Zhao, Cristhian, and Jiang, 2011).
In the treatments with the addition of protease, the substrate concentration reached close to 0 g L-1 in 12h of fermentation, but the ethanol increased up to 24h reaching 35.5 (g L-1), concentration 115.15% greater than medium without protease and with a yield of 101.5%. Similar yield (101%) was obtained by Singh and Singh (2007) in production of pineapple wine. The yield greater than 100% and the production of ethanol even with low substrate concentration (between 12-24h fermentation) can be explained by the possibility of S. cerevisiae metabolizing reserve carbohydrates to produce ethanol through endogenous fermentation (Peppler, 1970). According Ferreira, Amorim, and Basso (1999), the formation of ethanol by endogenous fermentation by S. cerevisiae is an alternative for acquiring energy for its growth and development justifying yields superior to 100%.
The higher concentration of ethanol production from rice bran fermented with Zymomonas mobilis, according to Todhanakasem et al. (2014) was 1.34 ± 0.243% (72.47 ± 6.13% for theoretical ethanol yield). In the fermentation of the hydrolyzed of rice hull, Dagnino, Chamorro, Romano, Felissia, and Area (2013) related a production of 0.442% of bioethanol with an efficiency of 84% to the conversion. In this study, it was possible to obtain higher ethanol concentrations in comparison to the values reported in the literature and with a maximum conversion rate, showing that is possible to add value to the rice bran using it as main substrate in the bioethanol production.
Conclusion
This study shows the possibility to apply the defatted rice bran as a source of sugars for bioethanol production. In the optimization of the enzymatic hydrolysis of DRB employing 30 μL g-1 DRB of α-amylase and 40 μL g-1 DRB of AMG, at action times of 2 and 3h, respectively, it was to achieved 68 g L-1 of RS. For bioethanol production, this study showed that the protease addition had a significant effect on the final concentration of ethanol, resulting in 115.15% of increase in comparison of runs without protease, achieving a conversion yield of 101.5% in 24h of fermentation.
Acknowledgements
The authors would like to thank Araucaria Foundation, for their financial support.
References
Adams, M. R. (1985). Vinegar. In B. J. B. Wood (Ed.), Microbiology of fermented foods (p. 1-47). Glasgow, UK: Elsevier Applied Science Publishers.
Adolfo Lutz. (1985). Chemical and Physical Methods for Food Analysis. Analytical standards of the Institute Adolfo Lutz (p. 530-549), São Paulo, SP: Adolfo Lutz.
Aguiar, A., Nascimento, A. A. R., Ferretti, P. L., & Gonçalves, R. A. (2005). Determination of Organic Acids and Ethanol in Commercial Vinegars. Brazilian Journal of Food Technology, 5(1), 51-56.
Alexandre, H., Rousseaux, I., & Charpentier, C. (1994). Ethanol adaptation mechanisms in Saccharomyces cerevisiae. Biotechnology and Applied Biochemistry, 20(2), 173-183.
Amissah, N. G. J., Ellis, O. W., Oduro, I., & Manful, T. J. (2003). Nutrient composition of bran from new rice varieties under study in Ghana. Food Control, 24(1), 21-24. doi: 10.1016/S0956-7135(02)00047-6
Bamforth, C. W. (2005). The science underpinning food fermentations. In C. W. Bamforth (Ed.), Food, Fermentations and Microorganisms. Iowa, USA: Blackwell Science.
Bhatnagar, A. S., Prabhakar, D. S., Prasanth, K., Rajan, R. G., & Gopala Krishna, A. G. (2014). Processing of commercial rice bran of the production of fat and nutraceutical rich rice brokens, rice germ and pure bran. LWT – Food Science and Technology, 58(1), 306-311.
Buckow, R., Weiss, U., Heinz, V., & Knorr, D. (2007). Stability and catalytic activity of alpha-amylase from barley malt at different pressure–temperature conditions. Biotechnology and Bioengineering, 97(1), 1-11.
Chen, C., & Chen, F. (2009). Study on the conditions to brew rice vinegar with high content of g-amino butyric acid by response surface methodology. Food and Bioproducts Processing – Journal, 87(4), 334-340. doi: 10.1016/j.fbp.2009.03.003
Chitanguta, A. D., Ray, S., & Banerjee, R. (2017). An integrated bioprocess for bioethanol and biomanure production from pineapple leaf waste. Journal of Cleaner Production, 165(1), 1508-1516. doi: 10.1016/j.jclepro. 2017.07. 179.
Dagnino, E. P., Chamorro, E. R., Romano, S. D., Felissia, F. E., & Area, M. C. (2013). Optimization of the acid pretreatment of rice hulls to obtain fermentable sugars for bioethanol production. Industrial Crops and Products, 42(1), 363-368. doi: 10.1016/j.indcrop.2012.06.019
Devi, E. S., Vijayendra, S. V. N., & Shamala, T. R. (2012). Exploration of rice bran, an agro-industry residue, for the production of intra- and extra-cellular polymers by Sinorhizobium meliloti MTCC 100. Biocatalasys and Agricultural Biotechnology, 1(1), 80-84.
Fabian, C. B., Huynh, L. H., & Ju, Y. H. (2010). Precipitation of rice bran protein using carrageenan and alginate. LWT-Food Science and Technology, 43(2), 375-379.
Farone, W., & Cuzens, J. (1996). Method of producing sugars using strong acid hydrolysis of cellulosic and hemicellulosic materials (US Patent 5562777). Las Vegas, NE: United State Patents,
Ferreira, L. V., Amorim, H. V., & Basso, L. C. (1999). Fermentation of endogenous trehalose and glycogen by Saccharomyces cerevisiae. Food Science and Technology, 19(10), 29-32.
Haaland, P. D. (1989). Experimental design in biotechnology. New York, USA: Marc. Dek. Inc.
Jieun, L., Seo, E., Kweon, D., Park, K., & Jin, Y. (2009). Fermentation of rice bran and defatted rice bran for butanol production using Clostridium beijerinckii. Journal Microbiology and Biotechnology, 19(5), 482-490.
Kahlon, S. T. (2009). Rice Bran: Production, Composition, Functionality and Food Applications, Psysiological Benefits. In S. S. Cho, & P. Samuel (Ed.), Fiber ingredients: food applications and health benefits (p. 305-307). New York, NY: CRC Press, Taylor & Francis Group.
Kim, K., & Hamdy, M. K. (1985). Acid hydrolysis of sweet-potato for ethanol production. Biotechnology and Bioengineering, 27(3), 316-320.
Klosowski, G., Mikulski, D., Czuprynski, B., & Kotarska, K. (2010). Characterization of fermentation of high-gravity maize mashes with the application of pullulanase, proteolytic enzymes and enzymes degrading non-starch polysaccharides. Journal of Bioscience and Bioengineering, 5(109), 466-471.
Lévêque, E., Janečekc, S., Haye, B., & Belarbi, A. (2000). Thermophilic archael amylolitic enzymes. Enzyme and Microbial Technology, 26(1), 3-14. doi: 10.1016/S0141-0229(99)00142-8
Loypimai, P., Moonggarm, A., & Chottanom, P. (2009). Effects of ohmic heating on lipase activity, bioactive compounds and antioxidant activity of rice bran. Australian Journal of Basic and Applied Science, 3(4), 3642-3652.
Moongngarma, A., Daomukdaa, N., & Khumpika, S. (2012). Chemical Compositions, Phytochemicals, and Antioxidant Capacity of Rice Bran, Rice Bran Layer, and Rice Germ. International Conference Biotechnology Food Science, 2(1), 73-79.
National Company of Supplying [NCS]. (2016). Year: XXV, nº 6 June. Retrieved from www.conab.gov.br/OlalaCMS/uploads/arquivos/16_10_21_15_32_09_safra_outubro.pdf
Nelson, N. (1944). A photometric adaptation of the Somogyi method for the determination of glucose. Journal of Biological Chemistry, 153(2), 375-380.
Oh, Y. H., Lee, S. H., Jang, Y. A., Choi, J. W., Hong, K. S., Yu, J. H., … Park, S. J. (2015). Development of rice bran treatment process and its use for the synthesis of polyhydroxyalkanoates from rice bran hydrolysate solution. Bioresource Technology, 181(1), 283-290. doi: 10.1016/j.biortech.2015.01.075
Palmarola-Adrados, B., Chotěborská, P., Galbe, M., & Zacchi, G. (2005). Ethanol production from non-starch carbohydrates of wheat bran. Bioresource Technology, 96(7), 843-850.
Peppler, H. J. (1970). Food Yeasts. In A. H., Rose (Ed.), The yeasts (p. 421-463). London, CA: Academic Press.
Schramm, R., Abadie, A., Hua, N., Xu, Z., & Lima M. (2007). Fractionation of the rice bran layer and quantification of vitamin E, oryzanol, protein, and rice bran saccharide. Journal of Biological Engineering, 1(9), 1-9. doi: 10.1186/1754-1611-1-9
Shirakawa, H., Koseki, T., Ohinata, K., Hazhizume, K., & Komai, M. (2006). Rice bran fractions improve blood pressure, lipid profile, and glucose metabolism in stroke-prone spontaneously hypertensive rats. Journal of Agricultural and Food Chemistry, 54(5), 1914-1920.
Singh, R., & Singh, S. (2007). Design and development of batch type acetifier for wine-vinegar production. Indian Journal of Microbiology, 47(2), 153-159.
Somogyi, M. A. A. (1945). New Reagent for the Determination of Sugars. Journal of Biological Chemistry, 160(1), 61-68.
Srivastava, T., & Chosdol, K. (2007). Clinical Enzymology and its Applications. Clinical Biochemistry, 1(1), 1-28
Suvd, D., Fujimoto, Z., Takase, K., Matsumura, M., & Hiroshi, M. Crystal structure of bacillus stearothermophilus a-amylase: possible factors determining the thermostability. (2001). The journal of Biochemistry, 129(3), 461-468.
Tang, Y., Zhao, D., Cristhian, C., & Jiang, J. (2011). Simultaneous saccharification and cofermentation of lignocellulosic residues from commercial furfural production and cornkernels using different nutrient media. Biotechnology for Biofuels, 4(1), 1-10.
Todhanakasem, T., Sangsutthiseree, A., Areerat, K., Young, G. M., & Thanonkeo, P. (2014). Biofilm production by Zymomonas mobilis enhances ethanol production and tolerance to toxic inhibitors from rice bran hydrolysate. New Biotechnology, 31(5), 451-459.
Zhang, H. J., Zhang, H., Wang, L., & Guo, X. N. (2012). Preparation and functional properties of rice bran proteins from heat-stabilized defatted rice bran. Food Research International 47(2), 359-363. doi: 10.1016/j. foodres.2011.08.014
Wang, W., Guo, J., Zhang, J., Peng, J., Liu, T., & Xin, Z. (2015). Isolation, identification and antioxidant activity of bound phenolic compounds present in rice bran. Food Chemistry, 171(15), 40-49. doi: 10.1016/j. foodchem.2014.08.095
Watanabe, M., Honda, H., Kashiwamura, T., Sasano, K., & Watanabe, K. (2007). Sedimentation and flocculating properties of solid particles in enzymatic treated rice washing drainage and its mechanism. Japan Journal of Food Engineering, 8(1), 165-172.
Watanabe, M., Takahashi, M., Sasano, K., Kashiwamura, T., Ozaki, Y., Tsuiki, T., … Kanemoto, S. (2009) Bioethanol production from rice washing drainage and rice bran. Note. Journal of Bioscience and Bioengineering, 108(6), 524-526.
Notes
Author notes
franbegnini@gmail.com