Geociências
Homogenous regions and rainfall probability models considering El Niño and La Niña in the State of Pará in the Amazon
Regiões homogêneas e densidade de probabilidade de precipitação considerando El Niño e La Niña no Estado do Pará – Amazônia
Homogenous regions and rainfall probability models considering El Niño and La Niña in the State of Pará in the Amazon
Acta Scientiarum. Technology, vol. 40, 2018
Universidade Estadual de Maringá

This work is licensed under Creative Commons Attribution 4.0 International.
Received: 19 June 2017
Accepted: 11 December 2017
Abstract: The determination of homogeneous regions with precipitation and probability models when considering the El Niño- Southern Oscillation (ENSO) phenomenon is important for the planning of water resources and for the study of how climate change affects precipitation regimes. Thus, six homogeneous regions with annual mean precipitation were determined through a cluster analysis using Ward's agglomeration method and applied to a historical series of 31 years (1960-1990) at 413 satellite monitoring points in the state of Pará, where the selected years occurred during an El Niño or a La Niña event. When adjusting the probability models, the chi-square test was applied to 413 monitoring points spread over the six homogeneous regions during years with a La Niña or an El Niño, as well as the complete set of years. The normal model (i.e., the normal function) had the best fit, with chi-square values below 3.84 (tabulated chi-square values). The model was validated using 12 rainfall stations of the National Water Agency (ANA), which were distributed across the six homogeneous regions. In this case, the chi-square test for the 12 stations also had values lower than 3.84. A good fit between the observed and the regionalized data demonstrated the potential of the methodology developed and used for estimating annual average precipitation probabilities.
Keywords: climate change, cluster analysis, average annual rainfall, Amazon.
Resumo: A determinação de regiões homogêneas de precipitação e de modelos de probabilidade, considerando os fenômenos Oscilação Sul- El Niño (OSEN), é interessante para o planejamento dos recursos hídricos e também para estudar como as mudanças climáticas estão atuando nos regimes de precipitação. Assim, foram determinadas seis regiões homogêneas de precipitação média anual por meio da análise de cluster, com a utilização do método aglomerativo de Ward, aplicada a uma série histórica de 31 anos (1960-1990) em 413 pontos de monitoramento, via satélite, no Estado do Pará, selecionados os anos com ocorrência de El Niño e La Niña. No ajuste dos modelos de probabilidade, o teste Qui-quadrado foi aplicado aos 413 pontos de monitoramento espalhados pelas seis regiões homogêneas em função dos anos com ocorrência de La Niña, El Niño e série completa. O modelo Normal (função Normal) teve o melhor ajuste com valores de Qui-quadrado abaixo 3,84 (Qui-quadrado tabelado). O modelo foi validado, utilizando-se 12 estações pluviométricas da Agência Nacional de Águas (ANA), as quais foram distribuídas nas seis regiões homogêneas. Neste caso, o teste Qui-quadrado para as 12 estações também apresentaram valores menores que 3,84. O bom ajuste entre os dados observados e regionalizados demonstra o potencial da metodologia desenvolvida para estimativas de probabilidade de ocorrência de precipitações médias anuais.
Palavras-chave: alterações climáticas, análise de cluster, precipitação média anual, Amazônia.
Introduction
The determination of homogeneous regions and probability densities of rainfall under the influence of El Niño and La Niña is important to support water resource planning in the context of climate change. For example, the probability density of rainfall and its variation in relation to El Niño and La Niña are important for agricultural planning in a region. El Niño and La Niña are considered the main sources of climate changes, which produce moderate to intense droughts and flooding in the Amazon. In this region, there is a shortage of studies regarding the influence of El Niño and La Niña on the rainfall regime due to the lack of data monitoring. This problem is partly due to the large size of the region, which increases the costs of beginning and operating a network, as well as the costs and logistics of the transport of technical teams that are responsible for measurements and the collection of data to analyze the behavior of rainfall and water flow, which are crucial for hydrological studies. One alternative to this problem is to develop models for estimating rainfall in regions without rainfall gauge stations.
In hydrology, the term homogenous is used to describe regions that have hydrological similarities. These similarities include physical, climatic, biological and geological factors, as well as human actions and effects. The definition of homogenous is considered to be the stage of regionalization with the greatest degree of difficulty because it often requires subjective judgment. Among the methods that have been advocated for determining homogeneity, one that has given notable results is the cluster analysis method (Lyra, Garcia, Piedade, Sediyama, & Sentelhas, 2006; Yang, et al., 2010; Lyra, Oliveira-Júnior, & Zeri, 2014), which has also been analyzed and used in this study.
For example, Lyra et al. (2006) defined homogenous regions based on the seasonality of monthly rainfall precipitation in the state of Táchira, Venezuela. The utilized data were monthly precipitation values from 25 climatological stations for a period from 24 to 62 years. The Ward method (Ward, 1963) was applied to a cluster of months with similar monthly precipitation values, resulting in 7 homogenous regions for the state. Modarres (2006) studied regional rainfall in Iran using a cluster analysis with the Ward method, as well as Euclidean distance as a measure of similarity, to determine climatically homogenous regions, which resulted in eight regions for the country. Raju and Kumar (2007) applied a cluster analysis (fuzzy cluster analysis - FCA) and Kohonen artificial neural networks (KANNs). These methods were used to classify 159 meteorological stations in homogenous regions in India. Eight parameters were considered when classifying regions: latitude, longitude, altitude, average temperature, humidity, wind velocity, hours of sunlight and solar radiation. Based on the Davies-Bouldin index, which is determined by the ratio between the internal dispersion of the clusters and the distance between the clusters, 14 homogenous regions were formed. The FCA approach had a better performance in relation to artificial neural networks. Gaál, Szolgay, Lapin, and Fasko (2009) used a regional frequency analysis method for precipitation based on the estimation of parameters for a regional distribution function using L-moments to define homogenous regions. The authors used a hybrid cluster technique, with a subjective analysis of precipitation data from rainfall stations (based on physical and geomorphological characteristics), which were combined with an objective analysis (i.e., cluster analysis) using statistical tools to define homogenous regions. Yang et al. (2010) used a cluster analysis to determine four variables from the 42 selected rainfall stations to describe the rainfall regime in the region: latitude, longitude, altitude and average annual rainfall. Bravo et al. (2012) used the annual average of daily precipitation to group climatological stations into clusters using the k-means procedure and a principal component analysis with varimax rotation. The authors identified two clusters that occupied northwestern and north-central Mexico, as well as another cluster at the center of the territory. The groups were compared against the results of previous studies, indicating that regions are invariant over time and space and independent of the method used for aggregation and the sampling of stations. Lyra et al. (2014) identified spatial and temporal rainfall patterns for the northeastern Brazilian state of Alagoas using a cluster analysis and related those patterns with weather systems that occur over that region. The authors concluded that rainfall was not uniformly distributed over space and time in all regions; the two groups within the arid zone, where more than 60% of the annual precipitation occurred in a period of 5 months (i.e., March to July), is an example.
Thus, the objective of this paper is to contribute to defining homogenous regions of rainfall and estimating the probability density of average annual rainfall in the Amazon (more specifically in the state of Pará) by considering El Niño and La Niña climate anomalies to support water resource planning in the context of climate change. For example, the probability density of rainfall and its variation in relation to El Niño and La Niña are important for agricultural planning in certain regions. Moreover, as explained by Silva Dias (2006) and Sanches, Verdum, and Fisch (2013), the analysis of historical series of temperature and precipitation in some regions of the world may indicate that a change in climate is occurring. Mendonça (2006) also explains that variations in the components of the hydrological cycle (e.g., precipitation and evapotranspiration) will affect the distribution of water on the planet in a differentiated manner, leading certain regions to receive increased volumes of water and, therefore, intensifying the occurrence of torrential rainfall, flooding, landslides, mass movements and erosion processes.
Material and methods
For this paper, the studied area is the state of Pará, which is located in the north region of Brazil and part of the Amazon. Almost all of this area is a humid tropical forest, except for parts where there are grassland formations (i.e., the lower Trombetas River region and the Marajó archipelago) (Figure 1).
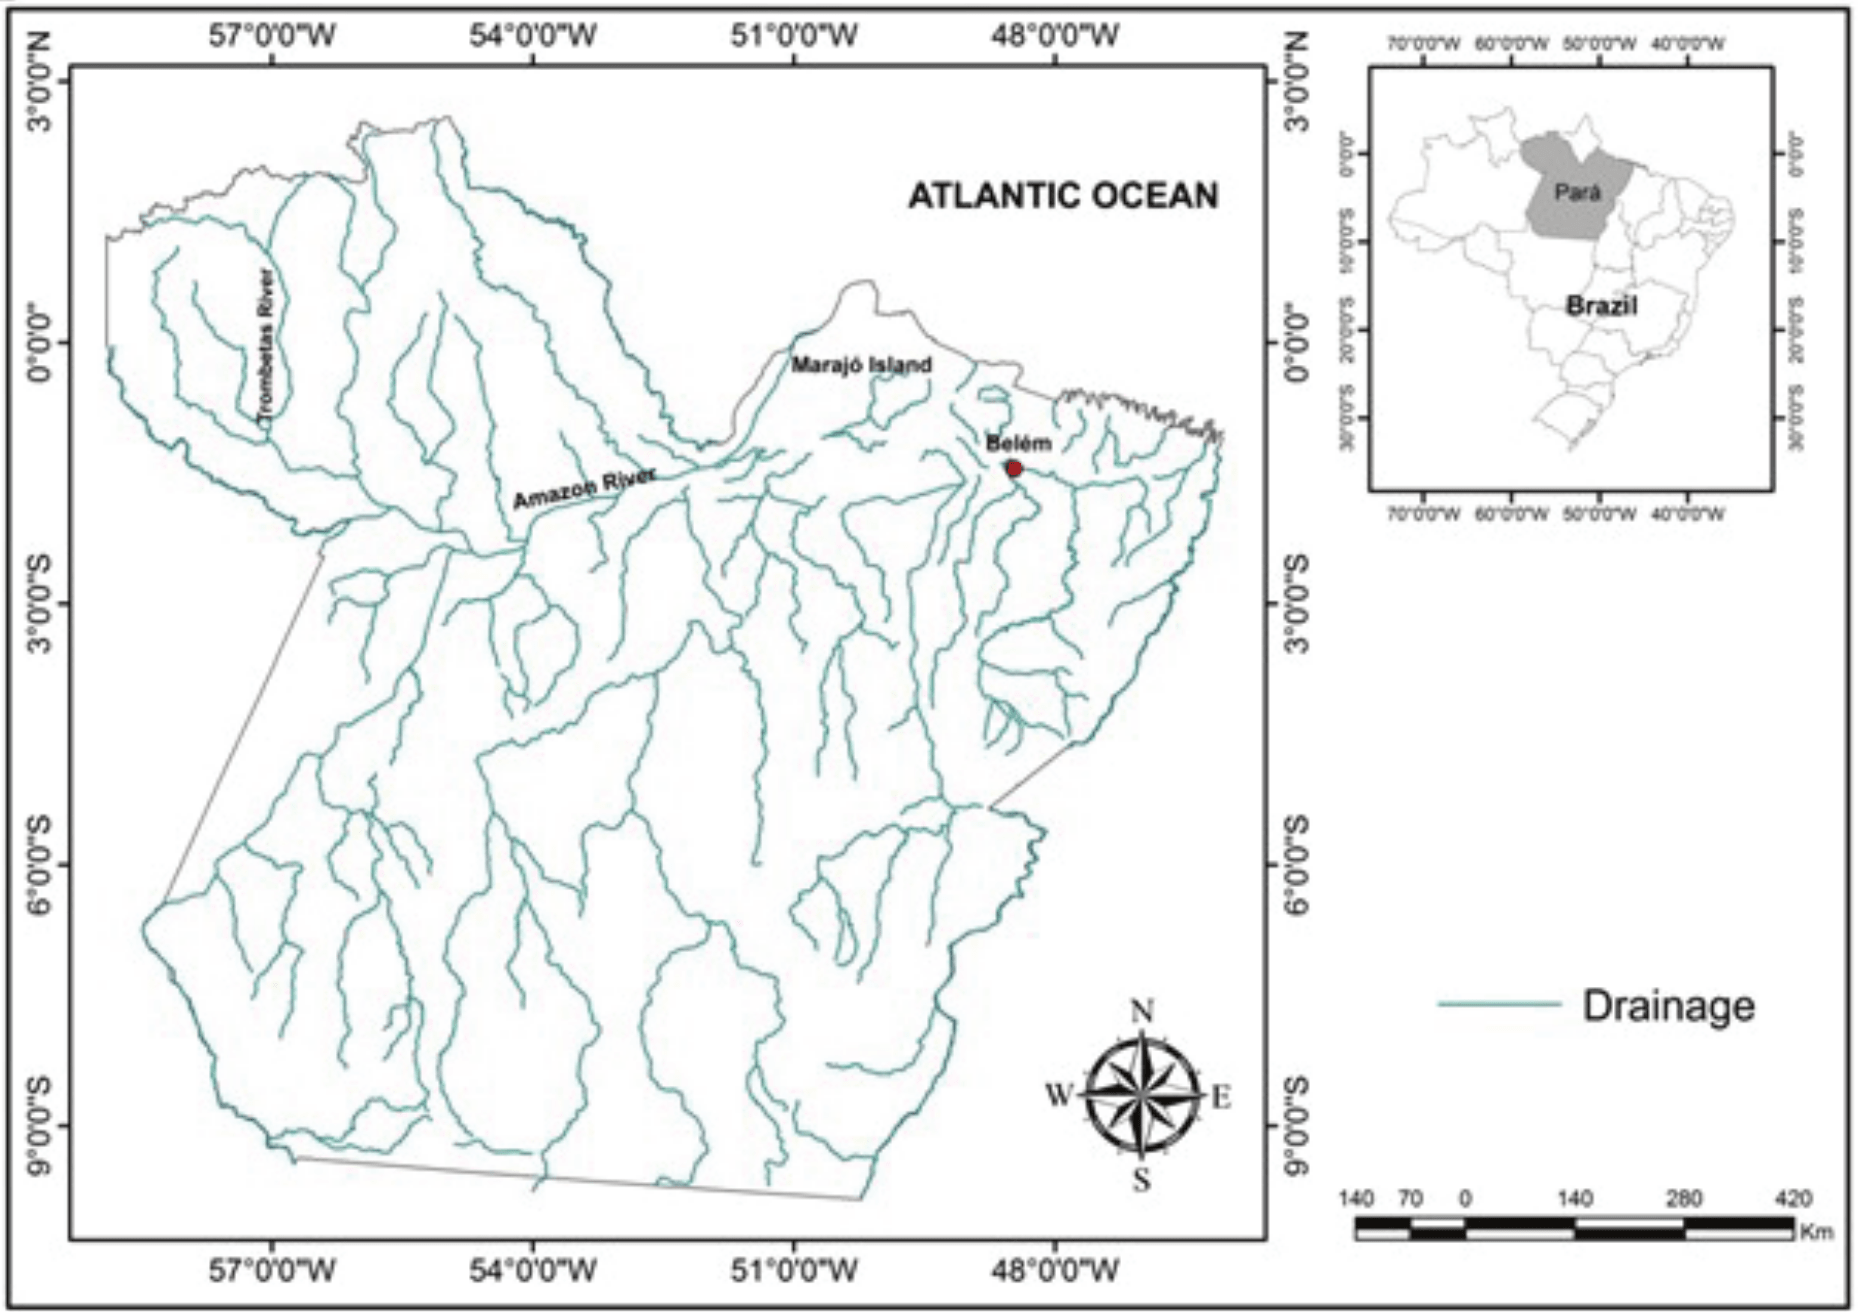
Figure 1.
Geographic location of the state of Pará.
Raw data containing the geographic location and average monthly rainfall for the points studied were obtained from the Climate Research Center at the University of Delaware-Newark, USA (http://climate.geog.udel.edu/~climate/html_pages/sa_ts_P.html). The data of average monthly rainfall from 413 sampling points were used in the state of Pará for a 31-year historical series (1960-1990). The 413 points were the result of a 0.5 by 0.5° grid (latitude and longitude), where the average monthly precipitation for each point was interpolated through a spherical version of the Shepard algorithm (Webber and Willmott, 1998). In this case, the average number of neighboring stations that influence each estimate was twenty. The years were selected from 1960 to 1990, when El Niño (19 years) and La Niña (13 years) events occurred. In some years, the occurrence of both, the El Niño and La Niña phenomenon was observed (years where both phenomena occurred: 1965, 1970, 1973, 1976, 1983 and 1988). Information was supplied from the site for the National Institute of Space Research (INPE) in Brazil (http://enos.cptec.inpe.br). Altitudes (Figure 2) were obtained from Gonçalves, Blanco, Santos, and Oliveira (2016).
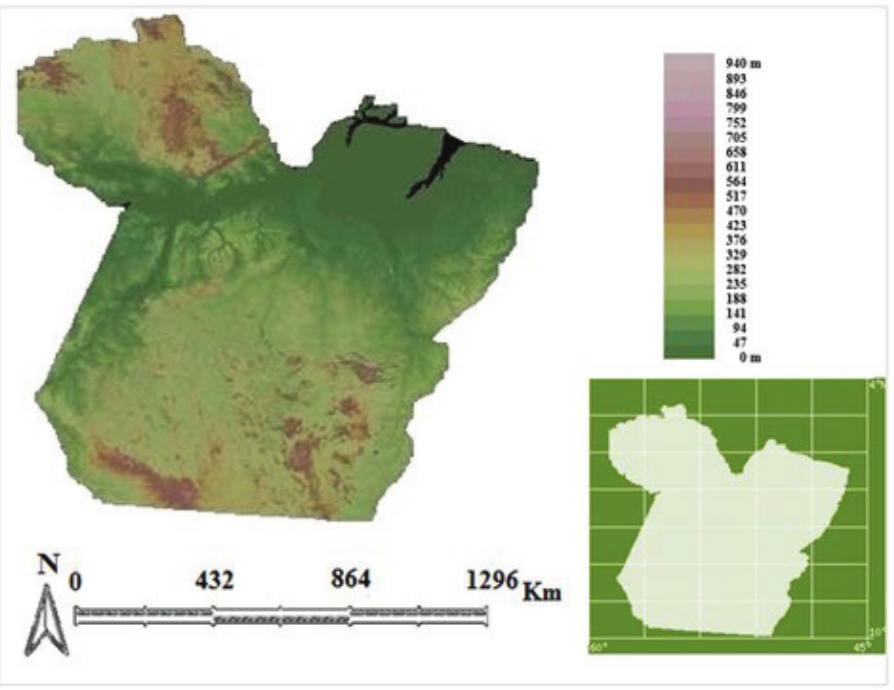
Figure 2.
Terrain in the state of Pará.
Source: Gonçalves et al. (2016).
To divide the state of Pará into homogenous regions, the cluster analysis was used, with the main objective of grouping individuals (i.e., variables) based on their characteristics. Thus, four variables were selected: longitude, latitude, altitude and precipitation. However, before carrying out the cluster analysis, it was necessary to standardize those variables because they did not have the same unit of measurement. Standardization was performed so that the variables contributed equally to similarities between individuals. To measure the similarity between the groups, the Euclidian distance was used, which is a common measure when grouping data. Thus, the Ward clustering method was used. It is a hierarchical method that forms groups to always achieve the smallest internal error between the vectors that comprise each group and the average vector of the group. This method is equivalent to seeking the lowest standard deviation between the data for each group. Further details of Ward's method can be found in Gonçalves et al. 2016.
Based on Sharma (1996) and Gnanadesikan (1997), the grouping process can be synthesized in five stages. The first is the choice of the dissimilarity measure, which in this case was Euclidean distance. The following step is the choice of grouping method (i.e., hierarchical or non-hierarchical), which in this case was the hierarchical method. The third step is the choice of grouping type for the method chosen, which was Ward's method, followed by the selection of the number of groups, which is a subjective choice as it varies with the value of the distance of dissimilarity. In our work, the number of groups was determined by transverse cuts in dendrograms based on the mathematical criterion for inertia (i.e., the distance between regions). The criterion was the condition where the number (N) of regions formed resulted in the greatest change in inertia in relation to the preceding n+1. The level of cutting in dendrograms was based on a sensitivity analysis, where the highest level of similarity was observed; finally, the resultant grouping could be interpreted.
Thus, a cluster analysis for annual average rainfall was applied to the entire historical series (1960-1990) and to a subset of the historical series (i.e., the occurrence of El Niño and La Niña). After determining the number of groups that developed with their respective data (i.e., longitude, latitude and value for precipitation), a map of homogenous regions in the state of Pará was obtained. When studying rainfall, some probability distribution models have been used to estimate the probability of the occurrence of precipitation at a given frequency (i.e., daily, monthly, and yearly), as well as to verify the behavior and variability of rainfall. These models are used to quantify the probability of occurrence (%) for a certain amount of rain, which contributes to the planning and management of water resources in flood control and irrigation projects. The probability distribution models that were used in this study were the Gumbel, normal and exponential models, which are were extensively analyzed in the classic hydrology literature. Figure 3 summarizes the methodology deeloped.
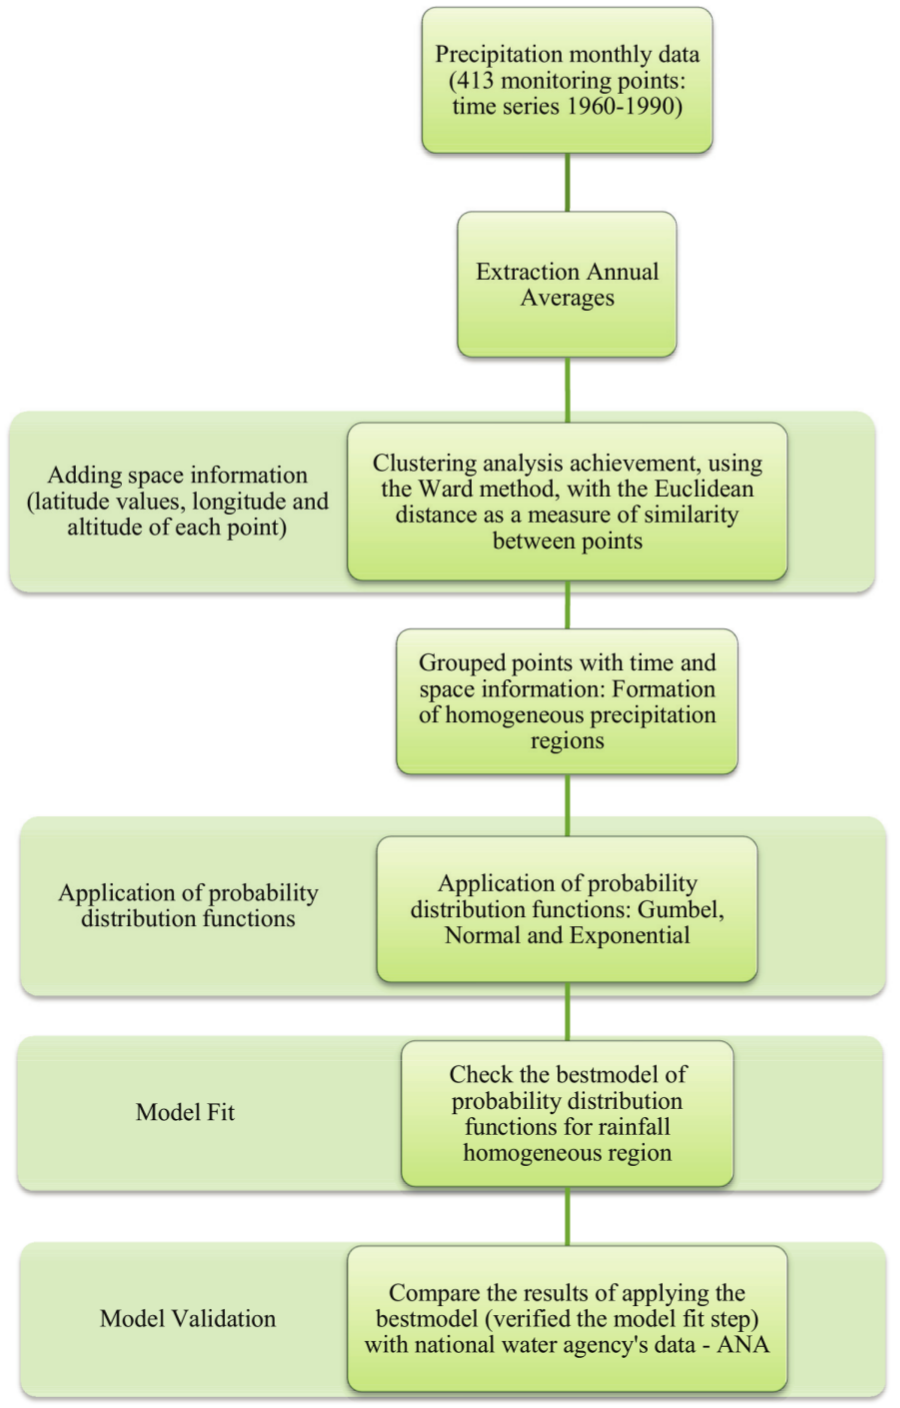
Figure 3.
Scheme of the methodological process adopted.
Results and discussion
Figure 4 shows the results of the clustering in relation to precipitation in the state of Pará (Gonçalves et al., 2016) and the location of the rain gauge stations used for validation of the probability models. Southwest regions and a small region in the northeast have lower precipitation values for all of the cases (i.e., the complete series, El Niño and La Niña), as represented by region A, with minimum values varying from 1,615 mm year-1 for El Niño (Figure 4b) to 1,650 mm year-1 for La Niña (Figure 4c). The minimum value for the complete sample (Figure 4a) is 1,625 mm year-1. The northeast had higher values, with maximum rainfall for La Niña equal to 3,400 mm year-1.
The probability models were fitted for the determination of homogenous regions. The chi-square test (X²) was used to evaluate the adjustment of the probability density as calculated by the Gumbel, normal and exponential functions for annual average precipitation. For the application of the chi-square test, the number of degrees of freedom for the exponential and normal model was set equal to one, and the Gumbel model was set equal to two. Thus, given a significance level of 5%, the tabulated values of the X² test were 3.84 for normal and exponential functions and 5.99 for the Gumbel function. Table 1 shows the result of the chi-square test application to evaluate the adjustment of homogeneous precipitation regions A through F (i.e., series containing all years) to determine precipitation average annual values. In Table 1, all of the regions showed a good consistency with the normal probability model, and the calculated values of X² were lower than 3.84 (tabulated X²).
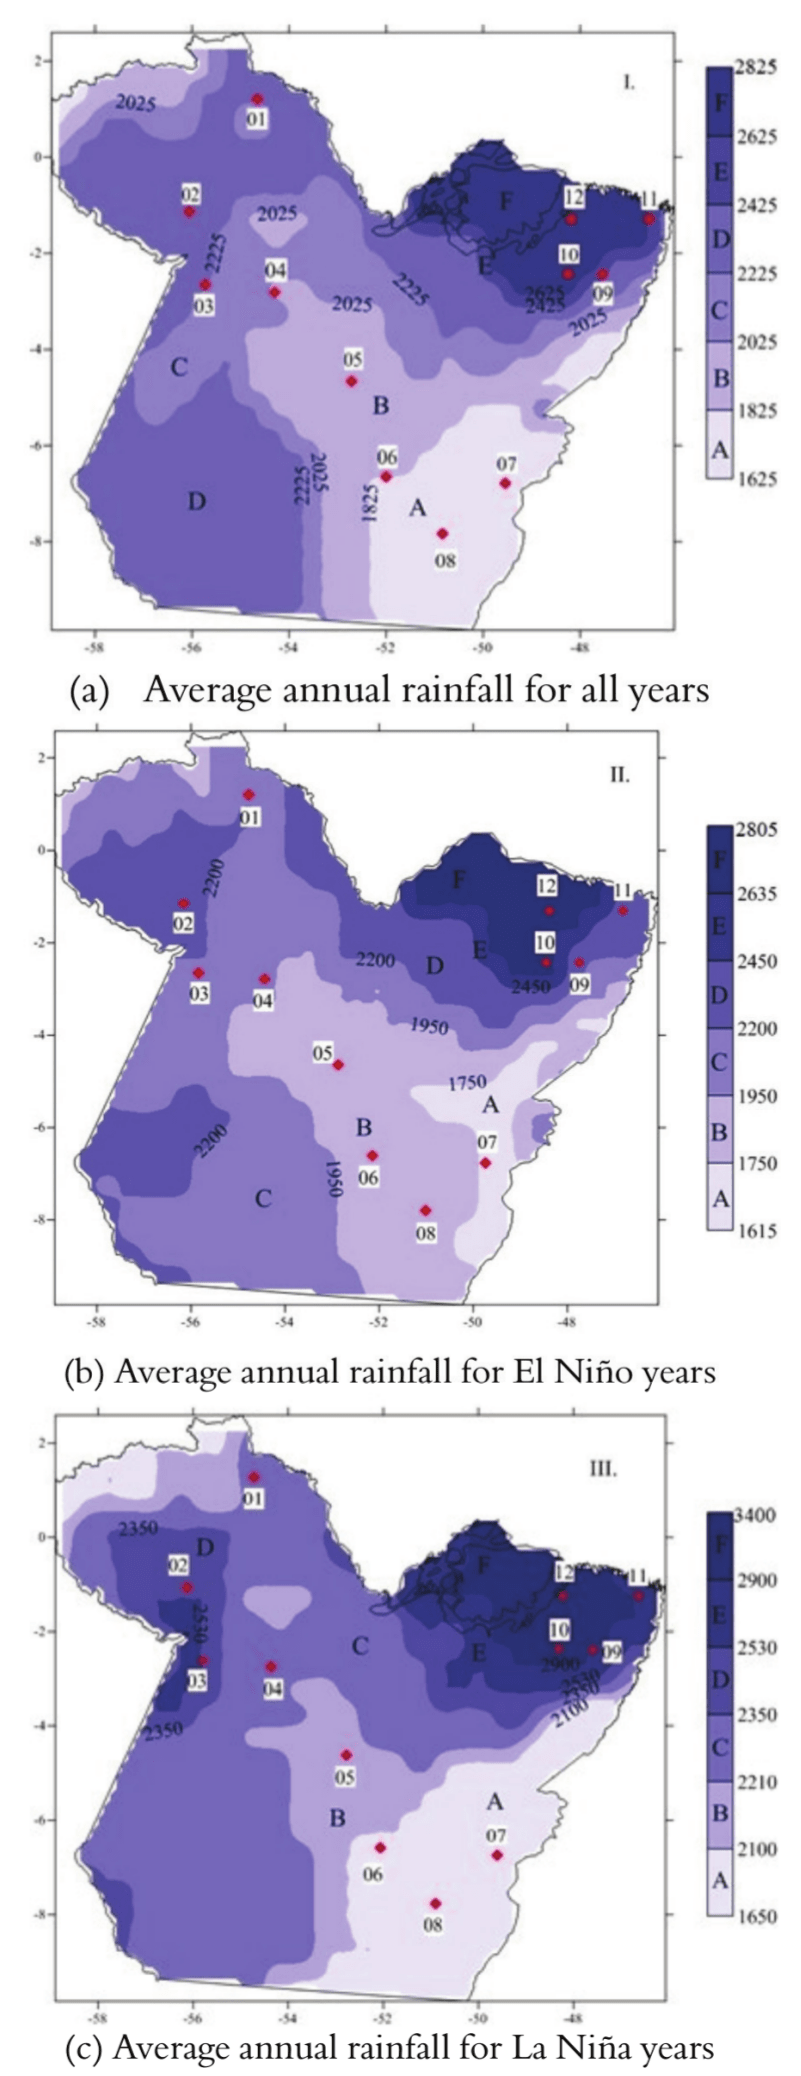
Figure 4.
Homogenous rainfall regions in the state of Pará, with precipitation isosurfaces in millimeters and the location of rain gauge stations for model validation
According to Table 1 and the literature (Amin, Rizwan, & Alazba, 2016), average annual precipitation values and average monthly precipitation are best simulated with the normal distribution function. Figure 5 shows the frequencies of exceeding the annual average rainfall, which was observed and estimated for the three sequences of analyzed data (i.e., for every year, during El Niño years and during La Niña years); the figure graphically shows the best-fit normal function for the observed frequencies, (except for region C and El Niño years).
For validation, 12 rainfall stations were used and treated as target stations (Table 2), which were distributed according to the homogeneous regions that were obtained by the cluster analysis (Figure 4). These stations have more recent rainfall data than those that were used for regionalization. Further validation is important because the regionalization and fit of the probability model derives from estimated satellite data. The normal distribution function was best fit in relation to precipitation and is used for validation.
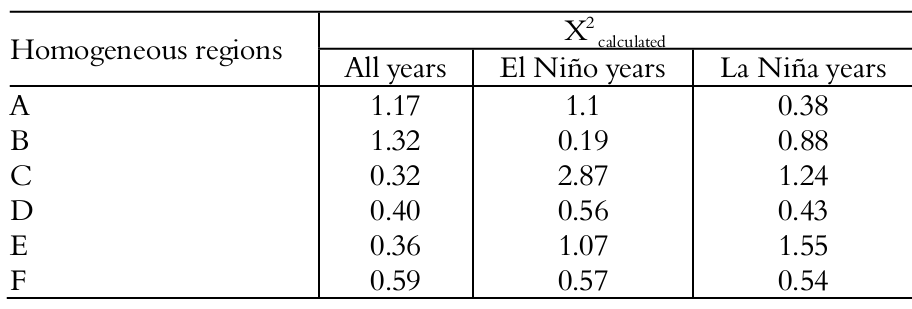
Figure 6 graphically shows the fit between the observed and the simulated exceedance frequency curves, and Table 3 shows the results of the normal probability model and the calculated values of X². It is observed that for some cases, the model does not estimate the frequencies of the exceedance of rainfall well. A plausible explanation for this result is the low data density that is observed during El Niño and La Niña events. When considering all of the year only in region A, station Fazenda Cumarú do Norte does not have much data availability, and the normal model is less representative of average annual rainfall. For this same station, it is impossible to apply the methodology for validation during El Niño years because the time series is comprised of only two years of occurrence (missing in Figure 6). This result demonstrates the lack of monitoring of hydrological data in the Amazon, which stimulates studies such as this one.
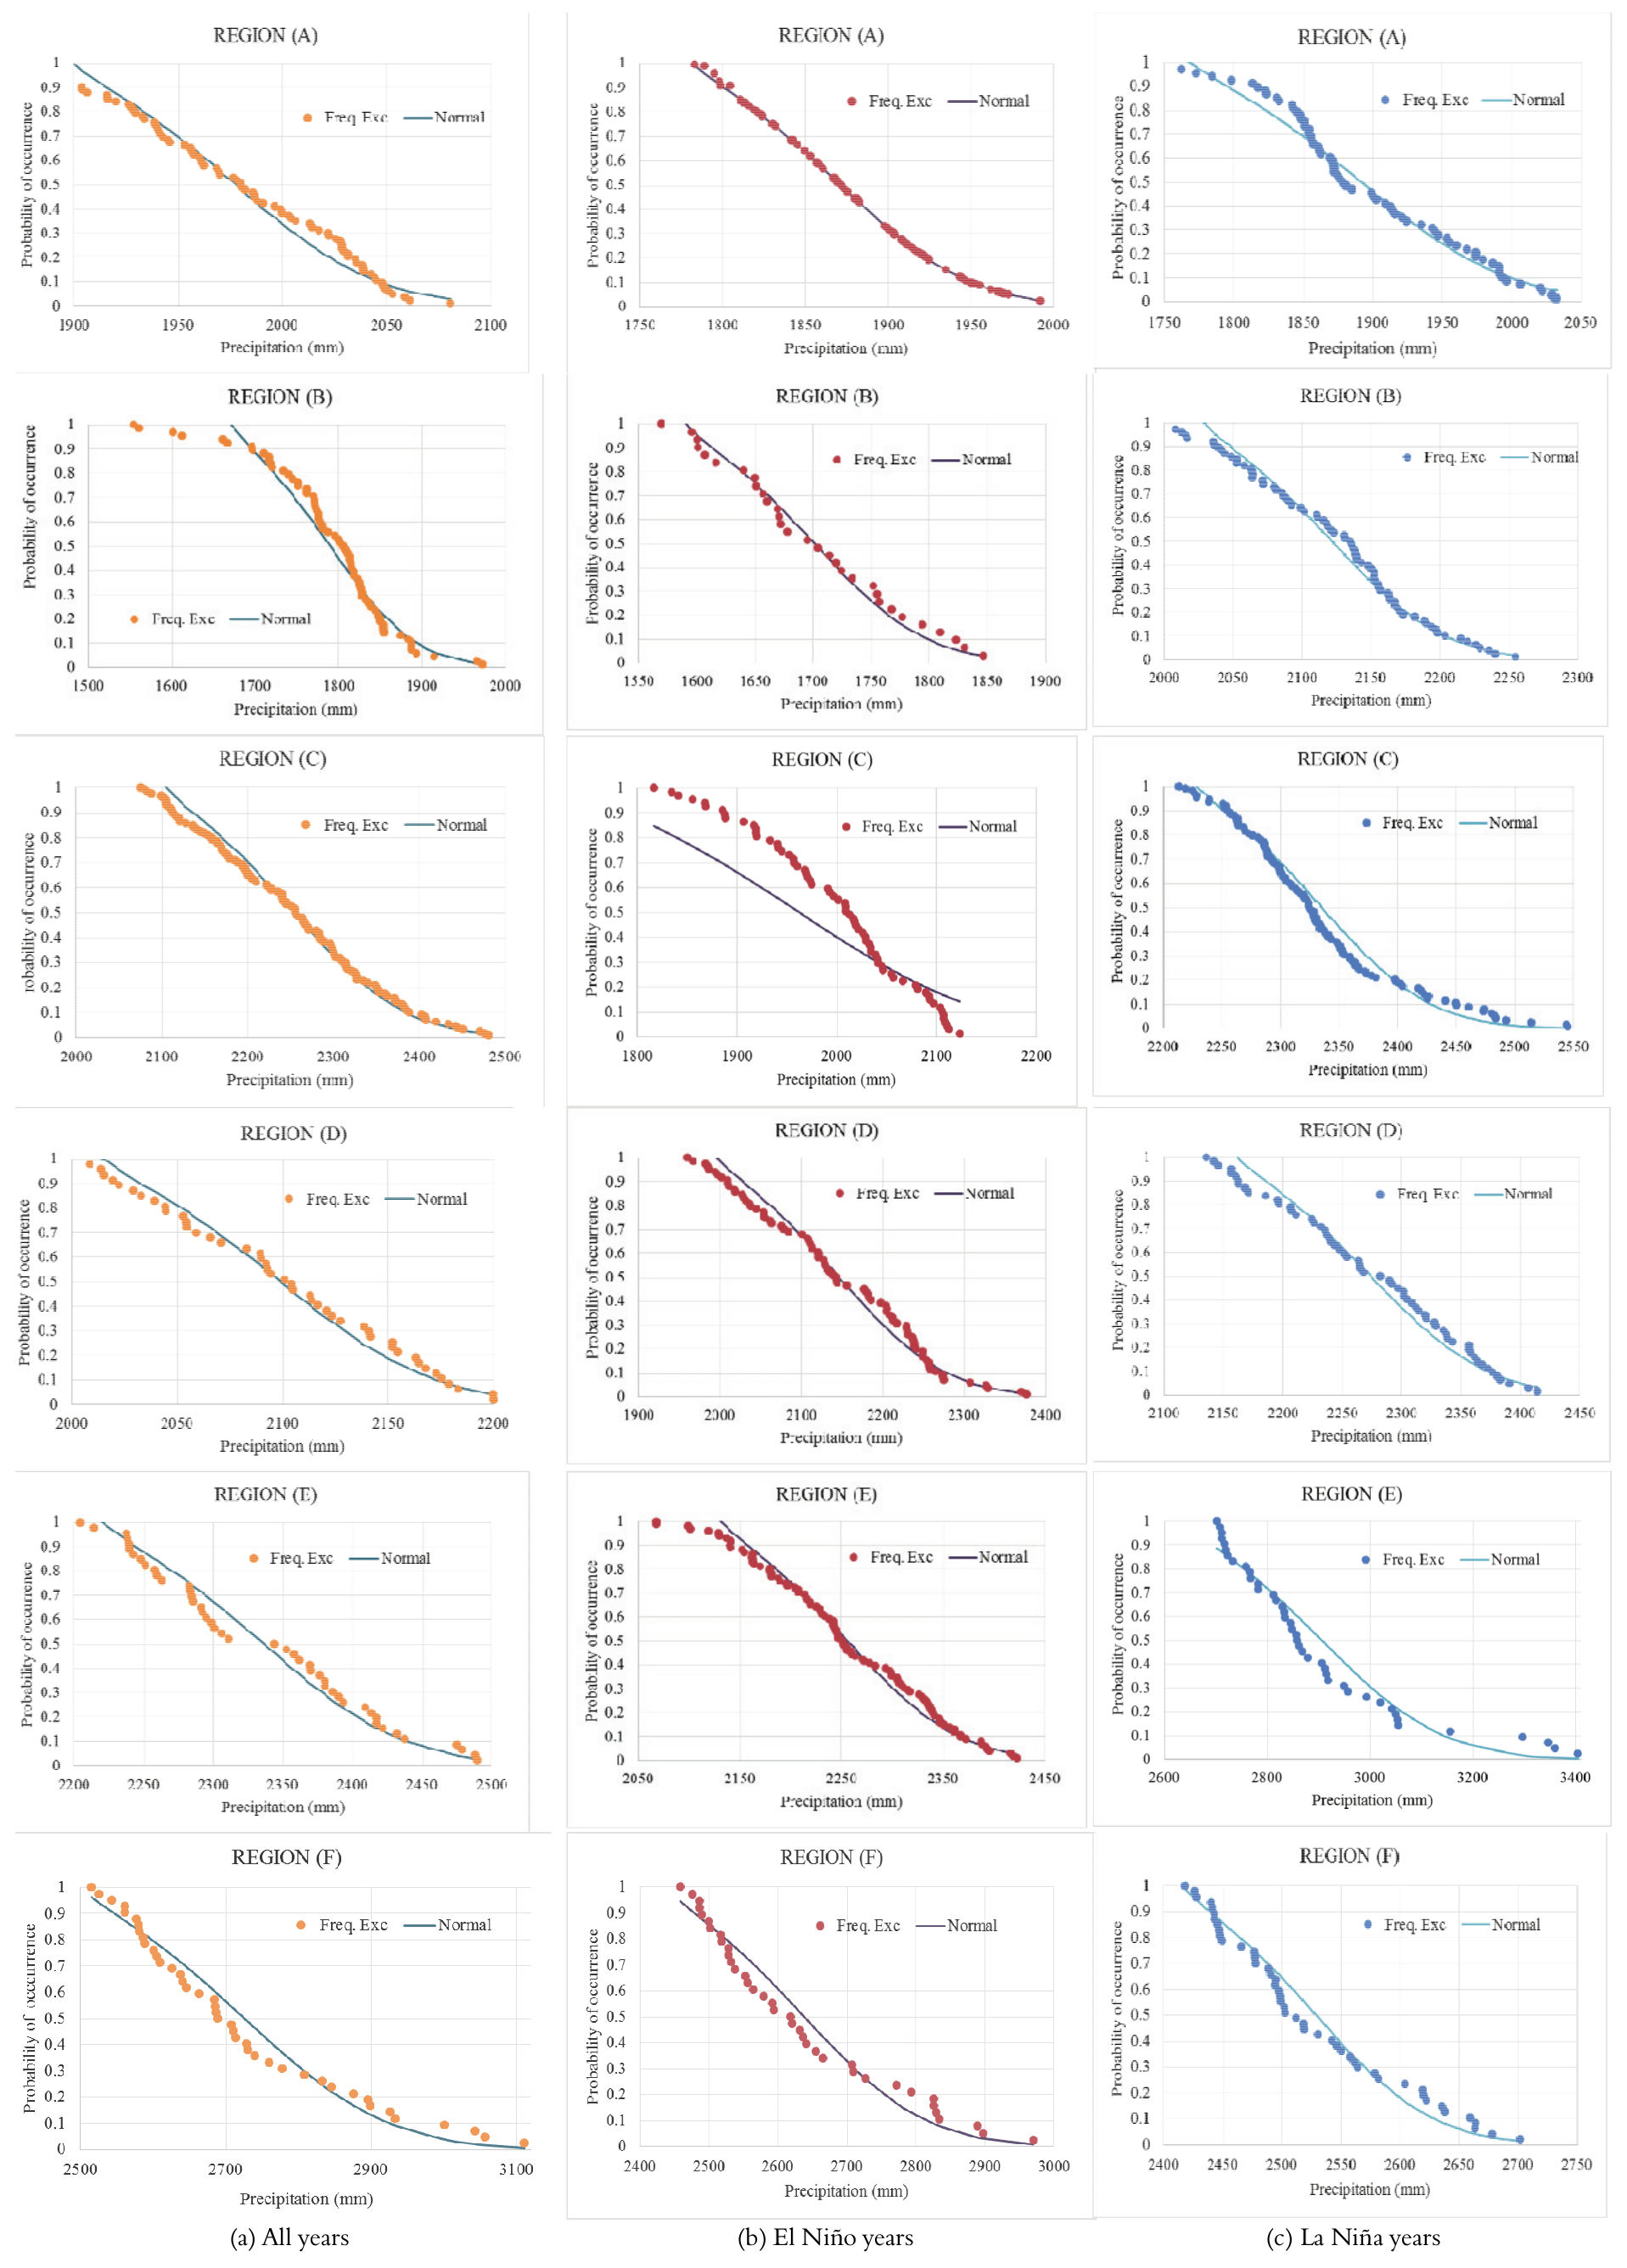
Figure 5.
Observed exceedance frequencies and the normal probability model of homogeneous regions for the complete series, El Niño years and La Niña years (model fit).
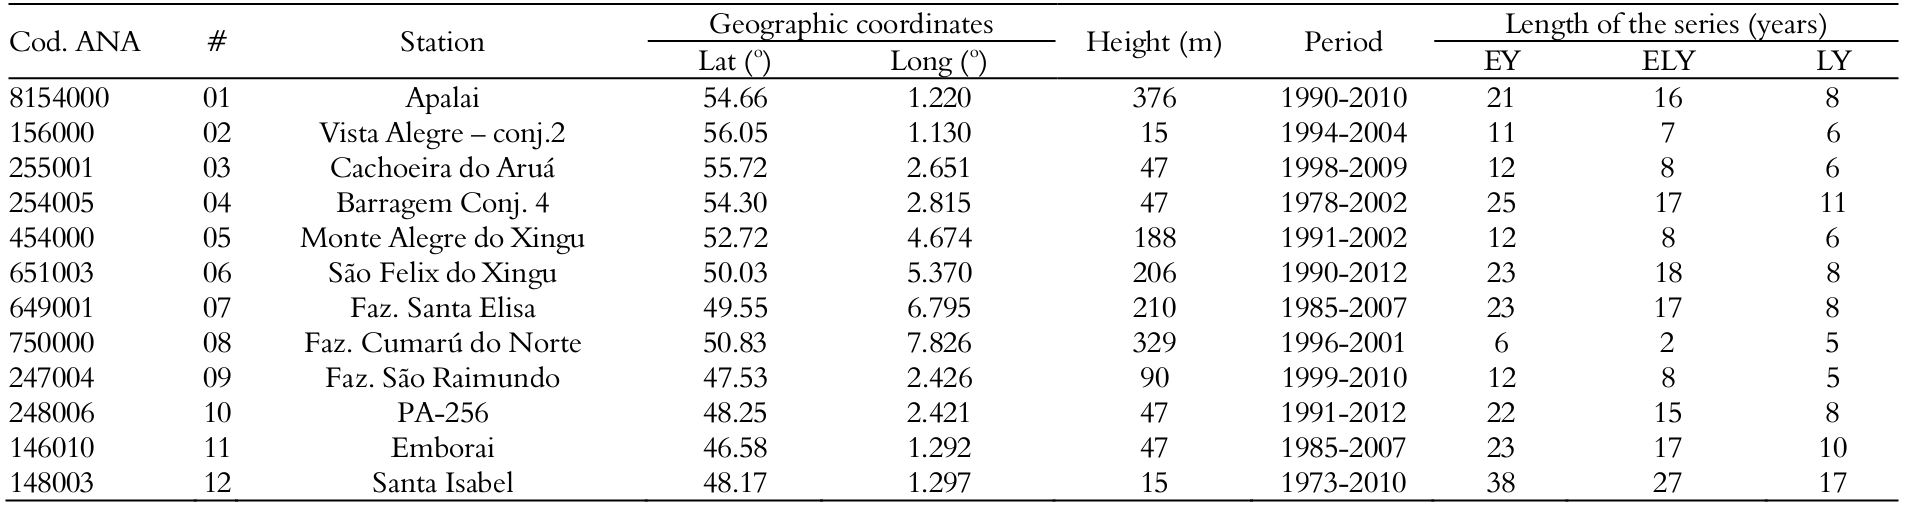
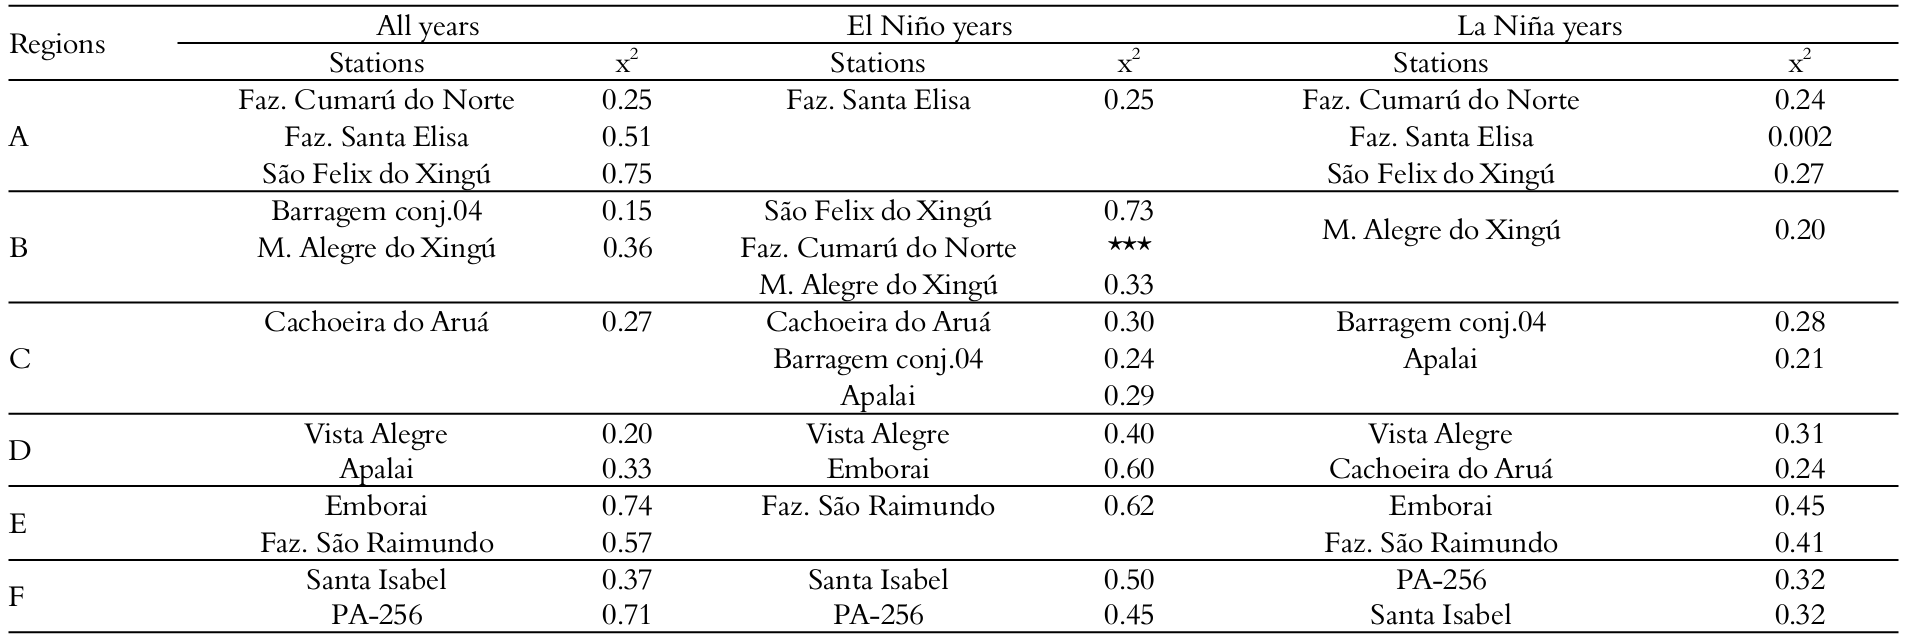
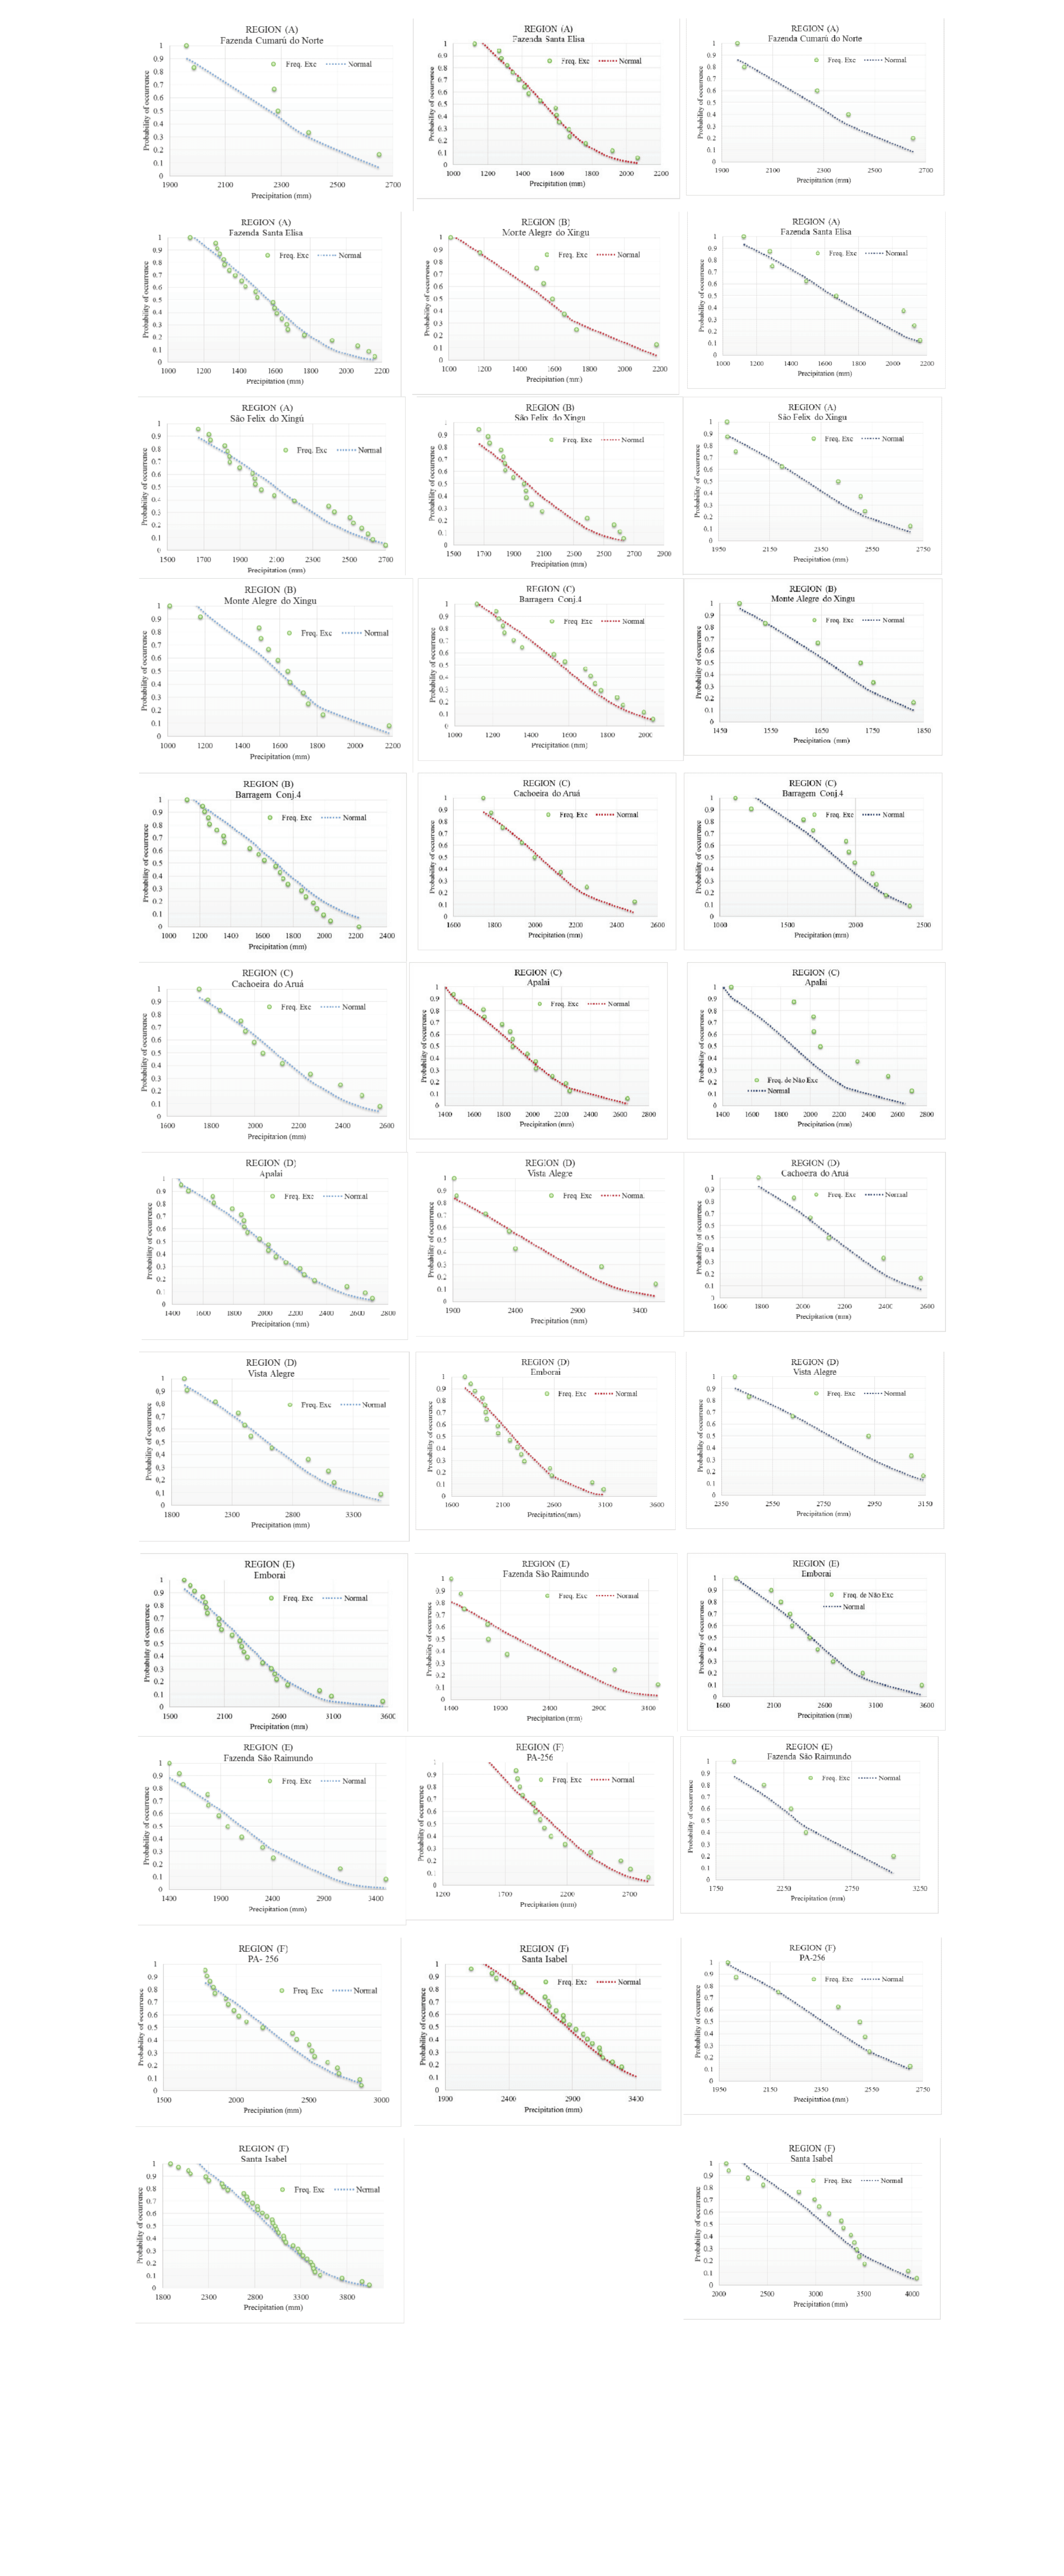
Figure 6.
Observed exceedance frequencies and normal probability model validation of homogeneous regions for the complete series, El Niño years and La Niña years.
Conclusion
The Ward method was effective in the spatial representation of six homogeneous regions when considering annual mean precipitation during El Niño and La Niña years, as well as the complete dataset, in the state of Pará. The methodology was important for the determination of homogeneous regions and evaluation of the occurrence probability of rainfall during El Niño and La Niña years. These results will help to support water resource planning in the context of climate change in regions without available data, especially in the Amazon, which, due to its size and conservation areas, faces challenges in attaining hydroclimatic monitoring services.
Acknowledgements
We would like to thank the CNPq (the National Council for Scientific and Technological Development of Brazil) for financially supporting this work through an undergraduate degree scholarship and for the Research Productivity Grant (process 304936/2015-4. We would like to thank the CAPES (Coordination for the Improvement of Higher Education Personnel) for financially supporting this work through a PhD degree scholarship. We would like to thank the office for research (PROPESP) and the Foundation for Research Development (FADESP) at the Federal University of Pará through grant no. PAPQ 2017.
References
Amin, M. T., Rizwan, M., & Alazba, A. A. (2016). A best-fit probability distribution for the estimation of rainfall in northern regions of Pakistan. Open Life Science, 11(1), 432-440.
Bravo, C. J. L., Azpra, R. E., Zarraluqui, S. V., Gay, G. C., & Estrada, P. F. (2012). Cluster analysis for validated climatology stations using precipitation in Mexico. Atmósfera, 25(4), 339-354.
Gaál, L., Szolgay, J., Lapin, M., & Fasko, P. (2009). Hybrid approach to delineation of homogeneous regions for regional precipitation frequency analysis. Journal of Hydrology and Hydromechanics, 57(4), 226-249.
Gnanadesikan, R. (1997). Methods for statistical data analysis of multivariate observations (2nd ed.). New York, NY: John Wiley & Sons.
Gonçalves, M. F.; Blanco, C. J. C., Santos, V. C., & Oliveira, L. L. P. (2016). Identification of Rainfall Homogenous Regions taking into account El Niño and La Niña and Rainfall Decrease in the state of Pará, Brazilian Amazon. Acta Scientiarum, 38(2), 209-216.
Lyra, G. B., Garcia, B. I. L., Piedade, S. M. S., Sediyama, G. C., & Sentelhas, P. C. (2006). Homogeneous regions and probability density functions of pluvial precipitation in Táchira State, Venezuela (in Portuguese). Pesquisa Agropecuária Brasileira, 41(2), 205-215.
Lyra, G. B., Oliveira-Júnior, J. F., & Zeri, M. (2014). Cluster analysis applied to the spatial and temporal variability of monthly rainfall in Alagoas state, Northeast of Brazil. International Journal of Climatology. 34(13), 3546-3558.
Mendonça, F. (2006). Aquecimento Global e suas manifestações regionais e locais: alguns indicadores da região Sul do Brasil. Revista Brasileira de Climatologia, 2(2), p. 71-86.
Modarres, R. (2006). Regional precipitation climates of Iran. Journal of Hydrology (NZ), 45(1), 13-27.
Raju, K. S., & Kumar, D. N. (2007). Classification of Indian meteorological stations using cluster and fuzzy cluster analysis, and Kohonen artificial neural networks. Nordic Hydrology, 38(3), 303-314.
Sanches, F. O., Verdum, R., & Fisch, G. (2013). Estudo de tendência de chuvas de longo prazo. Revista Ambiente & Água, 8(3), 214-228.
Sharma, S. (1996). Applied multivariate techniques. New York, NY: John Wiley & Sons.
Silva Dias, M. A. F.(2006). Efeito estufa e mudanças climáticas regionais. Revista USP, 1(71), p. 44-51.
Ward, J. H. (1963). Hierarchical Grouping to Optimize an Objective Function. Journal of the American Statistical Association, 58(301), 236-244.
Webber, S. R., & Willmott, C. J. (1998). South American Precipitation: 1960-1990 Gridded Monthly Time Series (Version 1.02). Newark, DE: Center for Climatic Research, Department of Geography, University of Delaware.
Yang, T., Shao, Q., Hao, Z., Chen, X., Zhang, Z., Xu, C., & Sun, L. (2010). Regional frequency analysis and spatio-temporal pattern characterization of rainfall extremes in the Pearl River Basin, China. Journal of Hydrology, 380(3-4), 386-405.
Notes