Engenharia Civil
The effect of axle load spectra from AASHTO method on flexible pavement performance
The effect of axle load spectra from AASHTO method on flexible pavement performance
Acta Scientiarum. Technology, vol. 41, 2019
Universidade Estadual de Maringá
Received: 30 January 2017
Accepted: 13 June 2017
Abstract: Currently, methods used for pavement design are empirical and based on experiments conducted in the 1960s. Due to the number of variables that can influence an empirical analysis, the National Cooperative Highway Research Program (NCHRP) proposed a mechanistic-empirical method. Based on this method, the MEPDG (Mechanistic-Empirical Pavement Design Guide) software was developed and later, its improved version, the AASHTO Ware Pavement ME Design. In both software versions, default values were developed from traffic data of the United States. However, characteristics of the Brazilian traffic are different from characteristics in the United States. Therefore, this study aimed to verify the effect on national pavement performance due to the use of the default axle load spectra that are available on both software versions. Thus, computer simulations were performed using Brazilian axle load spectra, based on data collected at the Imigrantes Highway in São Paulo, and using the default load spectra of the software. The results show that the Brazilian axle load spectra studied damages more the national pavement than the default spectra of the software. Therefore, it is not recommended the use of default spectra for designing Brazilian highways similar to the one studied, because this would lead to under-designed structures.
Keywords: MEPDG, AASHTO ware Pavement ME Design, traffic data, pavement design.
Introduction
Traffic characterization is a very important data for the pavement design regarding its performance analysis over time. Therefore, many studies have been conducted in order to represent this data on mathematical and computational models in a more reliable and realistic way for pavement management.
Nowadays, the methods used for pavement design still are empirical and based on experiments conducted in the 1960s. In Brazil, flexible pavements are designed using the empirical method of the Brazilian National Department of Transport Infrastructure (Dnit). This method is based on the design curves developed by United States Army Corps of Engineers (Usace) during the Second World War and the results of the AASHTO road test (1958-1962).
However, it is clear that the current traffic characteristics and type of vehicles differ significantly from those existing in the 1960s. Moreover, through the advance of technology, tires have been developed with greater load-carrying and higher inflation pressure than those existing on that decade. The tire inflation pressure used on the AASHTO Road test was between 483 and 552 kPa. In Brazil, the average inflation pressure is 827 kPa (Fernandes Júnior, Pais, & Pereira, 2007). According to Fontenele and Fernandes Júnior (2014), the increase in the inflation pressure causes more damaging effect on pavement because it reduces the axle load application area and increases the acting forces.
Due to the numerous variables that can influence an empirical analysis, the National Cooperative Highway Research Program (NCHRP) proposed a new method, the mechanistic-empirical method AASHTO 2002 (National Cooperative Highway Research Program [NCHRP], 2004). In this new method, mechanistic responses are used together with empirical data to evaluate and design pavements. One of the main changes that this method introduces is related to traffic data, which is characterized by axle load spectra rather than the equivalent single axle load that was used on the empirical method of AASHTO 1993. According to Tran and Hall (2007), the axle load distribution factors represent the percentage of the total axle applications within each load interval for single, tandem, tridem, and quad axles.
Since this design method was created, many researches have been made in order to develop the axle load spectra for each region. Swan, Tardif, Hajek, and Hein (2008) developed the axle load spectra based on data of two regions in Ontario, Canada, with the aim to implement the new method in that area. Similarly, other authors also developed the axle load spectra in their studies, as: Ahn, Kandala, Uzan, and El-Basyouny (2011); Romanoschi, Momin, Bethu, and Bendana (2011); Fontenele and Fernandes Júnior (2014).
In addition to the advances in pavement studies, the NCHRP developed a test software based on the mechanistic-empirical method, the MEPDG (Mechanistic-Empirical Pavement Design Guide), and after that, its improved version, the AASHTO Ware Pavement ME Design. One of the differences between the MEPDG and the AASHTO Ware Pavement ME Design is related to the climate data base. According to Kim, Ceylan, Ma, and Gopalakrishnan (2014), the new software has a new climate data base. The climate data base used in the MEPDG is ICM format and the data used in the AASHTO Ware Pavement ME Design can be also XML format. Besides that, the AASHTO Ware Pavement ME Design requires more hourly climate data points than MEPDG. However, except for the climate file format, all design input data required in both software versions are identical.
In agreement with Timm, Robbins, Tran, and Rodezno (2014), the MEPDG and the AASHTO Ware Pavement ME Design were created to be modular in a way that new features could be added, exchanged or improved as they became available. According to the authors, although the software contains a top-down cracking model, it is just a placeholder until the NCHRP Project 1-52 (A Mechanistic‐Empirical Model for Top‐Down Cracking of Asphalt Pavement Layers) is concluded. This project has the aim to create a mechanistic-empirical model to predict top-down cracking of asphalt pavement and then incorporate it into the software. Therefore, Timm et al. (2014) suggest that the results for top-down cracking are ignored until the improved model is developed by NCHRP 1-52.
In both design software, the data defined by default axle load spectra were created from traffic data collected in test sections conducted in the United States. However, the Brazilian traffic characteristics differ from the traffic characteristics of the United States, especially regarding transported load, type of vehicles and type of axles. For instance, tridem axle is still largely used in Brazil and it is used with high load limit, while in the United States, according to Haider and Harichandran (2007), the use of this type of axle is increasingly reduced, representing less than 5% of the total axles counted on the studied sites. Therefore, it is necessary to evaluate the reliability in the use of the software to national pavement design and management.
The performance prediction models of both software versions can be or not valid to a specific region according to the local characteristics, for instance, regarding the climate conditions or the traffic load configurations and soil type, the predictions might change. In accordance with American Association of State Highway And Transportation Officials (AASHTO, 2010), it is extremely recommended that each agency analyze the MEPDG results to determine if the performance of the national calibrated models accurately predicts the performance of the study site. If it is not appropriate, the performance prediction models must be calibrated regarding the local conditions. The same recommendation is also valid for the use of the AASHTO Ware Pavement ME Design.
Tarefder and Rodriguez-Ruiz (2013) studied the local calibration of the MEPDG to New Mexico, in which they analyzed 24 flexible pavement sections. The authors calculated calibration coefficients and they verified its efficiency on pavement sections that were not included on the calibration process. The pavement performance predictions obtained through the software, using uncalibrated and calibrated data, were compared with the pavement measured distresses. The authors verified that using the local calibration coefficients reduces the error in the MEPDG prediction. Similar studies on local calibration were made by Li, Muench, Mahoney, Sivaneswaran, and Pierce (2006) in Washington; Hoegh, Khazanovich, and Jensen (2010) in Minnesota; Hall, Xiao, and Wang (2011) in Arkansas.
In addition to the studies of calibration and comparison between both software versions, several authors compared the use of the software default axle load spectra and the use of local axle load spectra. Ahn et al. (2011), for instance, studied the suitability of using the local traffic data and national default values of MEPDG in case of the absence of weigh-in-motion (WIM) data for pavement design. The authors made a comparative study on 14 sections in Arizona where WIM data were available. Initially, they compared the input traffic data and after that they compared the pavement distress predicted by MEPDG.
The authors verified that the national default axle load spectra differed slightly from the site-specific values. Regarding the performance prediction, it was found that moderate prediction errors were generated using the national values, being around 15 percent on average for cracking-related distresses and less than 5 percent on average for other types of distresses. Through this study, the authors emphasized the importance of data accuracy and they pointed out that the national default axle load distribution factors was one of the major source of error on performance prediction for the local studied.
Delgadillo, Wahr, and Alarcón (2011) also conducted a preliminary study to the implementation of the MEPDG in Chile and compared the default load spectra of the software and the local spectra. The axle load distributions were obtained for three important highways near Santiago and it was observed significantly difference when compared with the default load spectra from the software. The differences between the load distributions were evident and the default MEPDG load spectra were less damaging to the pavement than the Chilean ones, which lead to underdesigned pavement structures. Therefore, the authors concluded that the default MEPDG axle load distributions are not applicable to the Chilean reality.
Hence, this study sought to analyze the effect on national pavement performance regarding the adoption of the default axle load spectra available on the two versions of the software developed by NCHRP.
Material and methods
The study was divided in two principle parts: determining the input data in the software (MEPDG and AASHTO Ware Pavement ME Design) and achievement and comparison of the results generated by the software through the performance prediction.
The input data of both software versions are related to pavement structure, traffic data, climate and performance criteria and confidence levels adopted in the design. The design period adopted for flexible pavement was 20 years.
In both software used, there is a default option for axle load spectra input data. These default spectra were determined from test sections throughout the United States and Canada. Therefore, in order to compare these default spectra with the Brazilian traffic data, the axle load spectra developed by Fontenele and Fernandes Júnior (2014) were used as the national traffic data. These load spectra were developed based on data from weighing stations at the Imigrantes Highway in São Paulo. Data were collected in 2008 and the weighing was performed every day of the week during all day (24 hours per day). In total 127,780 vehicles were weighed. The pavement structure and the climate were based on that used by Fontenele and Fernandes Júnior (2014), taking into account the region of obtaining the axle load spectra data.
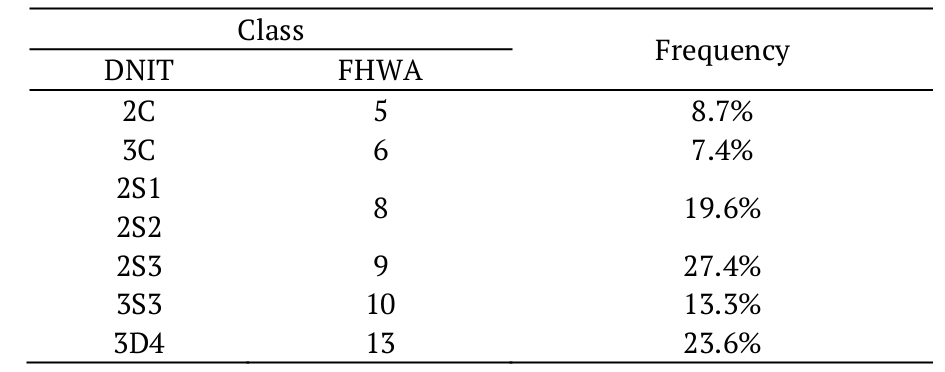
The Brazilian vehicle classification adopted by DNIT is divided in 32 classes and the Federal Highway Administration (FHWA) vehicle classification has only 13 classes. To correlate the Brazilian vehicle classes with the classes used in the software, Fontenele and Fernandes Júnior (2014) adopted the correspondence as shown in Table 1. The corresponding frequency of each vehicle class used is also shown in Table 1. The vehicle classes analyzed are the ones that Fontenele and Fernandes Júnior (2014) verified on the studied road.
In order to analyze the traffic data of the software and the Brazilian data, graphics of axle load as a function of the relative frequency were constructed for each class of vehicle analyzed in this study. In Figure 1 and 2, it is shown these graphics correspondent to vehicles of classes: 5 (2C), 6 (3C), 8 (2S1 and 2S2), 9 (2S3), 10 (3S3) and 13 (3D4). In these graphics, the Brazilian data collected at the Imigrantes Highway is compared with the default data through the relative frequency distribution of each axle of the vehicles.
In all the vehicle classes analyzed, the load distribution of the Brazilian data differs from the load distribution of the software default data. For instance, tridem axle of class 10 presented a very different distribution between spectra studied and this type of axle is largely used in Brazil. Besides that, in all axles of the studied classes, the Brazilian data were more damaging to the pavement than the American data, as it has more frequency at higher loads.
According to Fernandes et al. (2007), the average inflation pressure currently used in Brazil is around 827 kPa. In order to compare the tires inflation pressure utilized in the experiments conducted in the 1960s and the average inflation pressure used in Brazil, the pressures of 552 and 827 kPa were used in the simulations.
Thus, the only input data that varied from one simulation to another were: the load spectra (default and national) and the tires inflation pressure, 552 and 827 kPa.
From the input data specified, performance predictions were made through the simulations of MEPDG and AASHTO ware Pavement ME Design. The predictions were generated separately from simulations combining the Brazilian and the default load spectra with inflation pressure of 552 and 827 kPa.
In order to compare the pavement performance using the different configurations of axle loads, the following distresses were analyzed: Longitudinal Cracking (up-down), Fatigue Cracking (bottom-up), Rutting in the wheel paths and International Roughness Index (IRI). The performance criteria adopted for each distress on pavement design was: 189 m km-1 maximum longitudinal cracking; 25% fatigue cracking; 19.5 mm rutting and 2.71 m km-1 IRI.
Results and discussion
Through the software, MEPDG and AASHTO ware Pavement ME Design, the traffic data were analyzed in relation to the distresses predicted for the design period. Besides that, a comparison between the results obtained in each software version was draw in order to highlight the main differences between them.
Figure 3 illustrates the evolution curves of fatigue cracking over time obtained through the software MEPDG and AASHTO ware Pavement ME Design, using tires inflation pressure at 552 kPa. The load spectra called as ‘national’ refers to the Brazilian traffic data collected at the Imigrantes Highway and the ‘default’ data refers to the data obtained as default in the software.
Through the performance curves obtained with the MEPDG and AASHTO ware Pavement ME Design, it is possible to observe that for the tires inflation pressure at 552 kPa, the use of the Brazilian spectra in the performance analysis leads the pavement to reach the design limit before than of the default spectra. Moreover, in MEPDG analysis, the default spectra did not make the pavement to reach the design limit on all period of time studied.
Further, comparing the predicted values by the MEPDG and AASHTO ware Pavement ME Design it is possible to observe that, for fatigue cracking, the values of the distresses generated by the Brazilian spectra decreased with the AASTHO ware Pavement ME Design and for the default spectra, the values increased.
In Figure 4, the evolution curves of fatigue cracking over time obtained through the software MEPDG and AASHTO ware Pavement ME Design are shown, for the tires inflation pressure at 827 kPa.
For the tires inflation pressure at 827 kPa, analyzing the performance curves obtained with the MEPDG and AASHTO ware Pavement ME Design, it is possible to observe that the Brazilian load spectra are more damaging to the pavement, similarly as observed with the tires pressure at 552 kPa.
In the same way as with 552 kPa, comparing both software versions using 827 kPa, the predicted values for fatigue cracking using the Brazilian spectra decreased in AASTHO ware Pavement ME Design and using the default spectra, the values increased.
Regarding the tires inflation pressures in Figure 3 and 4, the inflation pressure at 827 kPa made the pavement reach the design limit before the pressure of 552 kPa. Analyzing the Brazilian load spectra separately, in the MEPDG and AASHTO ware Pavement ME Design, when using the inflation pressure at 827 kPa, the design limit is reached before than when using the pressure at 552 kPa. The difference between the cracks reached by the two pressures at the end of the design period is more than 10%, being greater for the pressure of 827 kPa
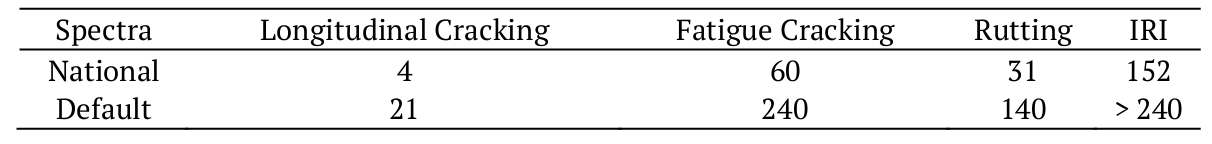
The same evaluation was made for the distresses of longitudinal cracking, rutting in the wheel paths and IRI. Table 2 and 3 summarize the results obtained with the MEPDG and Table 4 and 5 the results obtained with AASHTO ware Pavement ME Design for all distresses. Therefore, the month in which the distress reaches the design limit is presented, according to the traffic configuration and tire inflation pressure specified.

Figure 1 .
Load distribution: class 5 (2C), 6 (3C), 8 (2S1 and 2S2), 9 (2S3) and 10 (3S3).

Figure 2.
Load distribution: class 10 (3S3) and 13 (3D4).
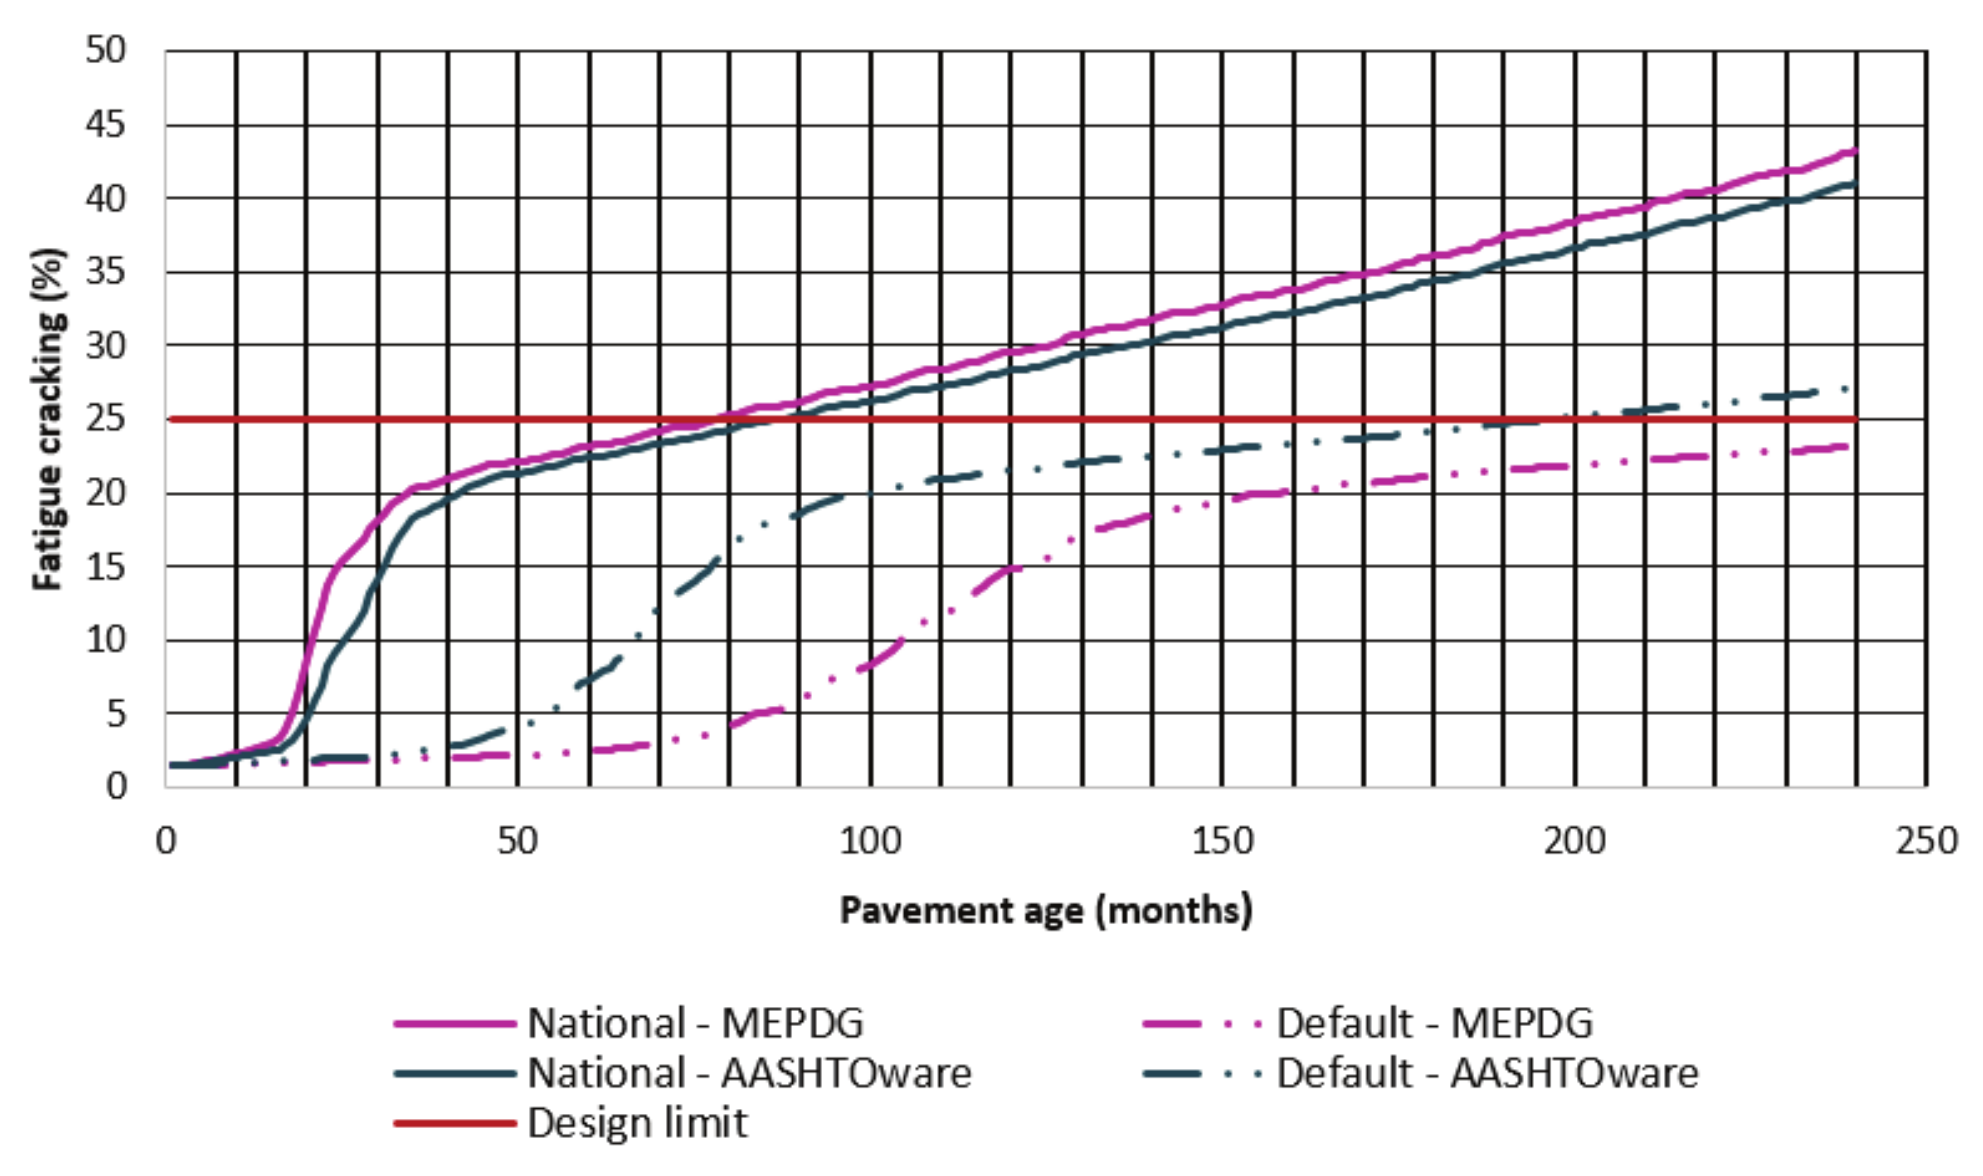
Figure 3.
Fatigue cracking with tires inflation pressure at 552 kPa.
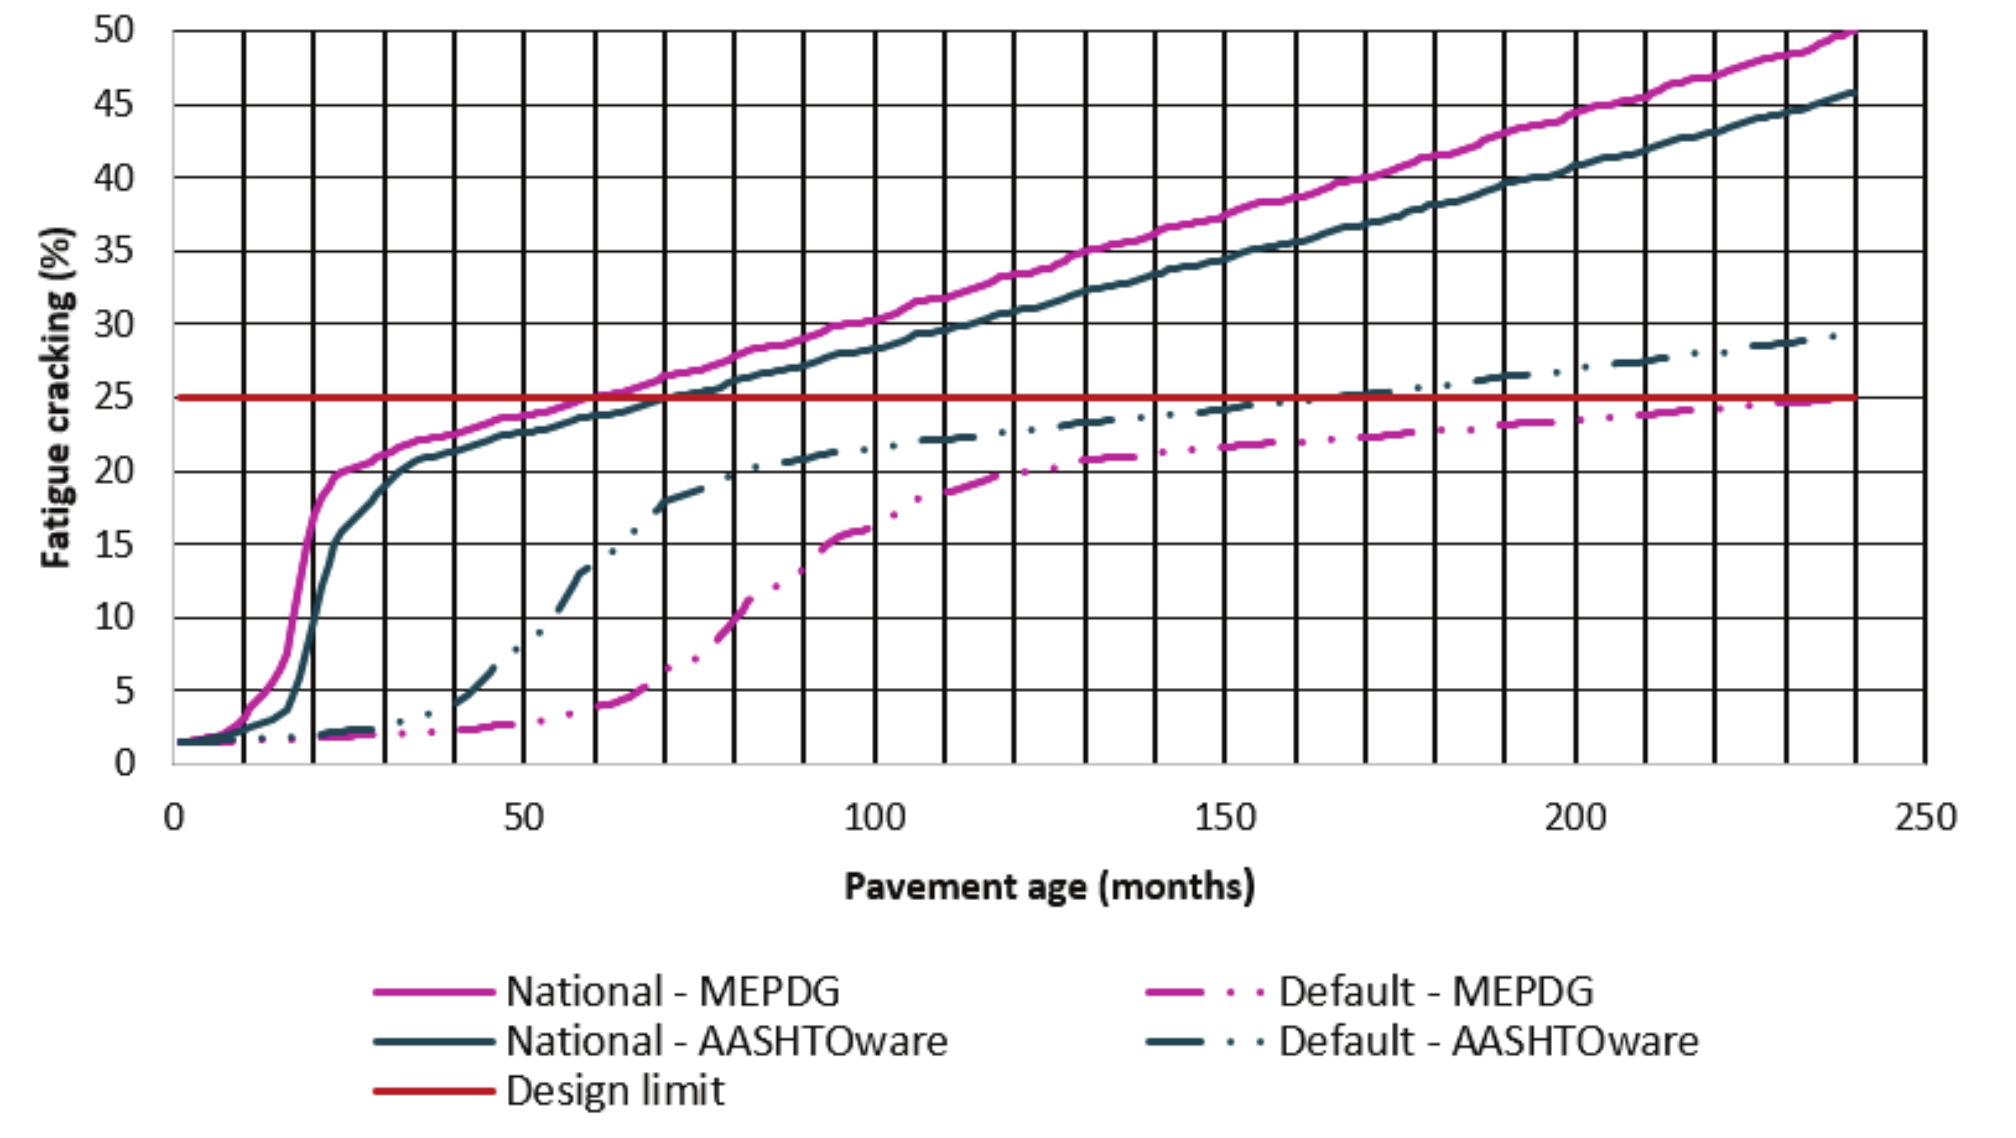
Figure 4.
Fatigue cracking with tires inflation pressure at 827 kPa.
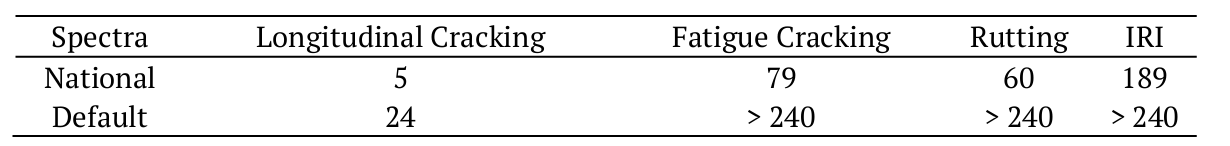
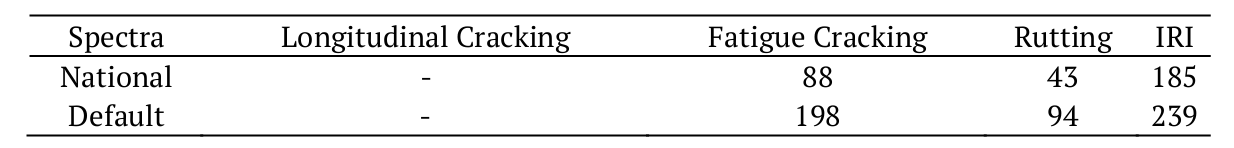
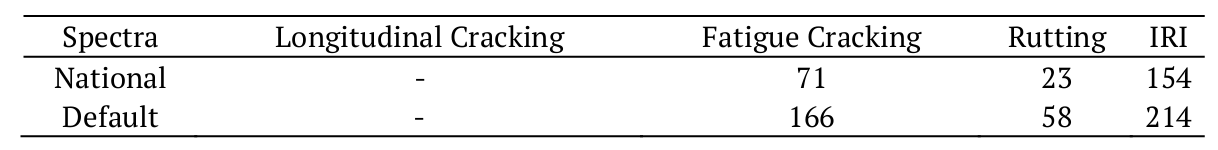
The AASHTO ware Pavement ME Design did not present in the simulation report the longitudinal cracking data over the design period, month by month, as the MEPDG. According to Timm et al. (2014), the NCHRP is still developing an empirical-mechanistic model to better predict longitudinal cracking. Consequently, the new version of the software only shows the result at the end of the 20-year period for this type of distress and for that reason it was not possible to analyze which month the pavement reaches the design limit for this distress, as shown in Table 4 and 5.
Comparing the differences found between the months when each spectra reached the design limit, it is possible to observe that for all distresses analyzed, the national load spectra studied made the pavement to reach the design limit months before than when using the default load spectra. For some traffic configurations, the default load spectra completed the design period of 20 years without reaching the maximum values adopted as performance criteria. In addition, for all distresses analyzed, increasing the tires inflation pressure to 827 kPa made the design limit to be reached in less time.
The worst response of the Brazilian spectra studied in all distresses evaluated is definitely related to the differences found on load distribution presented in Figure 1 and 2. As mentioned before, main frequencies at higher loads are found on the Brazilian spectra studied, for that reason, this worst response was already expected.
In addition, comparing the predicted values in the MEPDG and AASHTO ware Pavement ME Design it is possible to observe that, for fatigue cracking, the values reached by the pavement when used the Brazilian spectra decreased with AASTHO ware Pavement ME Design and with the default spectra, the values increased for both tire inflation pressures studied. The same did not occur for rutting because for this distress, all values increased in the simulations of AASHTO ware Pavement ME Design regarding those predicted in the MEPDG, which made the pavement to reach the design limit earlier using the AASHTO ware Pavement ME Design simulations. IRI values did not vary significantly from one software version to another and longitudinal cracking was not compared between the softwares because the new version did not indicate the month when design limit was achieved.
These differences between the values found in the softwares may be related to the fact that the climatic base used is different for each software version. The AASHTO ware Pavement ME Design has a climatic base more precise than the MEPDG due to the greater amount of data required. In addition, it may also be related to changes in the routine of software calculations.
Conclusion
Based on the traffic data, climate, material and conditioning data studied, it can be concluded that the Brazilian load spectra differ significantly from the default load spectra available in the MEPDG and AASHTO ware Pavement ME Design. For all axles studied, the Brazilian data have greater frequency at higher loads. This difference reflected on pavement performance because for all distresses analyzed in the software simulations, the Brazilian load spectra were more damaging to the pavement than the default load spectra of the software. Therefore, the default data available on MEPDG and AASHTO ware Pavement ME Design are not applicable to the reality of the Brazilian highways with similar characteristics to the highway studied. Hence, it is not recommended the use of the default load spectra of the software for the design of Brazilian highways, whose traffic data are not available, because the distresses would reach the limit before expected and the pavement would be underdesigned.
In empirical methods, the tire inflation pressure considered is 552 kPa but the reality of the Brazilian highways is different, as the average pressure used is 827 kPa. Therefore, regarding the results found herein for both tire pressures studied, it can be concluded that the pavement will deteriorate faster when using empirical method to design Brazilian highways, because, in this way, the pavement is designed for a situation that is not realistic and its performance will be worse than predicted.
Regarding the comparison between all the results obtained by the software versions studied, it could be observed that the results vary from one version to other. These differences found between the performance results may be related to the climatic base used in the software, as the base used in AASHTO ware Pavement ME Design is more accurate and with greater amounts of climate data than the base used in the MEPDG. Moreover, climate changes, such as temperature and rainfall, can influence pavement performance when requested by traffic loads. Furthermore, it may also be related to changes in the routine of software calculations as the prediction models are the same for both versions studied.
Acknowledgements
The authors would like to thank Araucaria Foundation (State of Paraná Research Foundation) and Conselho Nacional de Desenvolvimento Científico e Tecnológico (CNPq) for financial support for the research (14/2011 - 24685).
References
Ahn, S., Kandala, S., Uzan, J., & El-Basyouny, M. (2011). Impact of traffic data on the pavement distress predictions using the mechanistic empirical pavement design guide. Road Materials and Pavement Design, 12(1), 195-216. doi: 10.1080/14680629.2011.9690359
American Association of State Highway and Transportation Officials [AASHTO]. (2010). Guide for the local calibration of the mechanistic-empirical pavement design guide. Washington, DC: AASHTO.
Delgadillo, R., Wahr, C., & Alarcón, J. P. (2011). Toward implementation of the mechanistic-empirical pavement design guide in Latin America: preliminary work in Chile. Transportation Research Record: Journal of the Transportation Research Board, 2226, 142-148. doi: 10.3141/2226-16
Fernandes Júnior, J. L., Pais, J. C., & Pereira, P. A. A. (2007). Avaliação dos efeitos das solicitações do tráfego sobre o desempenho de pavimentos flexíveis portugueses e brasileiros. Revista Pavimentação, II(5), 28-38. doi: 10.1590/2238-1031.jtl.v9n1a4
Fontenele, H. B., & Fernandes Júnior, J. L. (2014). O efeito da caracterização do tráfego no desempenho do pavimento flexível. Ciência & Engenharia, 23(1), 9-16. doi: 10.14393/19834071.2014.24552
Haider, S. W., & Harichandran, R. S. (2007). Relating axle load spectra to truck gross vehicle weights and volumes. Journal of Transportation Engineering, 133(12), 696-705. doi: 10.1061/(ASCE)0733-947X(2007)133:12(696)
Hall, K. D., Xiao, D. X., & Wang, K. C. P. (2011). Calibration of the mechanistic-empirical pavement design guide for flexible pavement design in Arkansas. Transportation Research Record: Journal of the Transportation Research Board, 2226(1), 135-141. doi: 10.3141/2226-15
Hoegh, K., Khazanovich, L., & Jensen, M. R. (2010). Local calibration of mechanistic-empirical pavement design guide rutting model: Minnesota road research project test sections. Transportation Research Record: Journal of the Transportation Research Board, 2180(1), 130-141. doi: 10.3141/2180-15
Kim, S., Ceylan, H., Ma, D., & Gopalakrishnan, K. (2014). Calibration of pavement ME design and mechanistic-empirical pavement design guide performance prediction models for Iowa pavement systems. Journal of Transportation Engineering, 140(10), 04014052-1 - 04014052-13. doi: 10.1061/(ASCE)TE.1943-5436.0000704
Li, J., Muench, S. T., Mahoney, J. P., Sivaneswaran, N., & Pierce, L. M. (2006). Calibration of NCHRP 1-37A software for the Washington State department of transportation: rigid pavement portion. Transportation Research Record: Journal of the Transportation Research Board, 1949(1), 43-53. doi: 10.3141/1949-05
National Cooperative Highway Research Program [NCHRP]. (2004). Guide for mechanistic-empirical design of new and rehabilitated pavement structures. Final report NCHRP 1-37 A. Champaign, IL: NCHRP.
Romanoschi, S. A., Momin, S., Bethu, S., & Bendana, L. (2011). Development of traffic inputs for new mechanistic-empirical pavement design guide. Transportation Research Record: Journal of the Transportation Research Board, 2256, 142-150. doi: 10.3141/2256-17
Swan, D. J., Tardif, R., Hajek, J. J., & Hein, D. K. (2008). Development of regional traffic data for the mechanistic-empirical pavement design guide. Transportation Research Record: Journal of the Transportation Research Board, 2049, 54-62. doi: 10.3141/2049-07
Tarefder, R., & Rodriguez-Ruiz, J. I. (2013). Local calibration of MEPDG for pavements in New Mexico. Journal of Transportation Engineering, 139(10), 981-991. doi: 10.1061/(ASCE)TE.1943-5436.0000576
Timm, D. H., Robbins, M. M., Tran, N., & Rodezno, C. (2014). Flexible pavement design – state of the practice (NCAT Report 14-04). Auburn, AL: National Asphalt Pavement Association.
Tran, N. H., & Hall, K. D. (2007). Development and influence of statewide axle load spectra on flexible pavement performance. Transportation Research Record: Journal of the Transportation Research Board, 2037, 106-114. doi: 10.3141/2037-10